. 2020 Oct 30;21(21):8119.
doi: 10.3390/ijms21218119.

Expression of EMT-Related Genes in Hybrid E/M Colorectal Cancer Cells Determines Fibroblast Activation and Collagen Remodeling

Affiliations

Expression of EMT-Related Genes in Hybrid E/M Colorectal Cancer Cells Determines Fibroblast Activation and Collagen Remodeling

Irina Druzhkova et al. Int J Mol Sci. .

Abstract

Collagen, the main non-cellular component of the extracellular matrix (ECM), is profoundly reorganized during tumorigenesis and has a strong impact on tumor behavior. The main source of collagen in tumors is cancer-associated fibroblasts. Cancer cells can also participate in the synthesis of ECM; however, the contribution of both types of cells to collagen rearrangements during the tumor progression is far from being clear. Here, we investigated the processes of collagen biosynthesis and remodeling in parallel with the transcriptome changes during cancer cells and fibroblasts interactions. Combining immunofluorescence, RNA sequencing, and second harmonic generation microscopy, we have explored the relationships between the ratio of epithelial (E) and mesenchymal (M) components of hybrid E/M cancer cells, their ability to activate fibroblasts, and the contributions of both cell types to collagen remodeling. To this end, we studied (i) co-cultures of colorectal cancer cells and normal fibroblasts in a collagen matrix, (ii) patient-derived cancer-associated fibroblasts, and (iii) mouse xenograft models. We found that the activation of normal fibroblasts that form dense collagen networks consisting of large, highly oriented fibers depends on the difference in E/M ratio in the cancer cells. The more-epithelial cells activate the fibroblasts more strongly, which correlates with a dense and highly ordered collagen structure in tumors in vivo. The more-mesenchymal cells activate the fibroblasts to a lesser degree; on the other hand, this cell line has a higher innate collagen remodeling capacity. Normal fibroblasts activated by cancer cells contribute to the organization of the extracellular matrix in a way that is favorable for migratory potency. At the same time, in co-culture with epithelial cancer cells, the contribution of fibroblasts to the reorganization of ECM is more pronounced. Therefore, one can expect that targeting the ability of epithelial cancer cells to activate normal fibroblasts may provide a new anticancer therapeutic strategy.

Keywords: cancer-associated fibroblasts; collagen remodeling; colorectal cancer cells; epithelial/mesenchymal state; fibroblast activation.


Conflict of interest statement

The authors declare no conflict of interest. The funders had no role in the design of the study; in the collection, analyses, or interpretation of data; in the writing of the manuscript, or in the decision to publish the results.

Figures

Figure 1
Figure 1
Identification of epithelial/mesenchymal state of five human colorectal cancer cell lines. (A) Monitoring of cell migration using wound-healing assay. Representative microscopic images of wound closure at 0, 48, or 72 h post wounding. Scale bar, 400 μm. (B) Spheroid formation ability of colorectal cancer cell lines. Cell lines were cultured on ultra-low attachment round-bottom plates, and the optical microscopy images were obtained 7 days after cell seeding. Scale bar, 400 μm. (C) Cell migration- and adhesion-related Gene Ontology Biological Process (GO BP) terms that are enriched in sets of differentially expressed genes between the HT29 and SW480 cancer cell lines. RNA-seq data were used to identify differentially expressed genes (|log2(FC)| >1) that were subjected to functional enrichment analyses using the DAVID analysis tool to identify enriched GO BP terms. (D) Immunofluorescence staining of the indicated cell lines for the epithelial cell adhesion molecule (EpCAM) (red) and the epithelial marker E-cadherin (green) and mesenchymal markers vimentin (green). Representative fluorescence microscopic images showing the epithelial phenotype of HT29 cells and the mesenchymal phenotype of SW480 cells. Scale bar, 400 μm. (E) Expression of epithelial and mesenchymal marker genes differentially expressed between HT29 and SW480 cancer cells. RNA-seq data were used to calculate the gene expression levels in transcripts per kilobase million (TPM). Mean values ± standard deviation in triplicate are shown.
Figure 2
Figure 2
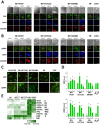
Activation of normal fibroblasts upon co-culturing with colorectal cancer cells. Immunofluorescence staining of the co-cultures of HT29, HCT116, or SW480 cells with normal fibroblasts (NFs) on days 1, 2, 5 and 7, NFs and patient-derived CAFs for (A) FAP, fibroblast activation protein α1, and (B) aSMA, α-smooth muscle actin. Cells were additionally stained against 4′,6-diamidino-2-phenylindole (DAPI; nucleus; blue) and EpCAM (epithelial cell adhesion molecule; red). Scale bar, 400 μm (C) A higher magnification of the areas corresponding to the dashed square in (A), (B). Scale bar, 100 μm. (D) Quantification of FAP and aSMA staining (averaged fluorescence intensity of fibroblasts, at least eight regions of interest (ROIs) per condition with 2–5 cells in each ROI). Mean ± SD. *, p < 0.05 from NF. (E) Gene expression heatmap of cancer-associated fibroblast (CAF) markers with differential activity in various types of fibroblasts. NFs—normal skin fibroblasts, NFHT29—normal fibroblasts isolated from co-cultures with HT29 cancer cells on day 5, NFSW480—normal fibroblasts isolated from co-cultures with SW480 cancer cells on day 5, CAF1-2—colon cancer-associated fibroblasts (cultures 1 and 2). p-adj < 0.05 for gene expression in NFs compared to *, NFHT29; #, NFSW480; &, CAF1; $, CAF2.
Figure 3
Figure 3
In vitro fibrillar collagen assessment in collagen-based 3D models using second harmonic generation (SHG) microscopy. The collagen structure in 3D systems containing cancer cells and/or fibroblasts in collagen gel was monitored with SHG microscopy and then quantified using the parameters of the SHG signal. Right: Representative SHG images (red) combined with two-photon excited fluorescence (TPEF, green) images of monocultures of cancer cells (A), co-cultures of cancer cells and normal fibroblasts (B), and monocultures of normal fibroblasts (NFs) and patient-derived CAFs (C). Bar is 50 µm, applicable to all images. Left: Several quantitative parameters of the SHG signals including density, energy, kurtosis, and coherency. Mean ± SD. Imaging was performed at 1, 2, 5, and 7 days of culturing cells in collagen gel. Key: *, p < 0.05 from Day 1; #, p < 0.05 from corresponding monoculture of cancer cells on the same day, +, p < 0.05 from NFs on the same day, &, p < 0.05 from CAFs on the same day. All values are given in arbitrary units (a.u.). All quantitative parameters of the SHG signal and p-values are given in Supplementary Tables S5–S7.
Figure 3
Figure 3
In vitro fibrillar collagen assessment in collagen-based 3D models using second harmonic generation (SHG) microscopy. The collagen structure in 3D systems containing cancer cells and/or fibroblasts in collagen gel was monitored with SHG microscopy and then quantified using the parameters of the SHG signal. Right: Representative SHG images (red) combined with two-photon excited fluorescence (TPEF, green) images of monocultures of cancer cells (A), co-cultures of cancer cells and normal fibroblasts (B), and monocultures of normal fibroblasts (NFs) and patient-derived CAFs (C). Bar is 50 µm, applicable to all images. Left: Several quantitative parameters of the SHG signals including density, energy, kurtosis, and coherency. Mean ± SD. Imaging was performed at 1, 2, 5, and 7 days of culturing cells in collagen gel. Key: *, p < 0.05 from Day 1; #, p < 0.05 from corresponding monoculture of cancer cells on the same day, +, p < 0.05 from NFs on the same day, &, p < 0.05 from CAFs on the same day. All values are given in arbitrary units (a.u.). All quantitative parameters of the SHG signal and p-values are given in Supplementary Tables S5–S7.
Figure 4
Figure 4
Expression of collagen-related genes in cancer cells and its changes as a result of the co-cultivation of cancer cells with normal fibroblasts. (A) Venn diagrams showing the overlap between significantly expressed collagen-related genes (p-adj < 0.05; TPM ≥ 5) in colorectal cancer cell lines HT29 and SW480 in monoculture. Three gene categories are shown: collagen biosynthesis and positive regulation (B+PR), collagen fibril organization and extracellular matrix (ECM) aggregation (CFO+EA), and collagen catabolism and negative regulation (C+NR). (B) Histogram showing the expression of collagen-related genes, differentially expressed (p-adj < 0.05; TPM ≥5; │log2(FC)│ ≥ 1) in HT29 (red gene name) and SW480 (blue gene name). Red and blue bars represent the expression of genes in HT29 and SW480, respectively. Mean values (n = 3) are shown in TPM, error bars represent the standard deviation (n = 3). (C) Box plots representing changes of collagen-related gene expression as a result of co-cultivation of HT29 or SW480 cell lines with normal fibroblasts (NFs). The distributions of the log2(FC) values for significantly expressed collagen-related genes (p-adj < 0.05; TPM ≥ 5) in 3 gene categories (B+PR, CFO+EA, and C+NR) are shown; that is, the expression of the gene in co-culture divided by the expression of the gene in monoculture. Thus, gene expression that is up-regulated during co-cultivation has log2(FC) > 0, and gene expression that is down-regulated during co-cultivation has log2(FC) < 0. The twenty-fifth, fiftieth, and seventy-fifth percentiles are used; whiskers show the minimal and maximal log2(FC)-values. White boxes represent the changes of collagen-related gene expression in the cancer cells (HT29 or SW480); gray boxes represent the changes of collagen-related gene expression in the NFs. The red line indicates log2(FC) = 0, that is, no change in gene expression. The number of genes (n) used for each box is indicated on the right side of the chart.
Figure 5
Figure 5
Differential expression of the collagen-related genes in co-cultivated cancer cells and fibroblasts. (A) Venn diagrams showing the overlap between significantly expressed collagen-related genes (p-adj <0.05; TPM ≥5) in co-cultivated colorectal cancer cell lines (HT29NF and SW480NF) and normal fibroblasts (NFHT29 and NFSW480). Three gene categories are shown: collagen biosynthesis and positive regulation, collagen fibril organization and ECM aggregation, and collagen catabolism and negative regulation. (B) Scheme showing localization of collagen-related proteins that can determine differences in collagen remodeling by different co-cultures. Collagen-related differentially expressed genes (p-adj <0.05; TPM ≥5; │log2(FC)│≥1)) were determined between cancer cells and between fibroblasts of both co-cultures. Some SW480 DEGs encoding extracellular proteins were excluded because of their much higher expression in fibroblasts (log2(FC) ≥5).
Figure 6
Figure 6
In vivo collagen structure in HT29 and HCT116 tumor xenograft. (A) Histopathology images on the 14th day of tumor growth. Hematoxylin and eosin staining. Scale bar, 50 μm. (B) Tumor volume (V) measurements on 14th day of growth. Mean ± SEM. (C) Representative SHG images (red, collagen fibers) combined with two-photon excited fluorescence images (TPEF, green, cellular autofluorescence) of tumors. Image size is 212 × 212 μm. Scale bar, 50 μm. (D) Quantitative parameters of the SHG signal including density, energy, kurtosis, and coherency. Mean ± SEM, (n = 3–4 tumors, at least 15 fields of view in each tumor). Cancer cells were implanted subcutaneously in nude mice. Imaging was performed on Day 14 of tumor growth. SHG images and quantitative analysis of the SHG signal show a denser and more oriented collagen structure in the HT29 compared with HCT116 tumors. p-values denote significant differences.

Similar articles

Cited by

References

    1. Hanahan D., Coussens L.M. Accessories to the Crime: Functions of Cells Recruited to the Tumor Microenvironment. Cancer Cell. 2012;21:309–322. doi: 10.1016/j.ccr.2012.02.022. - DOI - PubMed
    1. Sverdlov E. Missed Druggable Cancer Hallmark: Cancer–Stroma Symbiotic Crosstalk as Paradigm and Hypothesis for Cancer Therapy. Bioessays. 2018;40:1800079. doi: 10.1002/bies.201800079. - DOI - PubMed
    1. Valkenburg K.C., De Groot A.E., Pienta K.J. Targeting the tumour stroma to improve cancer therapy. Nat. Rev. Clin. Oncol. 2018;15:366–381. doi: 10.1038/s41571-018-0007-1. - DOI - PMC - PubMed
    1. Chopra V., Sangarappillai R.M., Romero-Canelón I., Jones A.M. Lysyl Oxidase Like-2 (LOXL2): An Emerging Oncology Target. Adv. Ther. 2020;3:1900119. doi: 10.1002/adtp.201900119. - DOI
    1. Sahai E., Astsaturov I., Cukierman E., DeNardo D.G., Egeblad M., Evans R.M., Fearon D., Greten F.R., Hingorani S.R., Hunter T., et al. A framework for advancing our understanding of cancer-associated fibroblasts. Nat. Rev. Cancer. 2020;20:174–186. doi: 10.1038/s41568-019-0238-1. - DOI - PMC - PubMed

MeSH terms