. 2020 Oct 30;12(11):3205.
doi: 10.3390/cancers12113205.

p53 Loss Mediates Hypersensitivity to ETS Transcription Factor Inhibition Based on PARylation-Mediated Cell Death Induction

Affiliations

p53 Loss Mediates Hypersensitivity to ETS Transcription Factor Inhibition Based on PARylation-Mediated Cell Death Induction

Carina Dinhof et al. Cancers (Basel). .

Abstract

The small-molecule E26 transformation-specific (ETS) factor inhibitor YK-4-279 was developed for therapy of ETS/EWS fusion-driven Ewing's sarcoma. Here we aimed to identify molecular factors underlying YK-4-279 responsiveness in ETS fusion-negative cancers. Cell viability screenings that deletion of P53 induced hypersensitization against YK-4-279 especially in the BRAFV600E-mutated colon cancer model RKO. This effect was comparably minor in the BRAF wild-type HCT116 colon cancer model. Out of all ETS transcription factor family members, especially ETS1 overexpression at mRNA and protein level was induced by deletion of P53 specifically under BRAF-mutated conditions. Exposure to YK-4-279 reverted ETS1 upregulation induced by P53 knock-out in RKO cells. Despite upregulation of p53 by YK-4-279 itself in RKOp53 wild-type cells, YK-4-279-mediated hyperphosphorylation of histone histone H2A.x was distinctly more pronounced in the P53 knock-out background. YK-4-279-induced cell death in RKOp53-knock-out cells involved hyperPARylation of PARP1, translocation of the apoptosis-inducible factor AIF into nuclei, and induction of mitochondrial membrane depolarization, all hallmarks of parthanatos. Accordingly, pharmacological PARP as well as BRAFV600E inhibition showed antagonistic activity with YK-4-279 especially in the P53 knock-out background. Taken together, we identified ETS factor inhibition as a promising strategy for the treatment of notoriously therapy-resistant p53-null solid tumours with activating MAPK mutations.

Keywords: ETS factor inhibitor; ETS1; PARylation; YK-4-279; p53; parthanatos.


Conflict of interest statement

M.P. has received honoraria for lectures, consultation or advisory board participation from the following for-profit companies: Bayer, Bristol-Myers Squibb, Novartis, Gerson Lehrman Group (GLG), CMC Contrast, GlaxoSmithKline, Mundipharma, Roche, BMJ Journals, MedMedia, Astra Zeneca, AbbVie, Lilly, Medahead, Daiichi Sankyo, Sanofi, Merck Sharp & Dome, Tocagen. The following for-profit companies have supported clinical trials and contracted research conducted by MP with payments made to his institution: Böhringer-Ingelheim, Bristol-Myers Squibb, Roche, Daiichi Sankyo, Merck Sharp and Dome, Novocure, GlaxoSmithKline, AbbVie. WB has received honoraria for lectures, consultation or advisory board participation from: Bristol-Myers Squibb, Novartis, Merck Sharp & Dome, Roche, Astra Zeneca and AbbVie. All other authors declare no conflicts of interest.

Figures
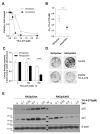
Figure 1
Figure 1
Loss of p53 mediates hypersensitivity to YK-4-279. (A) Impact of 72 h exposure to YK-4-279 at the indicated concentrations on viability of RKO colon carcinoma cells with wild-type (RKOp53wt) or deleted p53 (RKOp53KO) background was determined by 3-(4,5-dimethylthiazol-2-yl)-2,5-diphenyltetrazolium (MTT)-based survival assay. Values are given as mean ± standard deviations (SDs) of one representative experiment performed in triplicate. Statistical comparison was performed by two-way ANOVA with Bonferroni post-test. (B) Mean IC50 values for RKOp53wt and RKOp53KO cells derived from at least 4 independent experiments are given in µM ± SD. One-way ANOVA was used to test for statistical significance. (C) Colony formation capacity of RKOp53wt and RKOp53KO cells treated for 7 days with YK-4-279 at the indicated concentrations. Results are based on quantification of crystal violet staining (fluorescence intensity). Values are given normalized to untreated controls as means ± SD of one representative out of three experiments performed in triplicate. Statistical analysis was performed by two-way-ANOVA with Bonferroni post-test. (D) Representative photographs for the experiment analyzed in (C) are shown. (E) Protein expression levels of p53 and p21 following YK-4-279 treatment as indicated in the two RKO sublines were analyzed by Western blot. β-actin served as loading control. M = marker. Concerning all statistical analyses, p values less than 0.05 were considered significant, with * p < 0.05, ** p < 0.01, **** p < 0.0001.
Figure 2
Figure 2
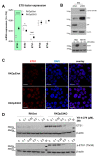
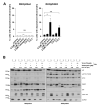
Expression/phosphorylation of ETS1 is increased in a p53 knock-out RKO colon cancer background. (A) mRNA expression levels of the indicated E26 transformation-specific ETS factors were assessed by qRT-PCR in the RKO cell model as indicated. Values were normalized to the housekeeping gene RPL-41. Students t-test was used for testing statistical significance with * p < 0.05, *** p < 0.001, and **** p < 0.0001. (B) Expression of ETS1 in the indicated colon cancer cell models was detected by Western blot analysis of total protein extracts. In the upper panel, p53 expression levels are shown for background confirmation. (C) Subcellular localization of ETS1 (red) in RKOp53wt and RKOp53KO cells was determined by immunofluorescence staining. 4′,6-Diamidino-2-phenylindole DAPI (blue) was used as nuclear counterstain. Representative fluorescence photomicrographs are shown. The scale bar indicates 20 µm. (D) Impact of YK-4-279 on expression of total and phosphorylated (Thr38) ETS1 levels in RKOp53wt and RKOp53KO cells was detected by Western blot analysis. β-actin was used as loading control.
Figure 3
Figure 3
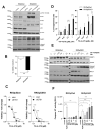
Impact of p53 status on YK-4-279-mediated cell death induction and role of ETS1. (A) Efficacy of ETS1 knock-down upon 72-h siRNA treatment and impact on the protein levels of the indicated ETS factors, p53, as well as total and cleaved PARP were determined by Western blot in the indicated RKO cell subclones. β-actin served as loading control. (B) Effect of ETS1 knock-down on RKO cell viability was measured 72 h post-transfection. Data are given as a percentage of viability reduction by ETS1-specific as compared to scrambled-control siRNA (mean ± SD) from three experiments. Statistical analysis was performed using unpaired Student’s t-test. (C) Effect of ETS1 knockdown (72 h) on sensitivity of the indicated RKO sublines against a 72-h treatment with YK-4-279 was assessed by 3-(4,5-dimethylthiazol-2-yl)-2,5-diphenyltetrazolium (MTT)-based viability assay. Statistical analysis was performed using two-way ANOVA with Bonferroni post-test. (D) Percentage of fragmented RKO cells following YK-4-279 exposure as indicated was determined by flow cytometry. Values are given as mean ± SD of three independent experiments. Statistical significance was tested by two-way-ANOVA with Bonferroni post-test. (E) Impact of a 24-h YK-4-279 exposure at the indicated concentrations on expression/cleavage of PARP1 as well as the bcl-2 family members MCL-1 (anti-apoptotic) and BAX (pro-apoptotic) was analyzed by Western blot. β-actin served as loading control. M = marker. (F) Effect of 24-h YK-4-279 exposure on caspase 3/7 activity in RKOp53wt as compared to RKOp53KO cells was determined by luminescence assay. Results are given as mean (± SD) relative luminescence units (RLUs) from three experiments in triplicate. One-way ANOVA with Bonferroni post-test was used for testing statistical significances. Concerning all statistical analyses, p values less than 0.05 were considered significant, with * p < 0.05, ** p < 0.01, *** p < 0.001, and **** p < 0.0001.
Figure 4
Figure 4
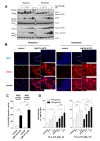
Association between the p53 status and PARylation of PARP1 as well as induction of DNA damage by YK-4-279. (A) Effect of YK-4-279 treatment (24 h) at the indicated concentrations on PARylation (indicated by pADPr) of PARP1 as compared to the levels of full-length PARP1, cleaved PARP1 and γH2A.x analyzed in RKOp53wt and RKOp53KO cells by Western blot. β-actin served as loading control. (B) Subcellular localization of γH2A.x (red) in the indicated cell models upon 24-h YK-4-279 exposure was determined by immunofluorescence staining. DAPI (blue) was used as DNA counterstain. Representative fluorescence photomicrographs are shown. The scale bar indicates 50 µm (overview) and 20 µm in the zoom-in inserts. (C) Quantification of the experiment under (B) was performed with whole-slide scanning technology (Pannoramic Digital Slide Scanner) and evaluation of at least eight regions of interest with Definiens Tissue Studio® Software. Percentage of γH2A.x-positive nuclei/mitoses upon YK-4-279 treatment in RKOp53wt as compared to RKOp53KO cells is given. Statistical analysis was conducted using unpaired Student’s t-test. (D) Induction of DNA double-strand breaks upon treatment with the indicated concentrations of YK-4-279 at the indicated time points was analyzed by Comet assay (SCGE). Data are given as mean ± SD tail intensity as published (see Material and Methods), derived from two independent experiments in triplicate. H2O2 (50 µM) served as internal positive control (not shown). Statistical analysis was performed using two-way ANOVA with Bonferroni post-test. p values less than 0.05 were considered significant, with * p < 0.05, ** p < 0.01, *** p < 0.001, **** p < 0.0001.
Figure 5
Figure 5
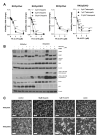
PARP inhibition protects against YK-4-279-induced cell death. (A) Effect of PARP inhibitors (olaparib, left panels; talazoparib, right panels) in combination with YK-4-279 for 72 h on viability of RKO subclones was determined by MTT-based cell viability assay. Results are given normalized to untreated controls as means ± SD of one representative out of three experiments performed in triplicate. Statistical analysis was conducted using two-way ANOVA with Bonferroni post-test. (B) Changes in PARylation of PARP1 upon 24-h YK-4-279 exposure (+, 1 µM) without or with olaparib (+, 5 µM; ++, 50 µM) are opposed to the levels of total PARP1, cleaved PARP1, BAX, γH2A.x, ETS1, and p53 by Western blot in the indicated cell models. β-actin was used as loading control. (C) Representative photomicrographs of RKOp53wt and RKOp53KO cells treated with the indicated drug concentrations and their combinations (combi) for 24 h. Cells were harvested and used for Western blot analysis under (B). The scale bar indicates 200 µm. Concerning all statistical analyses, p values less than 0.05 were considered significant, with ** p < 0.01, *** p < 0.001, **** p < 0.0001.
Figure 6
Figure 6
YK-4-279 induces parthanatos-like cell death. (A) Impact of YK-4-279 as indicated in absence or presence of talazoparib for 24 h on the mitochondrial membrane potential of RKOp53wt and RKOp53KO cells were analyzed with JC-1 staining followed by flow cytometry. Data are given as means ± standard error of mean (SEM) of three independent experiments. One-way ANOVA with Bonferroni post-test was performed to test for statistical significances. p values < 0.05 were considered significant, with ** p < 0.01. ns, not significant. (B) Changes in the amounts and subcellular localization of apoptosis-inducible factor (AIF), p-ETS1, ETS1, PARP1 and p53 were analyzed in nuclear (N) and cytoplasmic (C) fractions of RKOp53wt and RKOp53KO cells after exposure to YK-4-279 (+, 0.5 µM; ++, 1 µM) without or with talazoparib (+, 2.5 µM) for 24 h. Lamin A/C and GAPDH were used as purity control for nuclear extracts and cytoplasmic fractions, respectively. Densitometric quantification of nuclear versus cytoplasmic fractions of AIF is given as ratio of AIF (N/C) insets.

References

    1. Sizemore G.M., Pitarresi J.R., Balakrishnan S., Ostrowski M.C. The ETS family of oncogenic transcription factors in solid tumours. Nat. Rev. Cancer. 2017;17:337–351. doi: 10.1038/nrc.2017.20. - DOI - PubMed
    1. Hollenhorst P.C., Ferris M.W., Hull M.A., Chae H., Kim S., Graves B.J. Oncogenic ETS proteins mimic activated RAS/MAPK signaling in prostate cells. Genes Dev. 2011;25:2147–2157. doi: 10.1101/gad.17546311. - DOI - PMC - PubMed
    1. Hollenhorst P.C., McIntosh L.P., Graves B.J. Genomic and biochemical insights into the specificity of ETS transcription factors. Annu. Rev. Biochem. 2011;80:437–471. doi: 10.1146/annurev.biochem.79.081507.103945. - DOI - PMC - PubMed
    1. Wu X., Sukumar S. ETS genes in breast cancer: A step in the right direction. Cancer Biol. Ther. 2007;6:83–84. doi: 10.4161/cbt.6.1.3825. - DOI - PubMed
    1. Birner P., Berghoff A.S., Dinhof C., Pirker C., Capper D., Schoppmann S.F., Petzelbauer P., von Deimling A., Berger W., Preusser M. MAP kinase activity supported by BRAF V600E mutation rather than gene amplification is associated with ETV1 expression in melanoma brain metastases. Arch. Dermatol. Res. 2014;306:873–884. doi: 10.1007/s00403-014-1490-6. - DOI - PubMed