. 2020 Oct 30;9(11):909.
doi: 10.3390/pathogens9110909.

Bovine Leukemia Virus Infection Affects Host Gene Expression Associated with DNA Mismatch Repair

Affiliations

Bovine Leukemia Virus Infection Affects Host Gene Expression Associated with DNA Mismatch Repair

Lanlan Bai et al. Pathogens. .

Abstract

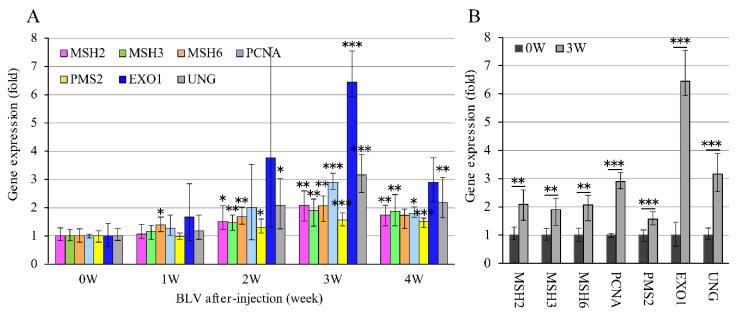
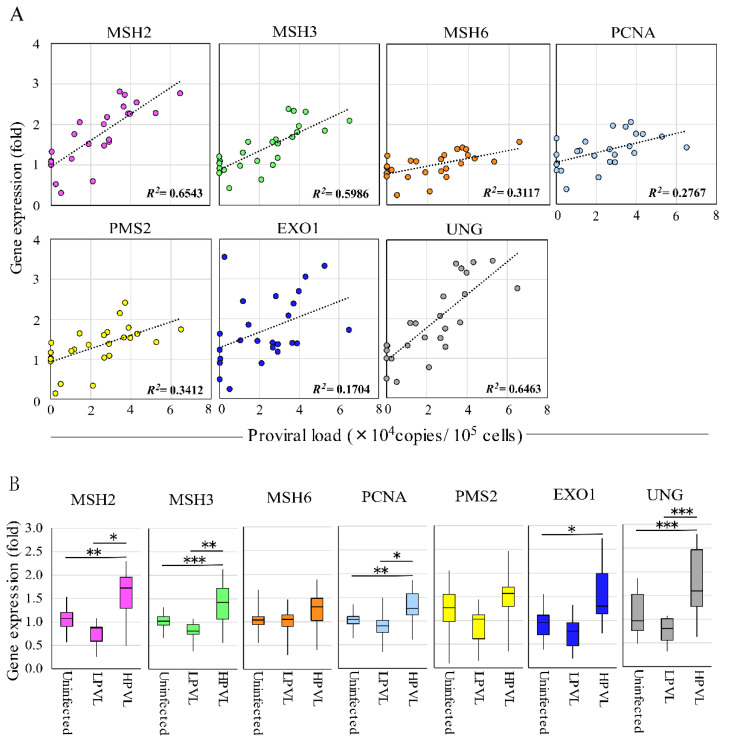
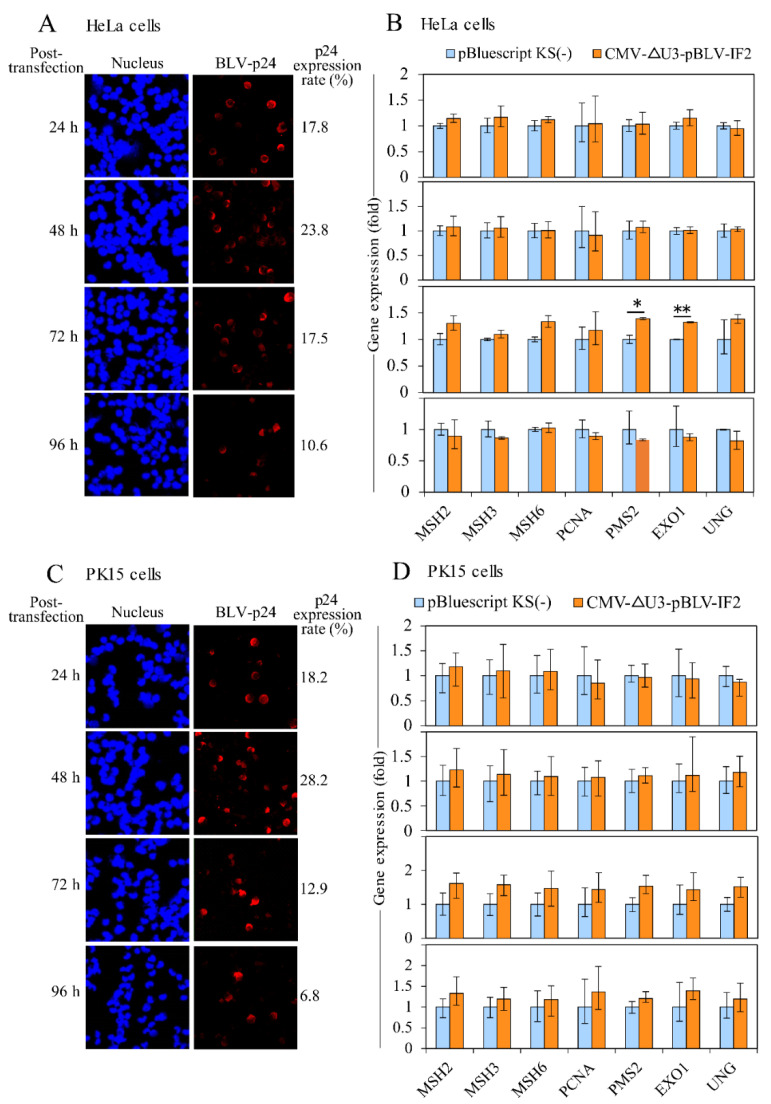
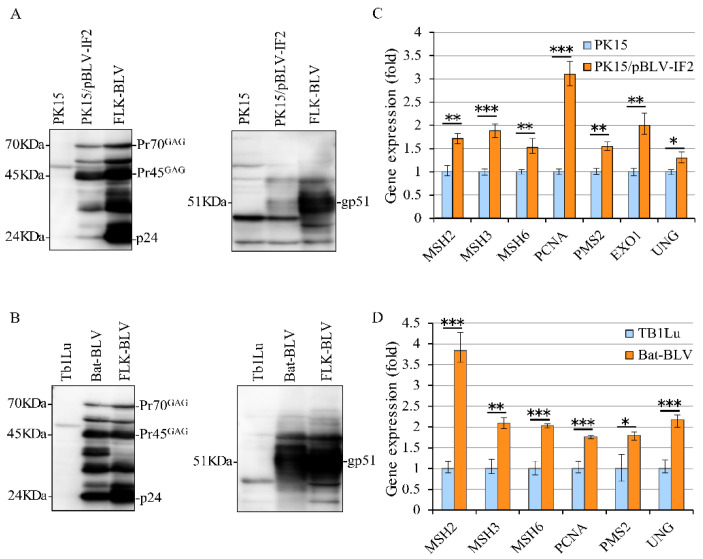
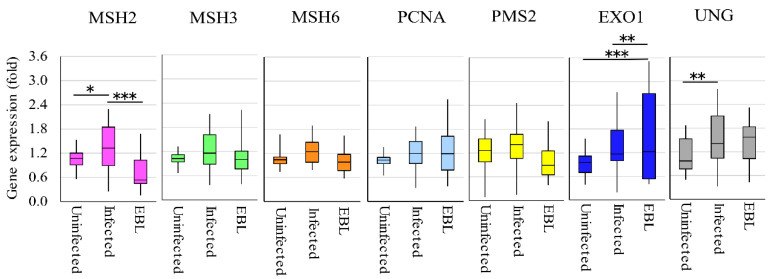
Bovine leukemia virus (BLV) causes enzootic bovine leukosis, a malignant form of B-cell lymphoma, and is closely related to human T-cell leukemia viruses. We investigated whether BLV infection affects host genes associated with DNA mismatch repair (MMR). Next-generation sequencing of blood samples from five calves experimentally infected with BLV revealed the highest expression levels of seven MMR genes (EXO1, UNG, PCNA, MSH2, MSH3, MSH6, and PMS2) at the point of peak proviral loads (PVLs). Furthermore, MMR gene expression was only upregulated in cattle with higher PVLs. In particular, the expression levels of MSH2, MSH3, and UNG positively correlated with PVL in vivo. The expression levels of all seven MMR genes in pig kidney-15 cells and the levels of PMS2 and EXO1 in HeLa cells also increased tendencies after transient transfection with a BLV infectious clone. Moreover, MMR gene expression levels were significantly higher in BLV-expressing cell lines compared with those in the respective parental cell lines. Expression levels of MSH2 and EXO1 in BLV-infected cattle with lymphoma were significantly lower and higher, respectively, compared with those in infected cattle in vivo. These results reveal that BLV infection affects MMR gene expression, offering new candidate markers for lymphoma diagnosis.

Keywords: DNA mismatch repair; bovine leukemia virus; gene expression; lymphoma stage; proviral load; viral protein expression.


Conflict of interest statement

The authors declare no conflict of interest.

Figures

Figure 1
Figure 1
The top ten up regulated biological functions due to BLV infection. Gene Ontology (GO) analysis was performed using the gene expression analysis free site PANTHER in the list of 906 genes that had up regulated due to BLV infection. Among the biological functions obtained by the analysis, the top ten functions with the highest significance are shown.
Figure 2
Figure 2
Comparison of expression levels at RNA level of 7 MMR genes in five calves before and after experimental BLV infection. (A) MMR gene expression at each time point in five BLV experimentally infected calves. Five BLV-negative calves carrying susceptible alleles BoLA-DRB3*1601/*1601 were experimentally challenged intravenously with BLV. RNAs were extracted from these calves at five time points in BLV post-infection (before BLV infection: 0 week; after BLV infection: 1–4 weeks), and then synthesized into cDNAs. The expression level of each MMR gene was measured by qRT-PCR. The expression level of MMR genes in each week was calculated by the expression of each gene before BLV infection (week 0), which was set as 1. GAPDH gene was used as an endogenous control for each gene expression analysis using the comparative CT (∆∆CT) method. The vertical axis shows the expression level of each MMR gene, and the horizontal axis shows post-infection period. Simultaneously, BLV proviral loads were monitored at each time point by BLV-CoCoMo-qPCR-2 using genomic DNA that were extracted from the blood of five infected-calves at same points. (B) Of (A), only 0 week and 3 weeks at which expression mostly increased were shown. Expression was significantly increased in all MMR genes when compared within 0 week. GAPDH gene was used as an endogenous control for each gene expression analysis using the comparative CT (∆∆CT) method. Error bars represent the standard deviation of three experiments. The p value was calculated by Student’s t-test. Asterisks indicate a significant difference (* p < 0.05, ** p < 0.01 and *** p < 0.001).
Figure 3
Figure 3
Correlation of expression of 7 MMR genes and proviral load in BLV-infected cattle in vivo. (A) The correlation between each MMR gene expression and proviral load (PVL). RNAs were extracted from 25 BLV-infected cattle to analyze MMR gene expression, and the fold-change in MMR gene expression was calculated using the ΔΔCT method with normalization to GAPDH expression as an internal control. Spearman r was used to evaluate the strength of the correlation. (B) MMR gene expression in BLV-infected cattle with HPVL and LPVL. Cattle were divided into three groups: 20 BLV-negative cattle (proviral load = 0), 6 BLV-infected cattle with low-proviral loads (LPVL group = PVL < 10,000 copies/105 cells), and 19 BLV-infected cattle with high-proviral loads (HPVL group = PVL ≥ 10,000 copies/105 cells), and were measured for RNA expression levels of 7 MMR genes by qRT-PCR, and the fold-change was calculated. Samples were run in duplicate. The vertical axis indicates the relative expression of each MMR gene when the expression level of each gene in uninfected cattle was set to 1. The upper bar indicates maximum and lower bar shows the minimum values. The black line at the center of the graph indicates the median value. The p value was calculated by Tukey’s test after the analysis of variance. Asterisks indicate a significant difference (* p < 0.05, ** p < 0.01 and *** p < 0.001).
Figure 4
Figure 4
The expression of BLV and each MMR gene at transient levels in HeLa and PK15 cells with CMV-∆U3-pBLV-IF2. (A) The p24 expression in HeLa cells transfected with CMV-∆U3-pBLV-IF2. (B) The expression of each MMR gene in HeLa cells transfected CMV-∆U3-pBLV-IF2. (C) The p24 expression in PK15 cells transfected with CMV-∆U3-pBLV-IF2. (D) The expression of each MMR gene in PK15 cells transfected CMV-∆U3-pBLV-IF2. HeLa and PK15 cells were transfected with CMV-∆U3-pBLV-IF2 for 24, 48, 72, and 96 h; the expression rates of p24 were evaluated by a confocal laser microscope. The p24 expression rates were calculated by dividing the number of p24 expressing cells by the number of cells. The expressions of MMR gene were measured using qRT-PCR assay. Quantification was carried out using the ∆∆CT method with GAPDH as the endogenous control. The vertical axis indicates the relative expression of each MMR gene when the expression level of each gene in cells transfected with pBluscript KS(−) was set to 1. The MMR gene expressions were observed to be higher in transfected cells with CMV-∆U3-pBLV-IF comparing with those in transfected cells with pBluscript KS(−) at 72 h. Error bars represent the standard deviation of three experiments. The p value was calculated by Student’s t-test. Significant differences are indicated by asterisks (* p < 0.05, and ** p < 0.01).
Figure 5
Figure 5
Comparison of MMR expression levels in PK15/pBLV-IF2 and Bat-BLV cells. (A) BLV expression in the parental PK15 and PK15/pBLV-IF2 cells, and (B) parental Tb1Lu and Bat-BLV. After 48 h cultured, PK15/pBLV-IF2 and parental PK15 cells, and Bat-BLV and parental Tb1Lu cells were harvested, lysis, and then used to detect viral proteins expression with anti-gp51 antibody and anti-p24 antibody by Western blot. Positions of BLV p24, Pr45GAG, Pr70GAG and gp51 proteins, and molecular masses are indicated. (C) MMR gene expressions in PK15 and PK15/pBLV-IF2 cells, and (D) Tb1Lu and Bat-BLV. The cDNAs were synthesized to evaluate the expression level of the MMR gene using qRT-PCR. EXO1 was not identified in bat cells. The vertical axis represents the relative expression level when the expression level of each gene in parental cells was set to 1. Error bars represent the standard deviation of three experiments. The p value was calculated by Student’s t-test. Significant differences are indicated by asterisks (* p < 0.05, ** p < 0.01, and *** p < 0.001).
Figure 6
Figure 6
The expression levels of MMR genes in different cattle groups. DNAs were extracted from bloods of cattle containing 20 uninfected cattle, 25 BLV-infected without onset, and 20 EBL with lymphoma to measure the expression of MMR gene using qRT-PCR. The vertical axis indicates the relative expression of each MMR gene when the expression level of each gene in uninfected cattle was set to 1. The upper bar indicates maximum and lower bar shows the minimum values. The black line at the center of the graph indicates the median value. The p value was calculated by Tukey’s test after the analysis of variance. Significant differences are indicated by asterisks (* p < 0.05, ** p < 0.01 and *** p < 0.001).

Similar articles

Cited by

References

    1. Lindahl T., Barnes D.E. Repair of endogenous DNA damage. Cold Spring Harb. Symp. Quant. Biol. 2000;65:127–133. doi: 10.1101/sqb.2000.65.127. - DOI - PubMed
    1. Jackson S.P., Bartek J. The DNA-damage response in human biology and disease. Nature. 2009;461:1071–1078. doi: 10.1038/nature08467. - DOI - PMC - PubMed
    1. Jiricny J. The multifaceted mismatch-repair system. Nat. Rev. Mol. Cell Biol. 2006;7:335–346. doi: 10.1038/nrm1907. - DOI - PubMed
    1. Li Z., Pearlman A.H., Hsieh P. DNA mismatch repair and the DNA damage response. DNA Repair. 2016;38:94–101. doi: 10.1016/j.dnarep.2015.11.019. - DOI - PMC - PubMed
    1. Bartlett P.C., Sordillo L.M., Byrem T.M., Norby B., Grooms D.L., Swenson C.L., Zalucha J., Erskine R.J. Options for the control of bovine leukemia virus in dairy cattle. J. Am. Vet. Med. Assoc. 2014;244:914–922. doi: 10.2460/javma.244.8.914. - DOI - PubMed

LinkOut - more resources