. 2021 Oct;17(10):2766-2782.
doi: 10.1080/15548627.2020.1839286. Epub 2020 Nov 4.

Autophagy receptor OPTN (optineurin) regulates mesenchymal stem cell fate and bone-fat balance during aging by clearing FABP3

Affiliations

Autophagy receptor OPTN (optineurin) regulates mesenchymal stem cell fate and bone-fat balance during aging by clearing FABP3

Zheng-Zhao Liu et al. Autophagy. 2021 Oct.

Abstract

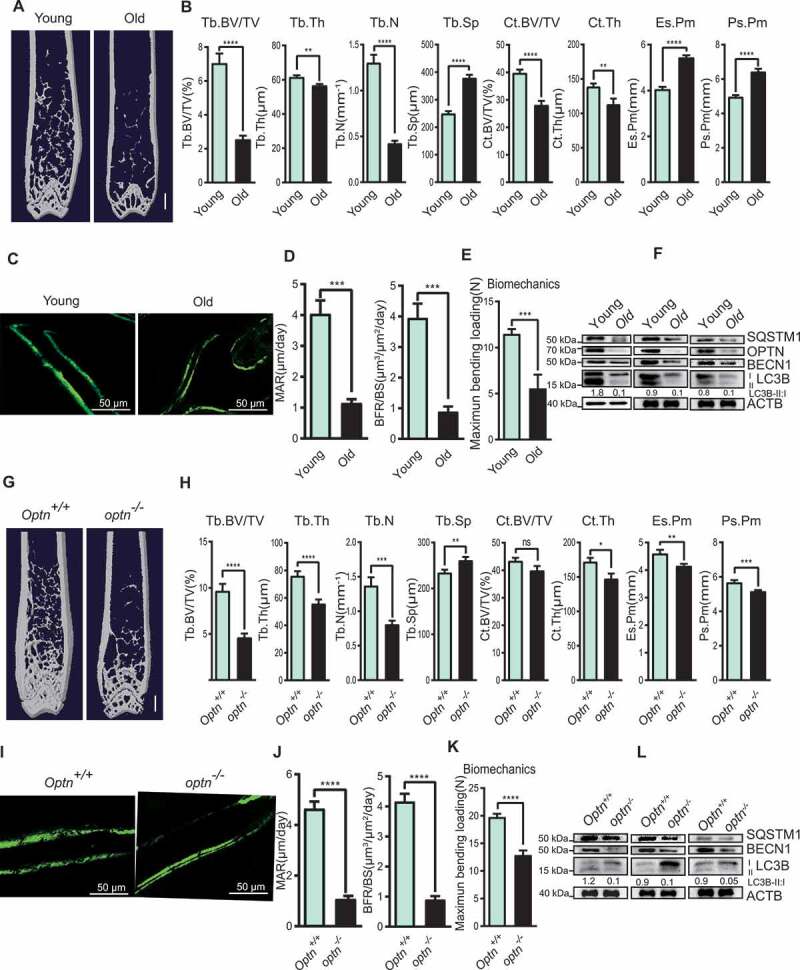
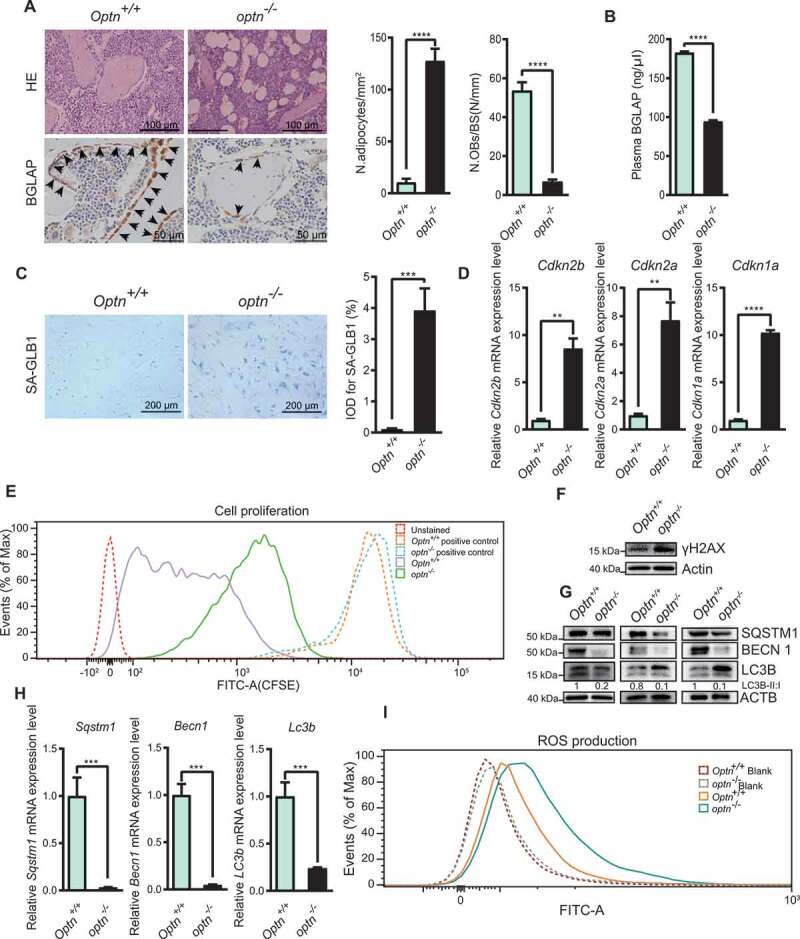
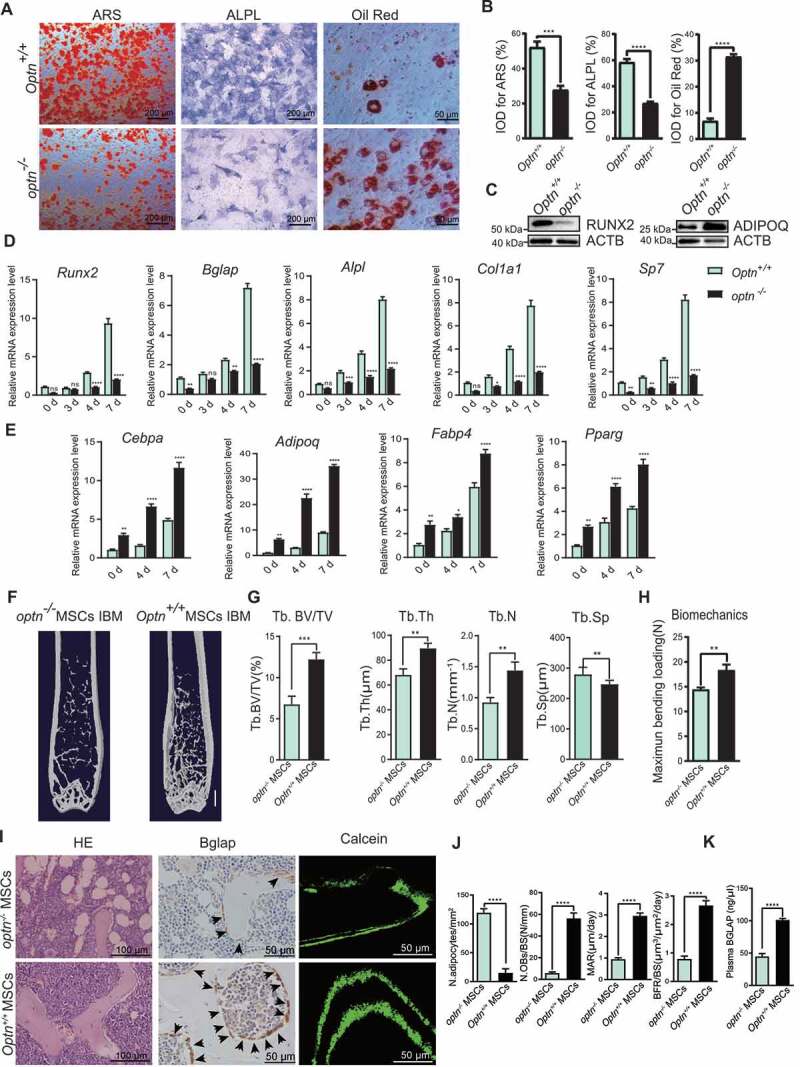
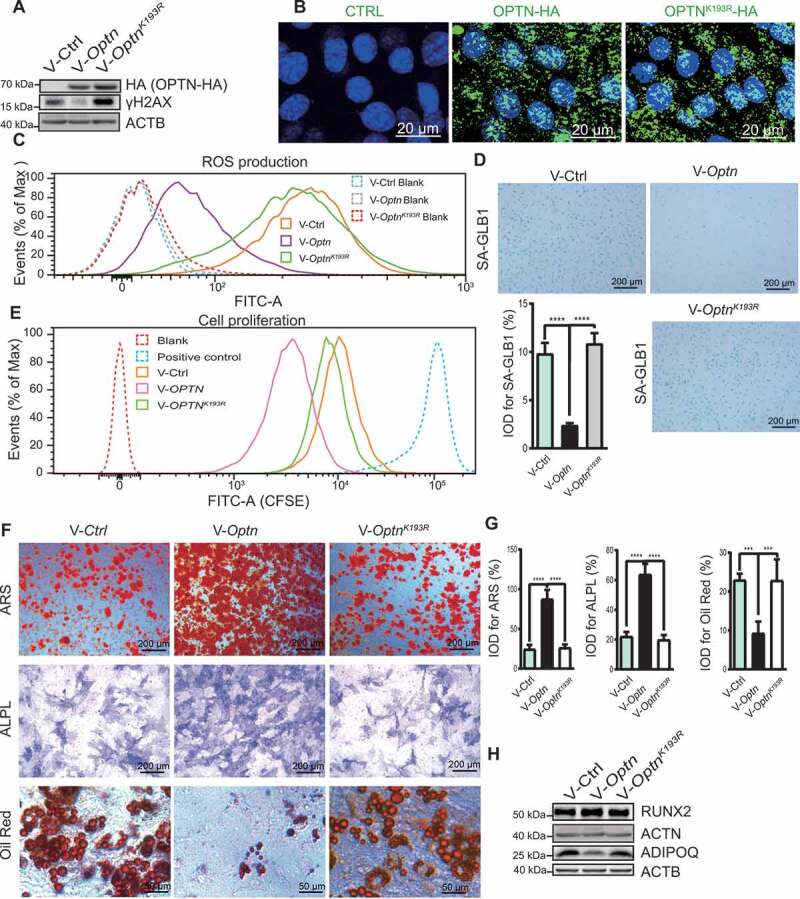
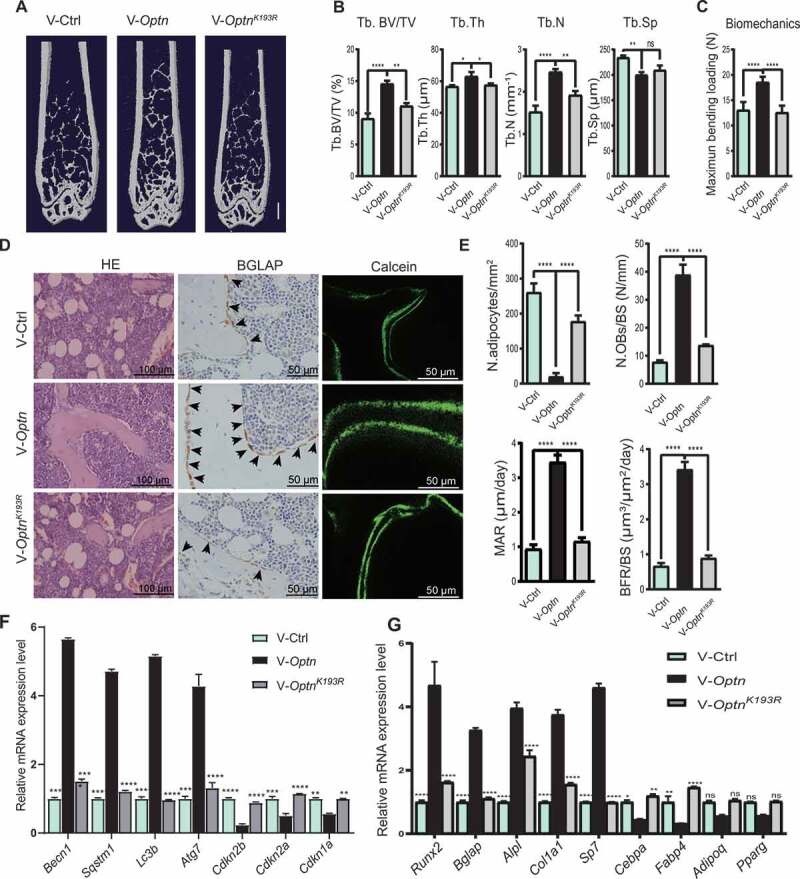
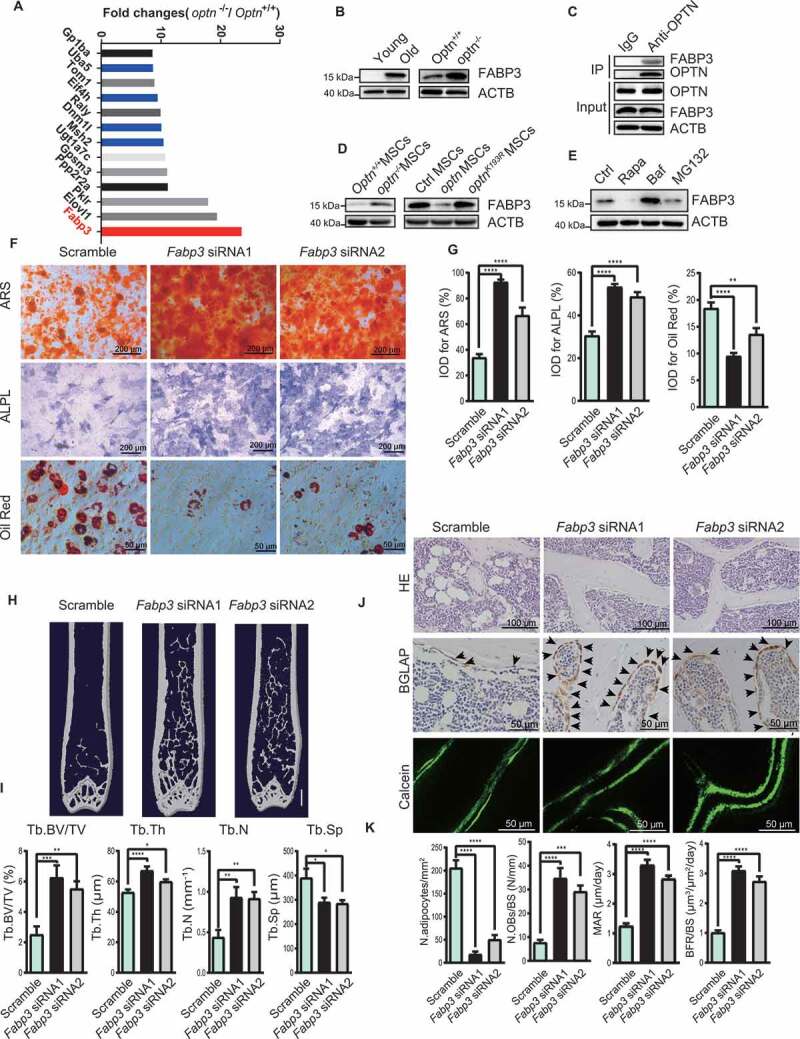
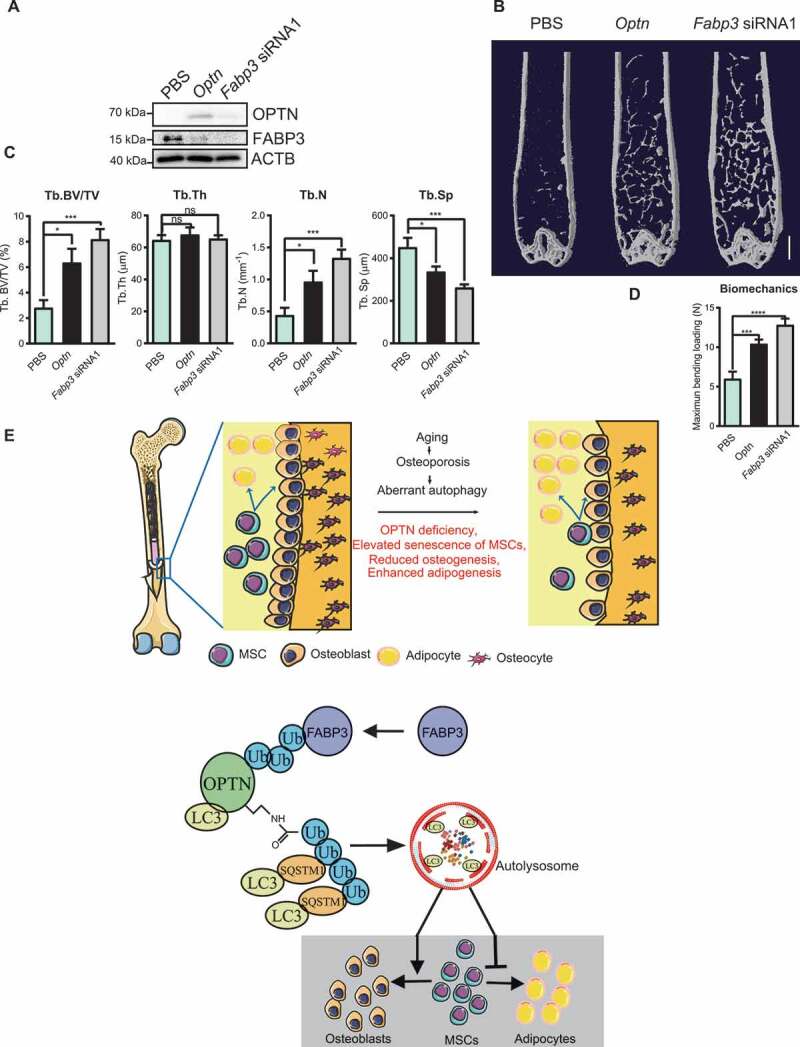
Senile osteoporosis (OP) is often concomitant with decreased autophagic activity. OPTN (optineurin), a macroautophagy/autophagy (hereinafter referred to as autophagy) receptor, is found to play a pivotal role in selective autophagy, coupling autophagy with bone metabolism. However, its role in osteogenesis is still mysterious. Herein, we identified Optn as a critical molecule of cell fate decision for bone marrow mesenchymal stem cells (MSCs), whose expression decreased in aged mice. Aged mice revealed osteoporotic bone loss, elevated senescence of MSCs, decreased osteogenesis, and enhanced adipogenesis, as well as optn-/ - mice. Importantly, restoring Optn by transplanting wild-type MSCs to optn-/ - mice or infecting optn-/ - mice with Optn-containing lentivirus rescued bone loss. The introduction of a loss-of-function mutant of OptnK193R failed to reestablish a bone-fat balance. We further identified FABP3 (fatty acid binding protein 3, muscle and heart) as a novel selective autophagy substrate of OPTN. FABP3 promoted adipogenesis and inhibited osteogenesis of MSCs. Knockdown of FABP3 alleviated bone loss in optn-/ - mice and aged mice. Our study revealed that reduced OPTN expression during aging might lead to OP due to a lack of FABP3 degradation via selective autophagy. FABP3 accumulation impaired osteogenesis of MSCs, leading to the occurrence of OP. Thus, reactivating OPTN or inhibiting FABP3 would open a new avenue to treat senile OP.Abbreviations: ADIPOQ: adiponectin, C1Q and collagen domain containing; ALPL: alkaline phosphatase, liver/bone/kidney; BGLAP/OC/osteocalcin: bone gamma carboxyglutamate protein; BFR/BS: bone formation rate/bone surface; CALCOCO2/NDP52: calcium binding and coiled-coil domain 2; CDKN1A/p21: cyclin-dependent kinase inhibitor 1A; CDKN2A/p16: cyclin dependent kinase inhibitor 2A; CDKN2B/p15: cyclin dependent kinase inhibitor 2B; CEBPA: CCAAT/enhancer binding protein (C/EBP), alpha; COL1A1: collagen, type I, alpha 1; Ct. BV/TV: cortical bone volume fraction; Ct. Th: cortical thickness; Es. Pm: endocortical perimeter; FABP4/Ap2: fatty acid binding protein 4, adipocyte; H2AX: H2A.X variant histone; HE: hematoxylin and eosin; MAP1LC3B: microtubule-associated protein 1 light chain 3 beta; MAR: mineral apposition rate; MSCs: bone marrow mesenchymal stem cells; NBR1: NBR1, autophagy cargo receptor; OP: osteoporosis; OPTN: optineurin; PDB: Paget disease of bone; PPARG: peroxisome proliferator activated receptor gamma; Ps. Pm: periosteal perimeter; qRT-PCR: quantitative real-time PCR; γH2AX: Phosphorylation of the Serine residue of H2AX; ROS: reactive oxygen species; RUNX2: runt related transcription factor 2; SA-GLB1: senescence-associated (SA)-GLB1 (galactosidase, beta 1); SP7/Osx/Osterix: Sp7 transcription factor 7; SQSTM1/p62: sequestosome 1; TAX1BP1: Tax1 (human T cell leukemia virus type I) binding protein 1; Tb. BV/TV: trabecular bone volume fraction; Tb. N: trabecular number; Tb. Sp: trabecular separation; Tb. Th: trabecular thickness; μCT: micro computed tomography.

Keywords: Adipogenesis; autophagy; bone metabolism; fabp3; mesenchymal stem cell; optineurin; osteogenesis; osteoporosis; senescence.


Conflict of interest statement

No potential competing interest was reported by the authors.

Figures

Figure 1.
Figure 1.
Optn-deficient mice exhibit elevated bone loss and impaired autophagy similar to the aged mice. (A-B) Representative μCT images (A) and quantitative μCT analysis of bone mass and microarchitecture (B) in femora from young (2-month) and old (16-month) mice. Scale bar: 1 mm. n ≥ 5 per group. Tb. BV/TV, trabecular bone volume fraction; Tb. Th, trabecular thickness; Tb. N, trabecular number; Tb. Sp, trabecular separation; Ct.BV/TV, cortical bone volume fraction; Ct. Th, cortical thickness; Es. Pm, endocortical perimeter; Ps. Pm, periosteal perimeter. (C-D) Representative images of calcein double labeling of trabecular bone of young and old mice (C) with quantification of MAR and BFR (D). Scale bar: 50 μm. n= 5 per group. MAR, mineral apposition rate; BFR, bone formation rate. (E) Quantification of biomechanics of femora from young and old mice. n≥ 5 per group. (F) Western blot analysis of SQSTM1, OPTN, BECN1, LC3B in femora from 3 pairs of young and old mice. ACTB was used as a loading control. (G-H) Representative μCT images (G) and quantitative μCT analysis of bone mass and microarchitecture (H) in femora from 4-month-old Optn+/+ and optn–/ – mice. Scale bar: 1 mm. n≥ 14 per group. (I-J) Representative images of calcein double labeling of trabecular bone of Optn+/+ and optn/ mice (I) with quantification of MAR and BFR (J). Scale bar: 50 μm. n= 5 per group. (K) Quantification of biomechanics of femora from Optn+/+ and optn/ mice. n≥ 14 per group. (L) Western blot of SQSTM1, BECN1, LC3B in femora from 3 pairs of Optn+/+ and optn–/–mice. All data are presented as mean ± sd. **P< 0.05, **P< 0.01, *** P< 0.001, **** P< 0.0001 by Student’s t test
Figure 2.
Figure 2.
Optn deficiency exacerbated bone-fat imbalance and enhanced senescence of MSCs. (A) Representative HE and BGLAP staining and quantification of adipocyte number per tissue area (N. adipocytes/mm2) and osteoblast number per bone surface (N. OBs/BS) in femora from Optn+/+ and optn/ mice. Scale bars: 100 μm (top), 50 μm (bottom). n= 5 per group. (B) ELISA of serum BGLAP in Optn+/+ and optn–/ – mice. n= 3 per group. (C) Representative SA-GLB1 staining of MSCs from Optn+/+ and optn/ mice and integrated optical density (IOD) quantification. Scale bar: 200 μm. n= 5 per group. (D) The expression level of Cdkn2b, Cdkn2a, and Cdkn1a in MSCs from Optn+/+ and optn/ mice, as determined by qRT-PCR. n= 3 per group. (E) Flow cytometry analysis of the proliferation of MSCs from Optn+/+ and optn/ mice, as assessed MSCs with CFSE labeling after 2 d of culturing. Unstained MSCs were used as a negative control, MSCs with CFSE labeling before flow cytometry were used as a positive control. (F-G) Western blot of γH2AX (F), SQSTM1, BECN1, LC3B (G) in MSCs from Optn+/+ and optn/ mice. (H) The expression level of Lc3b, Becn1, and Sqstm1 in MSCs from Optn+/+ and optn/ mice, as determined by qRT-PCR. n= 3 per group. (I) Flow cytometry analyzed reactive oxygen species (ROS) of MSCs from Optn+/+ and optn/ mice, as assessed after staining with ROS Detection Solution. Unstained MSCs were used as a negative control. All data are presented as mean ± sd. **P< 0.05, **P< 0.01, *** P< 0.001, **** P< 0.0001 by Student’s t test
Figure 3.
Figure 3.
Optn controls osteogenic and adipogenic differentiation of MSCs. (A-B) Representative images of alizarin red S staining (left), ALPL staining (middle), and oil red O staining (right) of MSCs from Optn+/+ and optn/ mice under osteogenic and adipogenic differentiation respectively (A), and quantification of IOD (B). Scale bars: 200 μm (left, middle), 50 μm (right). n= 5 per group. IOD, integrated optical density. (C) Western blot detection of RUNX2 and ADIPOQ in Optn+/+ and optn/ MSCs under osteogenic and adipogenic differentiation, respectively. ACTB was used as a loading control. (D-E) mRNA expression levels of osteogenesis-related genes (Runx2, Bglap, Alpl, Col1a1, Sp7) under osteogenic induction for 0, 3, 4, and 7 d (D) and adipogenesis-related genes (Cebpa, Adipoq, Fabp4, Pparg) under adipogenic induction for 0, 4, and 7 d (E) in Optn+/+ and optn/ MSCs as determined by qRT-PCR. n= 3 per group. (F-H) Representative μCT images (F), quantitative μCT analysis of bone mass and microarchitecture (G), and quantification of biomechanics (H) in femora from optn–/ – mice transplanted with optn/ or Optn+/+ MSCs in the bone marrow cavity (IBM). Scale bar: 1 mm. n= 8 per group. (I-J) The representative of HE staining (left), BGLAP staining (middle), and calcein double labeling (right) in femora from optn/ mice transplanted with optn/ or Optn+/+ MSCs (IBM) (I), and quantification of N.adipocytes/mm2, N.OBs/BS, MAR and BFR (J). Scale bars: 100 μm (left), 50 μm (middle, right) 50 μm. n= 8 per group. (K) ELISA of serum BGLAP in optn–/ – mice transplanted with optn/ or Optn+/+ MSCs (IBM). n= 3 per group. All data are presented as mean ± sd. **P< 0.05, **P< 0.01, *** P< 0.001, **** P< 0.0001 by Student’s t test
Figure 4.
Figure 4.
Induction of Optn but not OptnK193R restored osteogenic differentiation of optn–/ – MSCs. (A) Western blot of HA-tagged OPTN and γH2AX in optn/ MSCs infected with lentivirus Ctrl vector, or lentivirus carrying Optn or OptnK193R. ACTB was used as a loading control. (B) Representative immunofluorescence images show the localization of OPTN the OPTNK193R in MSCs with anti-HA antibody. Scale bar: 20 μm. n= 5 per group. (C) Flow cytometry analyzed ROS in optn/ MSCs infected with lentivirus Ctrl vector, or lentivirus carrying Optn or OptnK193R, as assessed after staining with ROS Detection Solution. Unstained MSCs were used as a negative control. (D) Representative of SA-GLB1 staining in optn/ MSCs infected with lentivirus Ctrl vector, or lentivirus carrying Optn or OptnK193R, and quantification of IOD. Scale bar: 200 μm. n= 5 per group. (E) Flow cytometry analyzed cell proliferation in optn/ MSCs infected with lentivirus Ctrl vector, or lentivirus carrying Optn or OptnK193R, as assessed MSCs with CFSE labeling after 2 d culturing. Unstained MSCs were used as a negative control, MSCs with CFSE labeling before flow cytometry were used as positive control. (F-H) Representative images of alizarin red S staining (top), ALPL staining (middle), oil red O staining (bottom) (F), quantification of IOD (G), western blot of RUNX2 and ADIPOQ (H) in optn/ MSCs overexpressing Ctrl vector, Optn, or OptnK193R under osteogenic and adipogenic differentiation respectively. Scale bars: 200 μm (top, middle), 50 μm (bottom). n= 5 per group. All data are presented as mean ± sd. **P< 0.05, **P< 0.01, *** P< 0.001, **** P< 0.0001 by one-way ANOVA with Dunettee’s post hoc test
Figure 5.
Figure 5.
Induction of Optn but not OptnK193R mitigated bone loss in optn–/ – mice. (A-C) Representative μCT images (A), quantitative μCT analysis of bone mass and microarchitecture (B), and quantification of biomechanics (C) in femora from optn–/–mice infected with lentivirus Ctrl vector, or lentivirus carrying Optn or OptnK193R, (IV). Scale bar: 1 mm. n= 5 per group. (D-E) The representative of HE staining (left), BGLAP staining (middle), and calcein double labeling (right) and quantification of N.adipocytes/mm2, N.OBs/BS, MAR and BFR in femora of optn–/–mice infected with lentivirus Ctrl vector, or lentivirus carrying Optn or OptnK193R, (IV). Scale bars: 100 μm (left), 50 μm (middle, right). n= 5 per group. (F-G) mRNA expression levels of senescence-related genes (Cdkn2b, Cdkn2a, Cdkn1a), autophagy-related genes (Becn1, Sqstm1, Lc3b, Atg7) (F), osteogenesis-related genes (Runx2, Bglap, Alpl, Col1a1, Sp7) and adipogenesis-related genes (Cebpa, Adipoq, Fabp4, Pparg) (G) in femora of optn/ mice infected with lentivirus Ctrl vector, or lentivirus carrying Optn or OptnK193R, as determined by qRT-PCR. n= 3 per group. All data are presented as mean ± sd. **P< 0.05, **P< 0.01, *** P< 0.001, **** P< 0.0001 by one-way ANOVA with Dunettee’s post hoc test
Figure 6.
Figure 6.
FABP3 is a downstream regulator of OPTN. (A) Mass spectrum showing FABP3 accumulated in bone tissue of optn/ mice. (B) Western blot of FABP3 expression in femora of each group. (C) Co-Immunoprecipitation showing FABP3 interacted with OPTN in mice bone tissue. (D) Western blot of FABP3 in MSCs isolated from femora of each group. (E) Western blot of FABP3 in MSCs treated with indicated compounds. (F-G) Representative images of alizarin red S staining (top), ALPL staining (middle), and oil red O staining (bottom) (F) and quantification of IOD (G) in optn/ MSCs overexpressing Scramble siRNA, Fabp3 siRNA1, or Fabp3 siRNA2 under osteogenic and adipogenic differentiation respectively. Scale bars: 200 μm (top, middle), 50 μm (bottom). n= 5 per group. (H-I) Representative μCT images (H), and quantitative μCT analysis of bone mass and microarchitecture (I) in femora of optn/ mice infected with lentivirus carrying Scramble siRNA, Fabp3 siRNA1, or Fabp3 siRNA2. Scale bar: 1 mm. n= 9 per group. (J-K) The representative of HE staining (top), BGLAP staining (middle), and calcein double labeling (bottom) (J) and quantification of N. adipocytes/mm2, N.OBs/BS, MAR, and BFR (K) in femora of optn/mice infected with lentivirus carrying Scramble siRNA, Fabp3 siRNA1 or Fabp3 siRNA2. Scale bars: 100 μm (top), 50 μm (middle, bottom). n= 5 per group. All data are presented as mean ± sd. **P< 0.05, **P< 0.01, *** P< 0.001, **** P< 0.0001 by one-way ANOVA with Dunettee’s post hoc test
Figure 7.
Figure 7.
Optn mitigated osteoporosis through Fabp3. (A) Western blot of OPTN and FABP3 in femora of old mice infected with lentivirus carrying Optn or Fabp3 siRNA1 (IV). (B-D) Representative μCT images (B), quantitative μCT analysis of bone mass and microarchitecture (C), and quantification of the biomechanics (D) in femora of old mice infected with lentivirus carrying Optn or Fabp3 siRNA1 (IV). PBS injection was used as a control. Scale bar: 1 mm. n= 10 per group. (E) Model by which Optn regulates the aging of MSCs. All data are presented as mean ± sd. **P< 0.05, **P< 0.01, *** P< 0.001, **** P< 0.0001 by one-way ANOVA with Dunettee’s post hoc test

Similar articles

Cited by

References

    1. Hansen M, Rubinsztein DC, Walker DW.. Autophagy as a promoter of longevity: insights from model organisms. Nat Rev Mol Cell Biol. 2018. Sep;19(9):579–593. - PMC - PubMed
    1. Sacitharan PK. Ageing and osteoarthritis. Subcell Biochem. 2019;91:123–159. - PubMed
    1. Chen K, Yang YH, Jiang SD, et al. Decreased activity of osteocyte autophagy with aging may contribute to the bone loss in senile population. Histochem Cell Biol. 2014. Sep;142(3):285–295. - PubMed
    1. Ma Y, Qi M, An Y, et al. Autophagy controls mesenchymal stem cell properties and senescence during bone aging. Aging Cell. 2018. Feb;17(1):e12709. - PMC - PubMed
    1. Luo D, Ren H, Li T, et al. Rapamycin reduces severity of senile osteoporosis by activating osteocyte autophagy. Osteoporos Int. 2016. Mar;27(3):1093–1101. - PubMed

Publication types