

Homing behaviour by destructive crown-of-thorns starfish is triggered by local availability of coral prey
- PMID: 33143585
- PMCID: PMC7735281
- DOI: 10.1098/rspb.2020.1341
Homing behaviour by destructive crown-of-thorns starfish is triggered by local availability of coral prey
Abstract
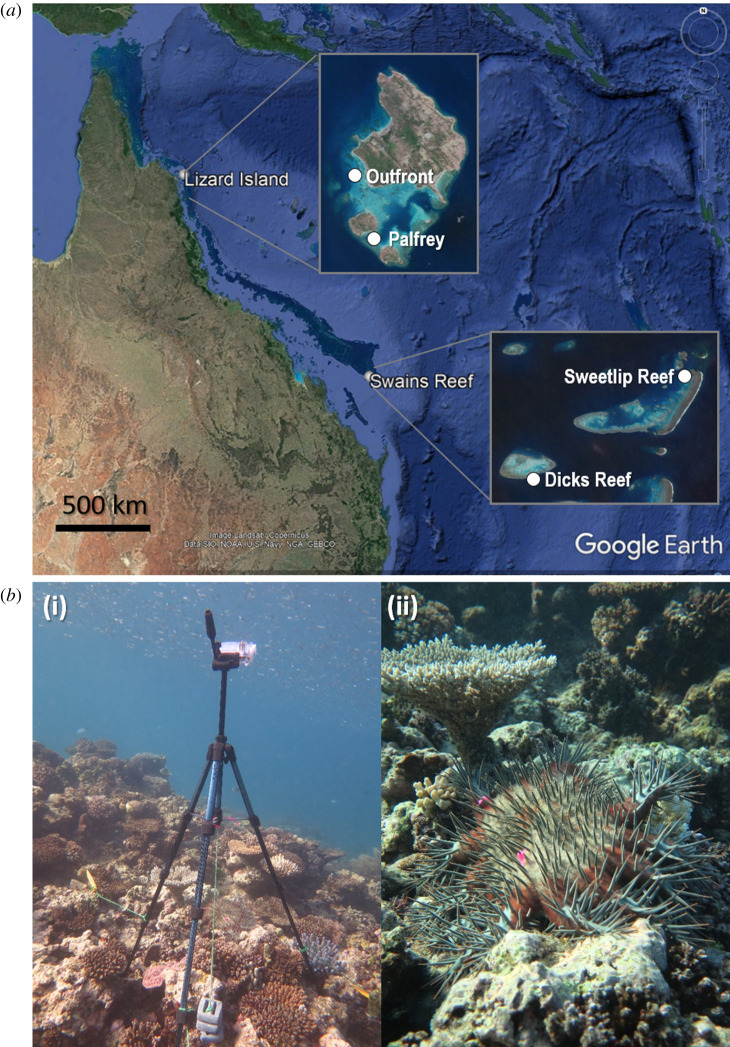
Corallivorous crown-of-thorns starfishes (Acanthaster spp.) can decimate coral assemblages on Indo-Pacific coral reefs during population outbreaks. While initial drivers of population irruptions leading to outbreaks remain largely unknown, subsequent dispersal of outbreaks appears coincident with depletion of coral prey. Here, we used in situ time-lapse photography to characterize movement of the Pacific crown-of-thorns starfish (Acanthaster cf. solaris) in the northern and southern Great Barrier Reef in 2015, during the fourth recorded population outbreak of the starfish, but prior to widespread coral bleaching. Daily tracking of 58 individuals over a total of 1117 h revealed all starfish to move a minimum of 0.52 m, with around half of all tracked starfish showing negligible daily displacement (less than 1 m day-1), ranging up to a maximum of 19 m day-1. Movement was primarily nocturnal and daily displacement varied spatially with variation in local availability of Acropora spp., which is the preferred coral prey. Two distinct behavioural modes emerged: (i) homing movement, whereby tracked paths (as tested against a random-walk-model) involved short displacement distances following distinct 'outward' movement to Acropora prey (typically displaying 'feeding scars') and 'homebound' movement to nearby shelter; versus (ii) roaming movement, whereby individuals showed directional movement beyond initial tracking positions without return. Logistic modelling revealed more than half of all tracked starfish demonstrated homing when local abundance (percentage cover) of preferred Acropora coral prey was greater than 33%. Our results reveal facultative homing by Acanthaster with the prey-dependent behavioural switch to roaming forays providing a mechanism explaining localized aggregations and diffusion of these population irruptions as prey is locally depleted.
Keywords: behaviour; coral reefs; movement; predation; random-walk-model; time-lapse photography.
Conflict of interest statement
We declare we have no competing interests.
Figures


Similar articles
-
Crown-of-thorns seastar (Acanthaster spp.) feeding ecology across species and regions.Sci Total Environ. 2024 Jun 20;930:172691. doi: 10.1016/j.scitotenv.2024.172691. Epub 2024 Apr 23. Sci Total Environ. 2024. PMID: 38663591 Review.
-
Predator crown-of-thorns starfish (Acanthaster planci) outbreak, mass mortality of corals, and cascading effects on reef fish and benthic communities.PLoS One. 2012;7(10):e47363. doi: 10.1371/journal.pone.0047363. Epub 2012 Oct 8. PLoS One. 2012. PMID: 23056635 Free PMC article.
-
Body size and substrate type modulate movement by the western Pacific crown-of-thorns starfish, Acanthaster solaris.PLoS One. 2017 Sep 6;12(9):e0180805. doi: 10.1371/journal.pone.0180805. eCollection 2017. PLoS One. 2017. PMID: 28877193 Free PMC article.
-
Biogeographical variation in diurnal behaviour of Acanthaster planci versus Acanthaster cf. solaris.PLoS One. 2020 Feb 20;15(2):e0228796. doi: 10.1371/journal.pone.0228796. eCollection 2020. PLoS One. 2020. PMID: 32078663 Free PMC article.
-
Dead foundation species create coral rubble habitat that benefits a resilient pest species.Mar Environ Res. 2024 Nov;202:106740. doi: 10.1016/j.marenvres.2024.106740. Epub 2024 Sep 5. Mar Environ Res. 2024. PMID: 39255629 Review.
Cited by
-
Daily Variation in the Feeding Activity of Pacific Crown-of-Thorns Starfish (Acanthaster cf. solaris).Biology (Basel). 2025 Aug 5;14(8):1001. doi: 10.3390/biology14081001. Biology (Basel). 2025. PMID: 40906229 Free PMC article.
-
Chemosensory behaviour of juvenile crown-of-thorns sea star (Acanthaster sp.), attraction to algal and coral food and avoidance of adult conspecifics.Proc Biol Sci. 2024 May;291(2023):20240623. doi: 10.1098/rspb.2024.0623. Epub 2024 May 29. Proc Biol Sci. 2024. PMID: 38807518 Free PMC article.
-
Culling corallivores improves short-term coral recovery under bleaching scenarios.Nat Commun. 2022 May 9;13(1):2520. doi: 10.1038/s41467-022-30213-x. Nat Commun. 2022. PMID: 35534497 Free PMC article.
-
Increasing densities of Pacific crown-of-thorns starfish (Acanthaster cf. solaris) at Lizard Island, northern Great Barrier Reef, resolved using a novel survey method.Sci Rep. 2023 Nov 7;13(1):19306. doi: 10.1038/s41598-023-46749-x. Sci Rep. 2023. PMID: 37935784 Free PMC article.
-
Settlement cue selectivity by larvae of the destructive crown-of-thorns starfish.Biol Lett. 2023 Jan;19(1):20220399. doi: 10.1098/rsbl.2022.0399. Epub 2023 Jan 25. Biol Lett. 2023. PMID: 36693424 Free PMC article.
References
-
- Schmitz OJ, Krivan V, Ovadia O. 2004. Trophic cascades: the primacy of trait-mediated indirect interactions. Ecol. Lett. 7, 153–163. (10.1111/j.1461-0248.2003.00560.x) - DOI
-
- Ling SD, et al. 2015. Global regime shift dynamics of catastrophic sea urchin grazing. Phil. Trans. R. Soc. B 370, 20130269 (10.1098/rstb.2013.0269) - DOI
Publication types
MeSH terms
LinkOut - more resources
Full Text Sources
Research Materials
Miscellaneous
