. 2020 Nov 4;18(1):346.
doi: 10.1186/s12916-020-01810-8.

At what times during infection is SARS-CoV-2 detectable and no longer detectable using RT-PCR-based tests? A systematic review of individual participant data

Affiliations

At what times during infection is SARS-CoV-2 detectable and no longer detectable using RT-PCR-based tests? A systematic review of individual participant data

Sue Mallett et al. BMC Med. .

Abstract

Background: Tests for severe acute respiratory syndrome coronavirus 2 (SARS-CoV-2) viral ribonucleic acid (RNA) using reverse transcription polymerase chain reaction (RT-PCR) are pivotal to detecting current coronavirus disease (COVID-19) and duration of detectable virus indicating potential for infectivity.

Methods: We conducted an individual participant data (IPD) systematic review of longitudinal studies of RT-PCR test results in symptomatic SARS-CoV-2. We searched PubMed, LitCOVID, medRxiv, and COVID-19 Living Evidence databases. We assessed risk of bias using a QUADAS-2 adaptation. Outcomes were the percentage of positive test results by time and the duration of detectable virus, by anatomical sampling sites.

Results: Of 5078 studies screened, we included 32 studies with 1023 SARS-CoV-2 infected participants and 1619 test results, from - 6 to 66 days post-symptom onset and hospitalisation. The highest percentage virus detection was from nasopharyngeal sampling between 0 and 4 days post-symptom onset at 89% (95% confidence interval (CI) 83 to 93) dropping to 54% (95% CI 47 to 61) after 10 to 14 days. On average, duration of detectable virus was longer with lower respiratory tract (LRT) sampling than upper respiratory tract (URT). Duration of faecal and respiratory tract virus detection varied greatly within individual participants. In some participants, virus was still detectable at 46 days post-symptom onset.

Conclusions: RT-PCR misses detection of people with SARS-CoV-2 infection; early sampling minimises false negative diagnoses. Beyond 10 days post-symptom onset, lower RT or faecal testing may be preferred sampling sites. The included studies are open to substantial risk of bias, so the positivity rates are probably overestimated.

Keywords: Anatomical sampling; COVID-19; Diagnostic test; Duration virus detection; IPD; QUADAS-2; RT-PCR; SARS-CoV-2; Systematic review.


Conflict of interest statement

SM, SH, AJA, SG, KG, SAT, BS, JP, PT, PW, JS, LFR, NR, NS, JS, AW, JA, GB, KG, and BN declare no conflicts of interest for the submitted work.

CH has advised Attomarker, a spin-out company of the University of Exeter about the conduct of evaluations of its tests for COVID antibodies, but received no payment for this advice and provided it as part of academic duties at the University of Exeter.

Figures

Fig. 1
Fig. 1
PRISMA flowchart
Fig. 2
Fig. 2
Number of positive and negative RT-PCR test results since symptom onset. Each panel shows a separate site used in participant sampling. Nasopharyngeal, saliva, and sputum were used where clearly reported. Throat included throat and oropharyngeal. Other URT includes samples reported in articles as nasal, mixed nasal and throat, oral, pharyngeal, or upper respiratory tract. For pharyngeal sampling, it was not clear if this was nasopharyngeal or oropharyngeal. Other LRT includes sampling reported as lower respiratory tract or one article including pleural fluid sampling. Blood included serum, plasma, or blood. Faeces included stool or anal swab. Each panel shows 5-day time periods since the onset of symptoms: 0–4 days, 5–9 days, 10–14 days, 15–19 days, 20–25 days, 26–30 days, 31–34 days, and 35 to max days. The numbers of positive RT-PCR tests are shown as dark blue bars and dark grey bars from 0 to 14 days and 15 to 40 days, respectively, and the number of negative RT-PCR results is shown similarly as light blue bars and light grey bars. Different colours are used before and after 15 days to indicate caution, as after 15 days testing is enriched in more severely ill participants. The total number of tests within a particular time period can be read from the x-axis
Fig. 3
Fig. 3
Number of positive and negative RT-PCR test results since hospital admission. Each panel shows a separate site used in participant sampling. Nasopharyngeal, saliva, and sputum were used where clearly reported. Throat included throat and oropharyngeal. Other URT includes samples reported in articles as nasal, mixed nasal and throat, oral, pharyngeal, or upper respiratory tract. For pharyngeal sampling, it was not clear if this was nasopharyngeal or oropharyngeal. Other LRT includes sampling reported as lower respiratory tract or one article including pleural fluid sampling. Blood included serum, plasma, or blood. Faeces included stool or anal swab. Each panel shows 5-day time periods since the hospital admission: 0–4 days, 5–9 days, 10–14 days, 15–19 days, 20–25 days, 26–30 days, 31–34 days, and 35 to max days. The numbers of positive RT-PCR tests are shown as dark blue bars and dark grey bars from 0 to 14 days and 15 to 40 days, respectively, and the number of negative RT-PCR results is shown similarly as light blue bars and light grey bars. Different colours are used before and after 15 days to indicate caution, as after 15 days testing is enriched in more severely ill participants. The total number of tests within a particular time period can be read from the x-axis
Fig. 4
Fig. 4
Comparison of duration of detectable virus from upper and lower respiratory tract sampling. a Time to undetectable virus in upper and lower respiratory tract samples. Kaplan-Meier with 95% confidence intervals and number at risk. All samples in review. b Time to undetectable virus in upper and lower respiratory tract samples in participants who were tested with both upper and lower respiratory tract sampling. Kaplan-Meier with 95% confidence intervals and number at risk. Restricted to participants with both sampling methods. c Time to undetectable virus in upper and lower respiratory tract samples in participants who were tested with both upper and lower respiratory tract sampling. Scatterplot where each dot represents a single participant, with the time to undetectable virus with both upper and lower respiratory tract sampling shown for each participant
Fig. 5
Fig. 5
Comparison of days to undetectable virus from respiratory tract and faecal sampling. Time to undetectable virus in faecal compared to any respiratory tract sample in participants who were tested with both sampling. Scatterplot where each dot represents a single participant, with the time to undetectable virus with both faecal and respiratory tract sampling shown for each participant. Thirty percent of participants tested at both sampling sites do not have detectable virus in faecal samples
Fig. 6
Fig. 6
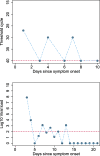
Example participants with intermittent false negative results. a An example of a participant with high viral load, but where alternate RT-PCR test results report high viral load or undetectable virus. A participant where virus levels have reduced over time to a level around the limit of viral detection, and at these low levels of virus, intermittent negative results will occur due to differences in the location or amount of sample
Fig. 7
Fig. 7
Risk of bias by adapted QUADAS-2 domain. An adapted version of QUADAS-2 for longitudinal studies was used (Additional file 1: Table S2). For each domain, the percentage of studies by concern for potential risk of bias is shown: low (green), unclear (yellow), and high (red)

Similar articles

Cited by

References

    1. Wikramaratna P, Paton RS, Ghafari M, Lourenco J. Estimating false-negative detection rate of SARS-CoV-2 by RT-PCR. medRxiv. 2020; 2020.04.05.20053355. - PMC - PubMed
    1. Kucirka LM, Lauer SA, Laeyendecker O, Boon D, Lessler J. Variation in false-negative rate of reverse transcriptase polymerase chain reaction-based SARS-CoV-2 tests by time since exposure. Ann Intern Med. 2020;173(4):262–267. doi: 10.7326/M20-1495. - DOI - PMC - PubMed
    1. Yu F, Yan L, Wang N, Yang S, Wang L, Tang Y, et al. Quantitative detection and viral load analysis of SARS-CoV-2 in infected patients. Clin Infect Dis. 2020. - PMC - PubMed
    1. Sethuraman N, Jeremiah SS, Ryo A. Interpreting diagnostic tests for SARS-CoV-2. JAMA. 2020. - PubMed
    1. Stewart LA, Clarke M, Rovers M, Riley RD, Simmonds M, Stewart G, et al. Preferred Reporting Items for Systematic Review and Meta-Analyses of individual participant data: the PRISMA-IPD Statement. JAMA. 2015;313(16):1657–1665. doi: 10.1001/jama.2015.3656. - DOI - PubMed

Publication types

MeSH terms