Multicenter Study
. 2021 Jan 15:225:117522.
doi: 10.1016/j.neuroimage.2020.117522. Epub 2020 Nov 2.

Dynamic brain fluctuations outperform connectivity measures and mirror pathophysiological profiles across dementia subtypes: A multicenter study

Affiliations
Multicenter Study

Dynamic brain fluctuations outperform connectivity measures and mirror pathophysiological profiles across dementia subtypes: A multicenter study

Sebastian Moguilner et al. Neuroimage. .

Abstract

From molecular mechanisms to global brain networks, atypical fluctuations are the hallmark of neurodegeneration. Yet, traditional fMRI research on resting-state networks (RSNs) has favored static and average connectivity methods, which by overlooking the fluctuation dynamics triggered by neurodegeneration, have yielded inconsistent results. The present multicenter study introduces a data-driven machine learning pipeline based on dynamic connectivity fluctuation analysis (DCFA) on RS-fMRI data from 300 participants belonging to three groups: behavioral variant frontotemporal dementia (bvFTD) patients, Alzheimer's disease (AD) patients, and healthy controls. We considered non-linear oscillatory patterns across combined and individual resting-state networks (RSNs), namely: the salience network (SN), mostly affected in bvFTD; the default mode network (DMN), mostly affected in AD; the executive network (EN), partially compromised in both conditions; the motor network (MN); and the visual network (VN). These RSNs were entered as features for dementia classification using a recent robust machine learning approach (a Bayesian hyperparameter tuned Gradient Boosting Machines (GBM) algorithm), across four independent datasets with different MR scanners and recording parameters. The machine learning classification accuracy analysis revealed a systematic and unique tailored architecture of RSN disruption. The classification accuracy ranking showed that the most affected networks for bvFTD were the SN + EN network pair (mean accuracy = 86.43%, AUC = 0.91, sensitivity = 86.45%, specificity = 87.54%); for AD, the DMN + EN network pair (mean accuracy = 86.63%, AUC = 0.89, sensitivity = 88.37%, specificity = 84.62%); and for the bvFTD vs. AD classification, the DMN + SN network pair (mean accuracy = 82.67%, AUC = 0.86, sensitivity = 81.27%, specificity = 83.01%). Moreover, the DFCA classification systematically outperformed canonical connectivity approaches (including both static and linear dynamic connectivity). Our findings suggest that non-linear dynamical fluctuations surpass two traditional seed-based functional connectivity approaches and provide a pathophysiological characterization of global brain networks in neurodegenerative conditions (AD and bvFTD) across multicenter data.

Keywords: AD; Copula-based dependence measure; Dynamic functional connectivity; bvFTD; fMRI resting-state connectivity.


Conflict of interest statement

Declaration of Competing Interest The authors report no competing interests.

Figures

Fig. 1.
Fig. 1.
Preprocessing and machine learning pipeline. (A) In order for the RS-BOLD data from the two groups to be classified, we employed the DPARSF pipeline for RS-fMRI data preprocessing, followed by band-pass filtering (0.01–0.08 Hz) to obtain the preprocessed time-series. (B) By using a wavelet-based algorithm, we employed the wavelet coefficients to remove large signal spikes without losing relevant information to obtain the cleaned time series. (C) We segmented the RS time series into non-overlapping windows of different time-scales (i.e., 5, 10, 15, 20 and 25 time-points). (D) We defined seeds for the DMN, SN, EN, VN, and MN networks to obtain the RSNs by employing the Iϕ2 copula dependence measure. Then we used standard masks to identify the voxels for each network. (E) We spatially averaged the voxels to obtain one RSNs time series for each network. Then we used the standard deviation statistic to obtain the fluctuation features for later normalization. (F) For testing different feature combinations, we used a LOOCV validation scheme for Bayesian hyper-parameter tuning to obtain trained XGBoost models, and then we tested our classification with independent datasets. For ROC analysis, we defined bvFTD group as the “positive ” class and AD group as the “negative ” class, allowing the sensitivity and specificity metrics being applicable to patients groups comparisons, as reported previously (Caso et al., 2012). RS-BOLD: fMRI resting-state BOLD datasets; masked RSNs: masked resting-state networks; FEATURE ENG: Feature engineering; DATA NORM: Data normalization.
Fig. 2.
Fig. 2.
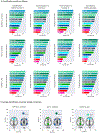
Classification accuracy rankings and average results. Classification accuracy ranking and average results. (A) Binary classification results for bvFTD vs. controls, AD vs. controls, and bvFTD vs. controls, training and testing within Country-1 (first column), training with Country-1 and testing with Country-2 (Generalization to Country 2, second column), training with Country-1 and testing with Country-3 (Generalization to Country-3, third column), and the results from the training and testing of our model with an online databases (ADNI and NIFD, fourth column). Classification accuracy ranking ordered from highest to lowest accuracy rates shows the best set of features for each classification. (B) Average results for each classification type over the four analyses showing mean sensitivity (y-axis), specificity (x-axis) and accuracy (average classification accuracy across databases: 87.64% for bvFTD vs. controls, 87.95% for AD vs. controls, and 84.97% for bvFTD vs AD). C: Healthy control; bvFTD: behavioral-variant frontotemporal dementia; AD: Alzheimer’s disease; SN: salience network; EN: executive network; DMN: default mode network; VN: visual network; MN: motor network.
Fig. 3.
Fig. 3.
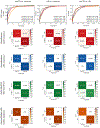
ROC curves and confusion matrices. First row: Each ROC curve represents the performance of the best resting-state networks for each binary classification model per country (SN + EN networks for bvFTD vs controls; DMN + EN networks for AD vs controls; and DMN + SN for bvFTD vs AD). Second to fifth rows: confusion matrices for each of the ROC curves of the first row (in percentage values). Controls: Healthy control; bvFTD: behavioral variant frontotemporal dementia; AD: Alzheimer’s disease; SN: salience network; EN: executive network; DMN: default mode network.
Fig. 4.
Fig. 4.
Statistical comparison of ROC curves. (A) ROC curves representing the classification performance for Country-1 for each classification pair, with their corresponding AUC value. In green, we show the ROC curve of the SFC classification using the best performing features for the classification (SN + EN networks for bvFTD vs controls; DMN + EN networks for AD vs controls; and DMN + SN for bvFTD vs AD). In blue, we present atrophy AUC results obtained from the classification based on the SBM analysis for each subject. To compare the classification results between the two methodologies, we employed a non-parametric permutation comparison test of the ROC curves (Venkatraman, 2000). All p -values < 0.05 show that there are statistically significant differences between methods for all classification pairs. (B) ROC curves representing the classification performance for Country-1 for each classification pair, with their corresponding AUC value. The ROC curve of the DCFA classification using the best performing features for the classification (SN + EN networks for bvFTD vs controls; DMN + EN networks for AD vs controls; and DMN + SN for bvFTD vs AD) is shown in red. Atrophy measures are plotted in blue. All p-values > 0.05 show significant differences for A (SFC vs atrophy). But not for B (DCFA vs atrophy) in each classification pair.

References

    1. Agosta F, P. M, Geroldi C, Copetti M, Frisoni GB, Filippi M, 2012. Resting state fMRI in Alzheimer’s disease: beyond the default mode network. Neurobiol Aging. 33 (8), 1564–1578. - PubMed
    1. Agosta F, et al., 2013. Brain network connectivity assessed using graph theory in frontotemporal dementia. Neurology 81 (2), 134–143. - PubMed
    1. Alladi S, Hachinski V, 2018. World dementia: one approach does not fit all. Neurology 91 (6), 264–270. - PubMed
    1. Ashburner J, Friston KJ, 1999. Nonlinear spatial normalization using basis functions. Hum. Brain Mapp 7 (4), 254–266. - PMC - PubMed
    1. Bachli MB, et al., 2020. Evaluating the reliability of neurocognitive biomarkers of neurodegenerative diseases across countries: a machine learning approach. Neuroimage 208, 116456. doi: 10.1016/j.neuroimage.2019.116456. - DOI - PMC - PubMed

Publication types

MeSH terms