. 2021 Jan-Jun:296:100019.
doi: 10.1074/jbc.RA120.015271. Epub 2020 Nov 22.

Misfolding, altered membrane distributions, and the unfolded protein response contribute to pathogenicity differences in Na,K-ATPase ATP1A3 mutations

Affiliations

Misfolding, altered membrane distributions, and the unfolded protein response contribute to pathogenicity differences in Na,K-ATPase ATP1A3 mutations

Elena Arystarkhova et al. J Biol Chem. 2021 Jan-Jun.

Abstract

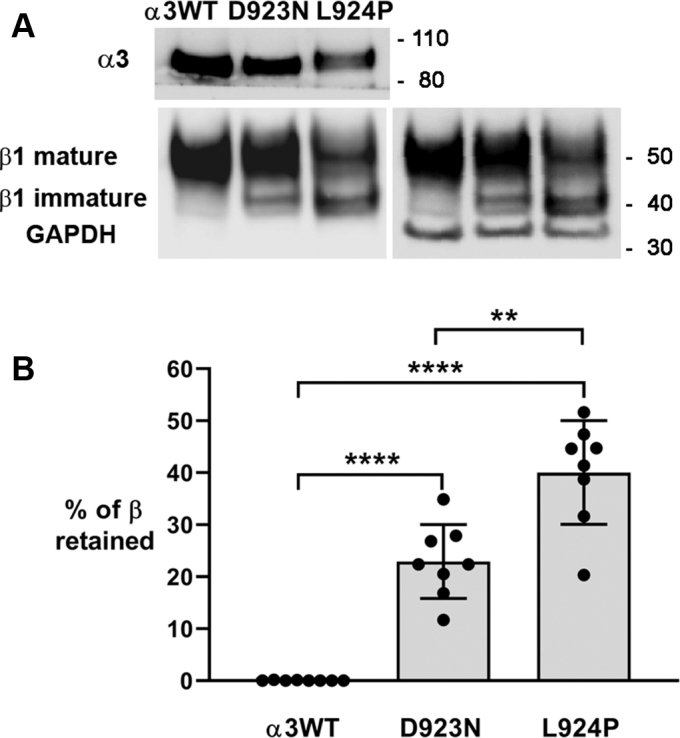
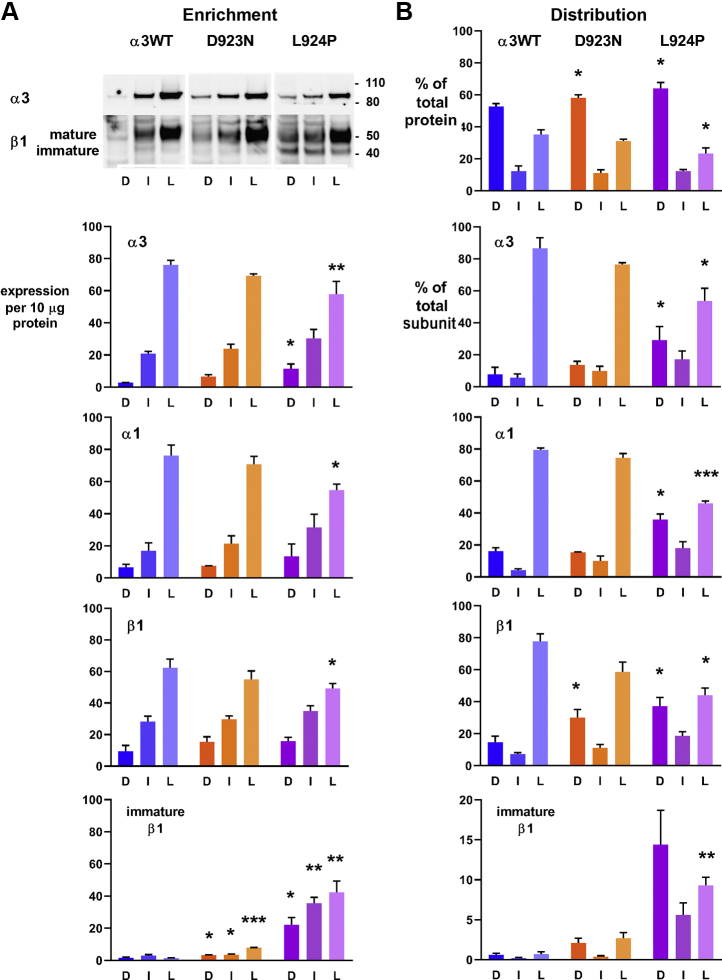
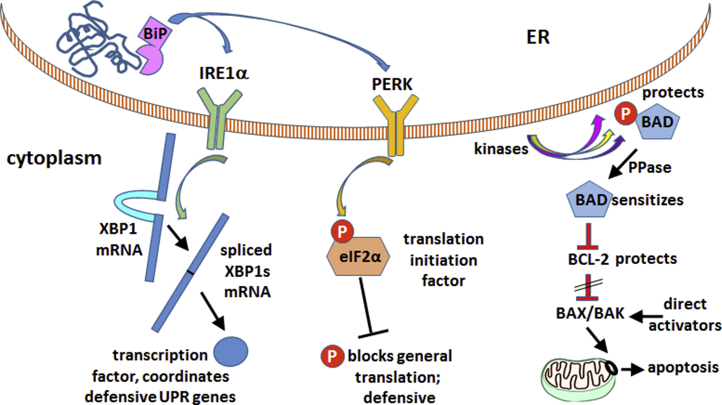
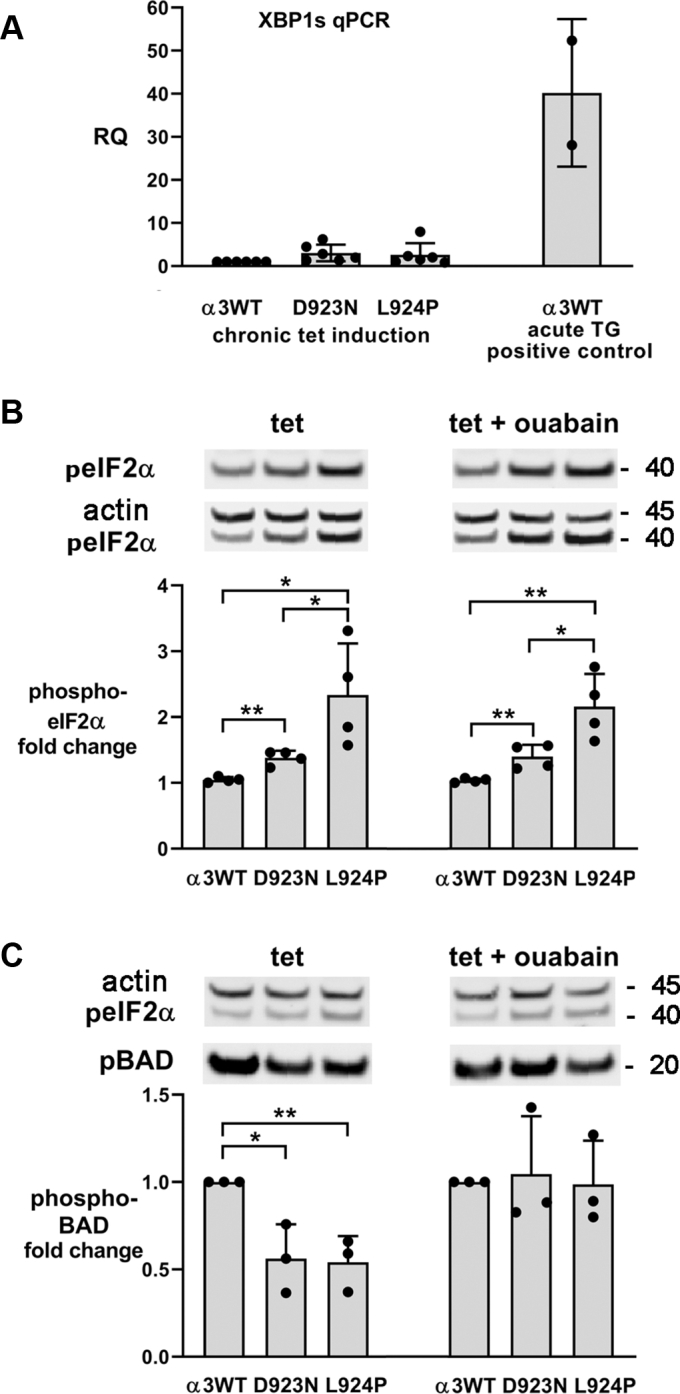
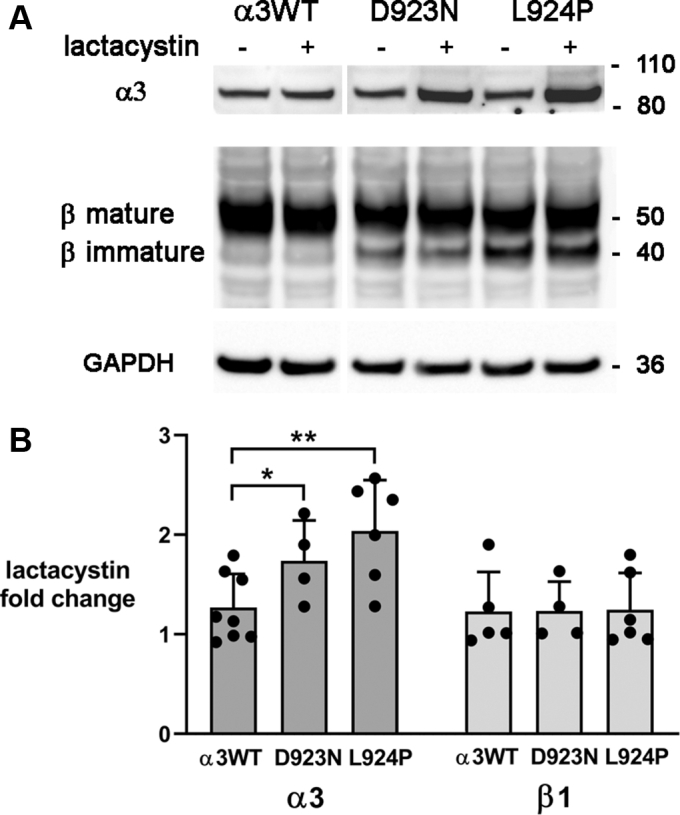
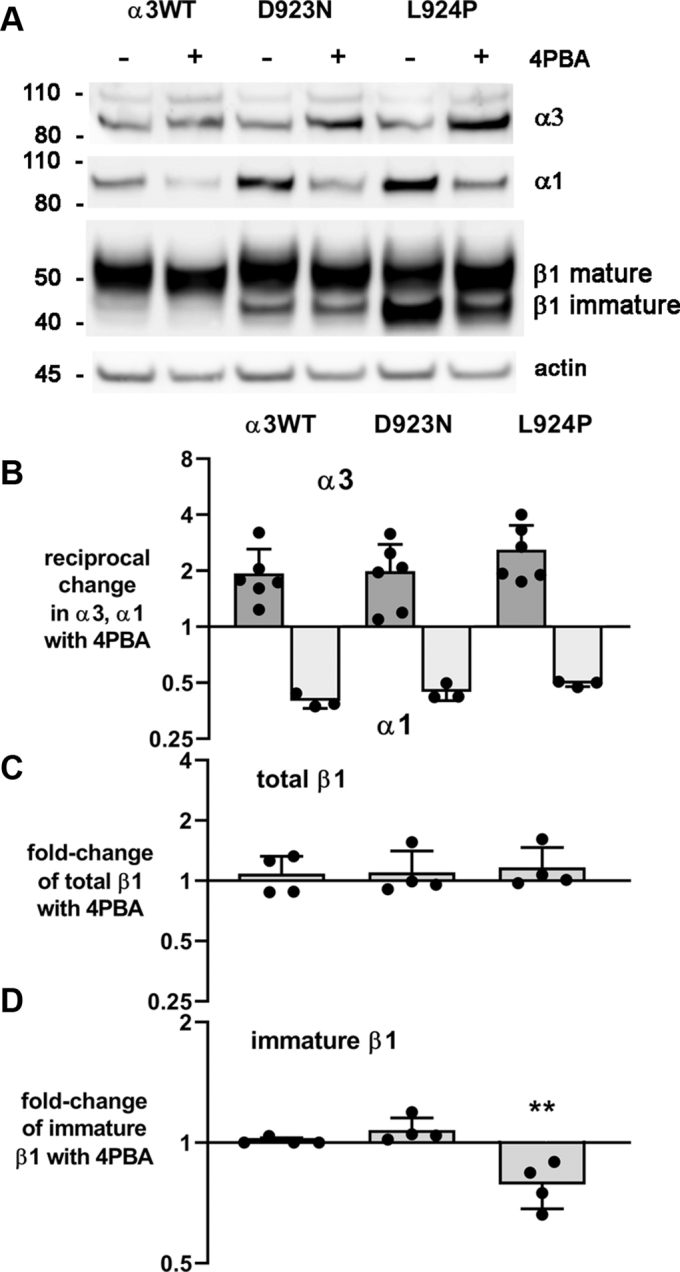
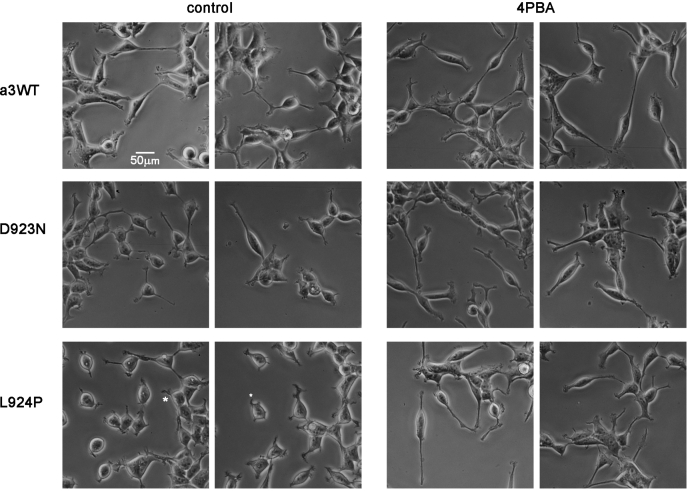
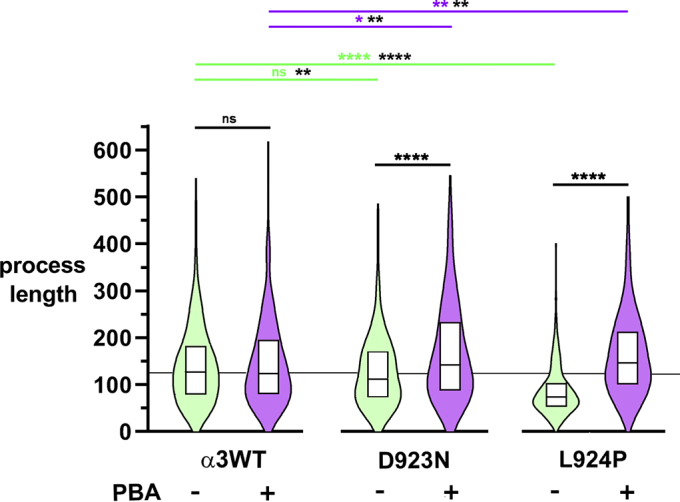
Missense mutations in ATP1A3, the α3 isoform of Na,K-ATPase, cause neurological phenotypes that differ greatly in symptoms and severity. A mechanistic basis for differences is lacking, but reduction of activity alone cannot explain them. Isogenic cell lines with endogenous α1 and inducible exogenous α3 were constructed to compare mutation properties. Na,K-ATPase is made in the endoplasmic reticulum (ER), but the glycan-free catalytic α subunit complexes with glycosylated β subunit in the ER to proceed through Golgi and post-Golgi trafficking. We previously observed classic evidence of protein misfolding in mutations with severe phenotypes: differences in ER retention of endogenous β1 subunit, impaired trafficking of α3, and cytopathology, suggesting that they misfold during biosynthesis. Here we tested two mutations associated with different phenotypes: D923N, which has a median age of onset of hypotonia or dystonia at 3 years, and L924P, with severe infantile epilepsy and profound impairment. Misfolding during biosynthesis in the ER activates the unfolded protein response, a multiarmed program that enhances protein folding capacity, and if that fails, triggers apoptosis. L924P showed more nascent protein retention in ER than D923N; more ER-associated degradation of α3 (ERAD); larger differences in Na,K-ATPase subunit distributions among subcellular fractions; and greater inactivation of eIF2α, a major defensive step of the unfolded protein response. In L924P there was also altered subcellular distribution of endogenous α1 subunit, analogous to a dominant negative effect. Both mutations showed pro-apoptotic sensitization by reduced phosphorylation of BAD. Encouragingly, however, 4-phenylbutyrate, a pharmacological corrector, reduced L924P ER retention, increased α3 expression, and restored morphology.

Keywords: 4-phenylbutyrate (4PBA); N-linked glycosylation; Na(+)/K(+)-ATPase; endoplasmic reticulum associated protein degradation (ERAD); endoplasmic reticulum stress (ER stress); eukaryotic initiation factor 2alpha (eIF2 α); genetic disease; protein misfolding; subcellular fractionation; unfolded protein response (UPR).


Conflict of interest statement

Conflict of interest The authors declare that they have no conflicts of interest with the contents of this article.

Figures

Figure 1
Figure 1
Retention of Na,K-ATPase β1 subunit in endoplasmic reticulum. The high-mannose form of Na,K-ATPase β is known to migrate faster, and mature glycosylation is a marker of its progress through the Golgi apparatus. A, sections of a single representative Western blot stained with isoform-specific antibodies for α3 (F1, Santa Cruz) and β1 (M17-P5-F11, W. J. Ball Jr, University of Cincinnati), then restained for GAPDH as a loading control. The band for β1 with mature glycosylation was always broad and frequently showed substructures presumably representing differences in glycosylation. B, quantification of imager scans of β subunit in n = 9 (WT) or n = 8 (D923N, L924P) independent experiments, with actin or GAPDH as a loading control. What is shown is the fraction of immature β out of the total, which is independent of expression levels. Significance was calculated by two-tailed t test. ∗∗p < 10−3; ∗∗∗∗p < 0.0001.
Figure 2
Figure 2
The subunits of Na,K-ATPase separated on equilibrium density step gradients were analyzed in two ways: by their enrichment (relative purity) in dense (D), intermediate (I), and light (L) fractions, and by distribution in those fractions, taking into account the total amount of protein in each fraction. For the Western blot (one representative immunoblot cut and stained with different antibodies), equal protein loading was used to quantify α3, α1, and β1. A, enrichment in the light fractions was reduced in both mutations, quantitatively more in L924P. The graphs below the blot show quantification from 3 (α3WT and D923N) or 4 (L924P) independent experiments. Blot intensities from different experiments and antibodies were normalized as described in Experimental procedures. The statistical significance of differences between fractions, and between cell lines, was assessed by t test independently. First, all differences between dense and light fractions for each set of data were significant at p < 0.05 except for immature β1 in α3WT, where signals were too faint for accurate background subtraction. This dense versus light significance is not marked on the graph. Second, among α3, α1, total β1, and immature β1, the significant differences between a mutation and WT at corresponding sucrose densities are marked with asterisks, (∗) p < 0.05, (∗∗) p < 0.005, and (∗∗∗) p < 0.0005. For D923N, only the immature β1 differences were significant. Notice that, for α3, there appears to be more in the mutant dense fraction than in WT. In terms of enrichment of light compared with dense fractions, there was an average 18-fold enrichment in plasma membrane for α3WT, but only 10.4-fold for D923N and 7.4-fold for L924P. For β subunit in the same fractions, the enrichment was only 6.5-fold for α3WT and 3.6- to 3.7-fold for both mutations. B, distribution of total protein and each subunit in the same gradients was compared. Statistical significance was tested for the distributions for mutants compared with α3WT. There was a statistically significant shift in the distribution of total protein to the dense fraction in D923N and L924P cells and a decrease in the amount distributed to the light fraction in L924P cells, consistent with remodeling of the intracellular membranes. The extent of redistribution of α3 is consistent with the premise that there is an adaptive UPR response elicited by L924P. It was unexpected that α1 and β1 distributions were equally affected.
Figure 3
Figure 3
Relevant pathways of the unfolded protein response (UPR). This diagram shows only a few of the components of the UPR but highlights three central elements that were examined here. The UPR begins with the recognition of luminal misfolded proteins by the chaperone BiP (GRP78), known to interact with both α and β Na,K-ATPase subunits during biosynthesis in Xenopus oocytes (22). The UPR initially activates defensive programs to expand the folding capacity of the ER. (Left) Activated IRE1α has a cytoplasmic nuclease activity needed to splice the XPB1 mRNA to XBP1s, changing its reading frame so that it encodes a master transcription factor for the defensive arm of the UPR. (Middle) Activated PERK phosphorylates an essential translation initiation factor, eIF2α. This attenuates translation, reducing the stress on the ER and making it possible for its resources to be redirected to defensive adaptations (37). (Right) If aggregated proteins nonetheless accumulate, the UPR activates apoptosis (38). The pathway utilizes the BCL-2 family proteins that regulate the formation of mitochondrial pores (black circle) by BAX and BAK to release cytochrome c (38). Current models hold that BAX and BAK are activated directly by members of one arm of the BCL-2 family (the direct activators), in response to various signals. Apoptosis is constitutively restrained, however, by BCL-2 itself, which binds and blocks BAX and BAK. For apoptosis to proceed, BCL-2 needs to be sequestered (crosshatch) by binding to BAD or other members of the sensitizer arm of the BCL-2 family. BAD binding to BCL-2 is attenuated by phosphorylation by a variety of prosurvival kinases (39, 40). Dephosphorylation of BAD by protein phosphatase (PPase), for example, by calcineurin, the Ca2+-activated phosphatase, will activate proapoptotic signaling (41). In sum, dephosphorylation of BAD, at Ser99 in this case, is an indication that BAD is free to inactivate BCL-2, making it more likely that BAX and BAK will respond to direct activators, i.e., sensitizing the cell to apoptosis.
Figure 4
Figure 4
Unfolded protein response signaling responses to mutation.A, the spliced mRNA of the transcription factor XBP1s is an early unfolded protein response marker. Although 5 h of thapsigargin treatment (TG) gave a robust response, the apparent twofold increase in the spliced mRNA with chronic tet induction when compared with α3WT grown without tet or between α3WT and either of the mutation-expressing cells was not statistically significant. RQ stands for relative quantification and is the fold-change relative to the calibrator (actin), 2-ddCt. The data are means ± SEM for 4, 6, 5, and 2 experiments. B, eIF2α phosphorylation was measured in lysates of cultures that were grown chronically in tet, or in tet + ouabain to inhibit endogenous Na,K-ATPase α1. The representative blot was stained first for phospho-eIF2α (top) and then stained again for actin as a loading control. Both images are shown. C, BAD phosphorylation measured in the same samples. The blot shown was the same as in B including the eIF2α and actin stain, but BAD runs at lower molecular weight and was stained after phospho-eIF2α and actin. The graphs for both B and C show the means ± SEM from four independent experiments. ∗p < 0.01, ∗∗p < 0.001, ∗∗∗p < 0.0001. Ouabain appeared to protect the cells from dephosphorylation of BAD.
Figure 5
Figure 5
Evidence for proteasomal degradation of both mutations.A, representative blot of α3 and β1 in cultures induced chronically with tet and then treated or not for 16 h with the proteasome inhibitor lactacystin. All pieces were from the same blot. B, quantification of n = 8 for α3WT, n = 4 for D923N, and n = 6 for L924P. ∗∗p < 0.001. It is notable that protease inhibition did not affect either the amount of β1 or the proportion of its immature form.
Figure 6
Figure 6
A pharmaceutical corrector rescued expression of α3 and enhanced its trafficking out of the endoplasmic reticulum.A, replicate representative blots from one experiment were cut and stained with different antibodies. Incubation in 4PBA for 48 h resulted in a relative increase in α3 and decrease in α1; no change in the total amount of β1; but a shift of β1 in L924P-expressing cells from the immature to the mature glycosylated form, a marker of transfer from endoplasmic reticulum to Golgi. BD, the results were quantified for n = 3 or 4 independent experiments. Scans of lanes were individually normalized to actin or GAPDH. B, reciprocal changes in α3 and α1, normalized to the control untreated sample in each experiment. The reciprocal change in expression is consistent with increased competition of the exogenous α3 for a rate-limiting factor, such as β subunit. C, expression of β1 appeared to be increased slightly but not significantly by 4PBA in all cell lines. D, the proportions of immature β1 were the same as seen in Figure 1 in the three cell lines. For L924P only, there was a statistically significant reduction in the immature form, p < 0.01, with a shift to the mature form.
Figure 7
Figure 7
4-Phenylbutyrate (4PBA) treatment improved the morphology of L924P-expressing cells. Chronically induced cells were plated at relatively low density in chamber slides so that morphology could be observed. Fresh medium with or without 4PBA was added 24 h after replating. Phase-contrast pictures were taken after an additional 24 h. Asterisks (∗) in L924P cells without 4PBA treatment show stubby pseudopod extension still present 48 h after replating. Representative of four independent experiments. The scale bar represents 50 μm.
Figure 8
Figure 8
Combination box and kernel density plots show the effect of mutation and of 4-phenylbutyrate (4PBA) on the length of cell processes. Units of length are arbitrary as reported by ImageJ but rarely exceed 2 cell body lengths. The midline of each box is the median length, and the top and bottom edges of the boxes are the quartiles of distribution. Median lengths were reduced 12% in D923N cells and 42% in L924P cells. 4PBA had little effect in α3WT (n > 300 per condition) but more than normalized the measurements in both mutations (n > 200 per condition). The data are representative of one of four independent experiments. The tips of the violin plots were truncated at the longest measured length in each group. Data were analyzed by Mann–Whitney tests of significance with Tukey’s analysis for multiple comparisons. The comparisons in black show the improvement in process length with 4PBA treatment. The comparisons in green and magenta show the significance of differences between α3WT and each mutation. Additional comparisons with black asterisks are one-tailed tests to increase sensitivity to reductions and increases in the medians, which was important to detect the significance of the reduction of length in untreated D923N. ∗, <0.05. ∗∗, <0.01. ∗∗∗∗, <0.0001.

References

    1. Lassuthova P., Rebelo A.P., Ravenscroft G., Lamont P.J., Davis M.R., Manganelli F., Feely S.M., Bacon C., Brozkova D.S., Haberlova J., Mazanec R., Tao F., Saghira C., Abreu L., Courel S. Mutations in ATP1A1 cause dominant Charcot-Marie-Tooth type 2. Am. J. Hum. Genet. 2018;102:505–514. - PMC - PubMed
    1. Friedrich T., Tavraz N.N., Junghans C. ATP1A2 mutations in migraine: seeing through the facets of an ion pump onto the neurobiology of disease. Front. Physiol. 2016;7:239. - PMC - PubMed
    1. Haq I.U., Snively B.M., Sweadner K.J., Suerken C.K., Cook J.F., Ozelius L.J., Miller C., McCall W.V., Whitlow C., Brashear A. Revising rapid-onset dystonia-parkinsonism: broadening indications for ATP1A3 testing. Mov. Disord. 2019;34:1528–1536. - PMC - PubMed
    1. Dard R., Mignot C., Durr A., Lesca G., Sanlaville D., Roze E., Mochel F. Relapsing encephalopathy with cerebellar ataxia related to an ATP1A3 mutation. Dev. Med. Child. Neurol. 2015;57:1183–1186. - PubMed
    1. Yano S.T., Silver K., Young R., DeBrosse S.D., Ebel R.S., Swoboda K.J., Acsadi G. Fever-induced paroxysmal weakness and encephalopathy, a new phenotype of ATP1A3 mutation. Pediatr. Neurol. 2017;73:101–105. - PubMed

Publication types

Substances

LinkOut - more resources