. 2020 Dec 15;147(24):dev192625.
doi: 10.1242/dev.192625.

HY5 and phytochrome activity modulate shoot-to-root coordination during thermomorphogenesis in Arabidopsis

Affiliations

HY5 and phytochrome activity modulate shoot-to-root coordination during thermomorphogenesis in Arabidopsis

Christophe Gaillochet et al. Development. .

Abstract

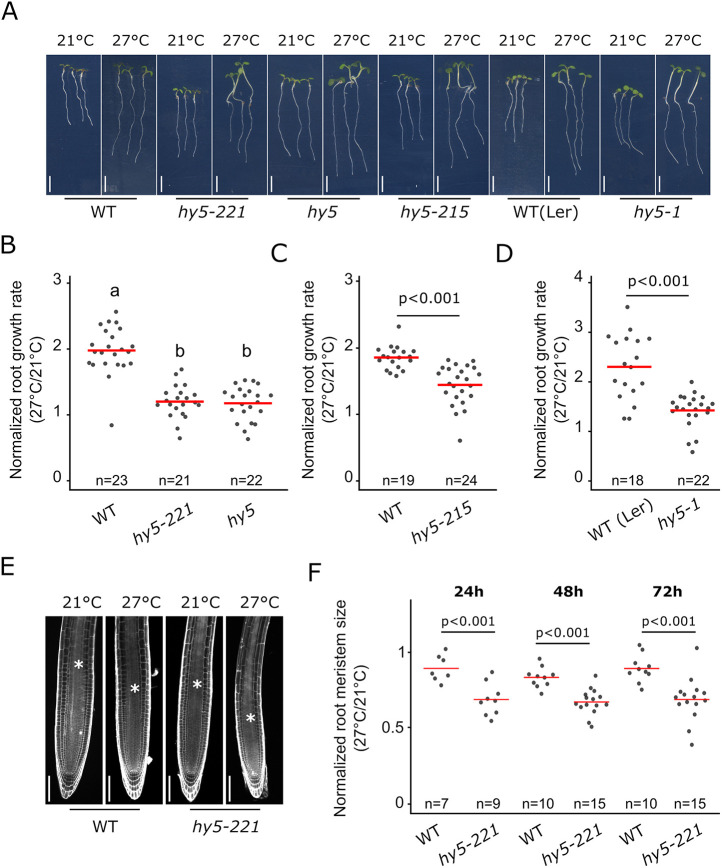
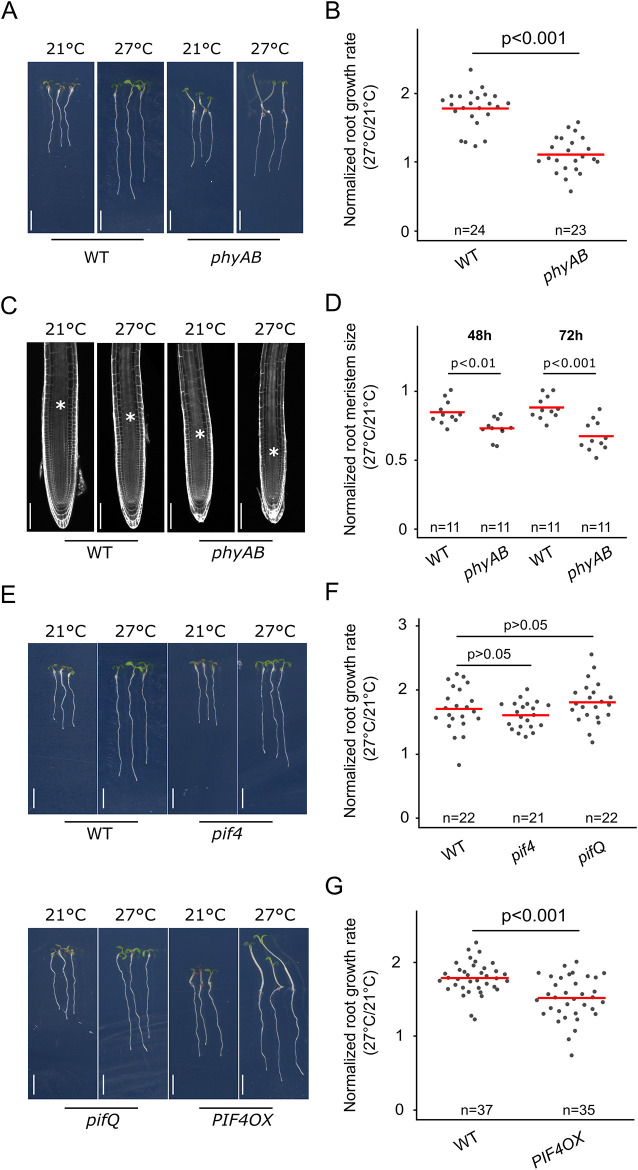
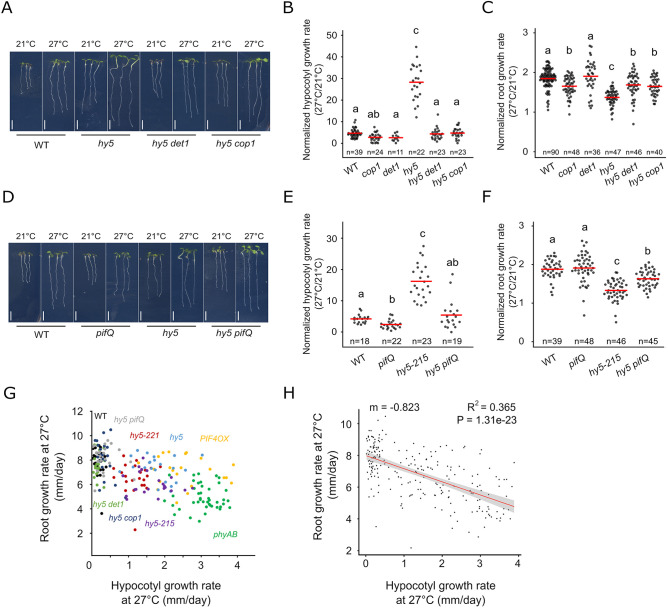
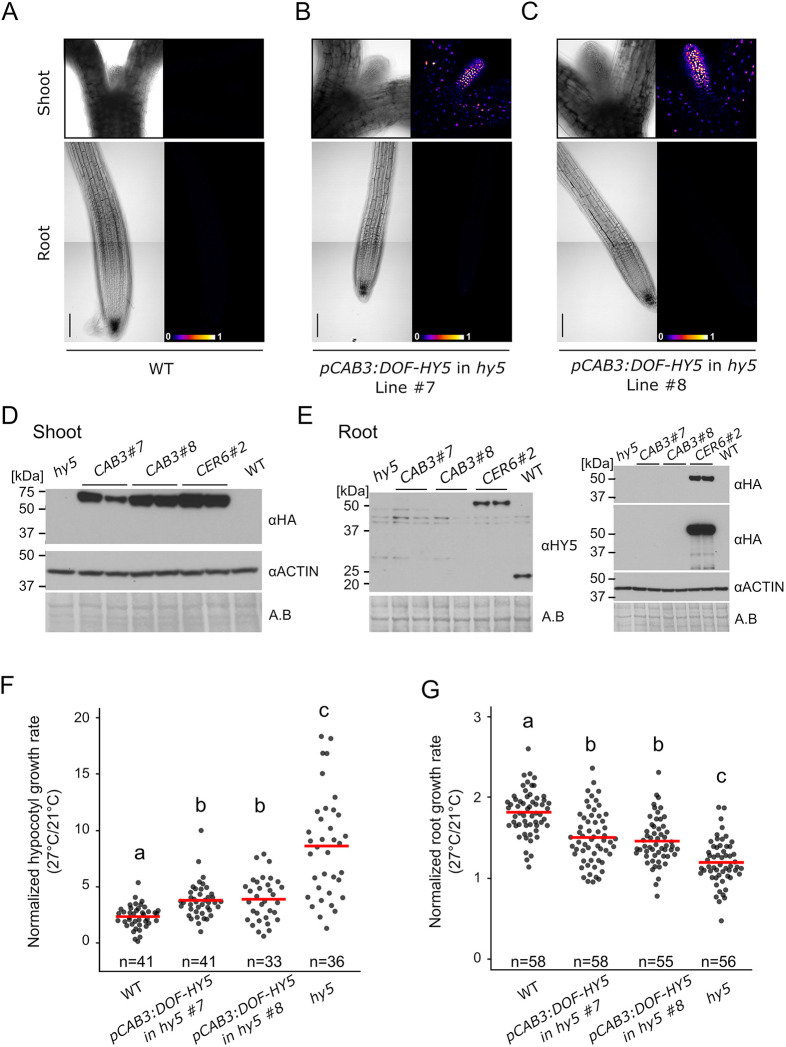
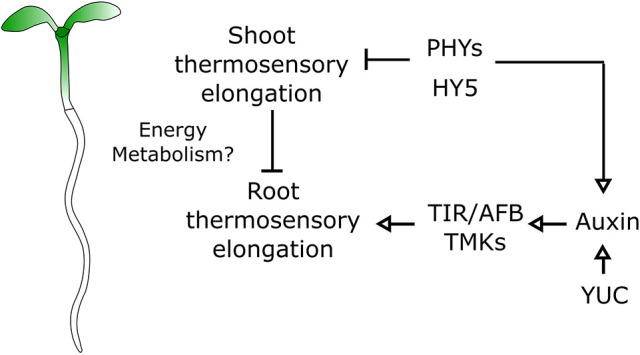
Temperature is one of the most impactful environmental factors to which plants adjust their growth and development. Although the regulation of temperature signaling has been extensively investigated for the aerial part of plants, much less is known and understood about how roots sense and modulate their growth in response to fluctuating temperatures. Here, we found that shoot and root growth responses to high ambient temperature are coordinated during early seedling development in Arabidopsis A shoot signaling module that includes HY5, the phytochromes and the PIFs exerts a central function in coupling these growth responses and maintaining auxin levels in the root. In addition to the HY5/PIF-dependent shoot module, a regulatory axis composed of auxin biosynthesis and auxin perception factors controls root responses to high ambient temperature. Taken together, our findings show that shoot and root developmental responses to temperature are tightly coupled during thermomorphogenesis and suggest that roots integrate energy signals with local hormonal inputs.

Keywords: Arabidopsis; HY5; Phytochromes; Root development; Temperature; Thermomorphogenesis.


Conflict of interest statement

Competing interestsThe authors declare no competing or financial interests.

Figures

Fig. 1.
Fig. 1.
HY5 mediates the root response to higher ambient temperature. (A) Wild-type (WT) and hy5 allelic mutant seedlings at 6 days after germination (DAG) and 3 days after transfer to 21°C or 27°C. WT(Ler) and hy5-1 are in the Ler ecotype background. (B-D) Normalized root growth (27°C/21°C) in WT, hy5 and hy5-221 (B), hy5-1 (D) and hy5-215 (C) seedlings. (E) Root meristem in WT and hy5-221 mutant at 5 DAG and 2 days after transfer to 21°C or 27°C. Asterisks mark the root transition zone. (F) Normalized root meristem size (27°C/21°C) in WT and hy5-22 seedlings at 24, 48 and 72 h after temperature shift. n indicates the number of individual seedlings measured. Measured seedlings were obtained in one (F) or two (B,C,D) independent replications of the experiment. In B, groups denoted by different letters are significantly different from one another (P<0.05; one-way ANOVA and Tukey HSD post hoc test). Other P-values were calculated using a two-tailed, unpaired Student's t-test (C,D,F). Red bar represents the mean (B-D,F). Scale bars: 5 mm (A); 100 µm (E).
Fig. 2.
Fig. 2.
Phytochrome signaling regulates the root response to higher ambient temperature. (A) Wild-type (WT) and phyAB mutant seedlings at 6 DAG and 3 days after transfer to 21°C or 27°C. (B) Normalized root growth (27°C/21°C) in WT and phyAB seedlings. (C) Root meristems in WT and phyAB seedlings, 5 DAG and 2 days after transfer to 21°C or 27°C. Asterisks mark the root transition zone. (D) Normalized root meristem size (27°C/21°C) in WT and phyAB seedlings, 48 and 72 h after temperature shift. (E) WT, pif4, pifQ and PIF4 OX mutant seedlings at 6 DAG and 3 days after transfer to 21°C or 27°C. (F,G) Normalized root growth (27°C/21°C) in WT, pif4, pifQ (F) and PIF4 OX (G) seedlings. n indicates the number of individual seedlings measured. Measured seedlings were obtained in one (F) or two (B,D,G) independent replications of the experiment. P-values in F were calculated using one-way ANOVA and Tukey HSD post hoc test. Other P-values were calculated using a two-tailed, unpaired Student’s t-test (B,D,G). Red bar represents the mean (B,D,F,G). Scale bars: 5 mm (A,E); 100 µm (C).
Fig. 3.
Fig. 3.
The HY5-PIF module regulates the root response to temperature. (A) Wild-type (WT), hy5, hy5 det1 and hy5 cop1 mutant seedlings at 6 DAG and 3 days after transfer to 21°C or 27°C. (B,C) Normalized hypocotyl (B) and root growth (C) (27°C/21°C) in WT, cop1, det1, hy5, hy5 det1 and hy5 cop1 seedlings. (D) WT, pifQ, hy5 and hy5 pifQ mutant seedlings at 6 DAG and 3 days after transfer to 21°C or 27°C. (E,F) Normalized hypocotyl (E) and root growth (F) (27°C/21°C) in WT, pifQ, hy5-215 and hy5 pifQ seedlings. (G,H) Relation between root and hypocotyl growth rate at 27°C, as shown with measurements on individual WT (n=23), hy5-221 (n=24), phyAB (n=43), PIF4OX (n=22), hy5 (n=22), hy5 det1 (n=20), hy5 cop1 (n=22), hy5-215 (n=23) and hy5 pifQ (n=22) plants (G) and after non-parametric regression analysis (H). Shaded region in H indicates a point-wise 95% confidence interval on the fitted values (red line). n indicates the number of individual seedlings measured. Measured seedlings were obtained in one (G,H) or three (B,C,E,F) independent replications of the experiment. In B,C,E,F, groups denoted by different letters are significantly different from one another (P<0.05; one-way ANOVA and Tukey HSD post hoc test in C,F; one-way ANOVA after log10 transformation in B,E). Linear regression method, Pearson correlation (H). Red bar represents the mean (B,C,E,F). Scale bars: 5 mm.
Fig. 4.
Fig. 4.
Shoot response to temperature is sufficient to modulate root growth response. (A-C) Brightfield and false color view of DoF-Hy5 fluorescence at 6 DAG of wild-type (WT) seedlings (A) and two independent lines of hy5 carrying pCAB3:DOF-HY5 (B,C). (D,E) Immunoblotting of shoot (D) or root tissues (E) in WT, hy5, two independent lines of hy5 carrying pCAB3:DOF-HY5 (CAB3#7 and CAB3#8) and hy5 carrying pCER6:DOF-HY5 and pCAB3:DOF-HY5 (CER6#2) at 27°C. DoF-HY5 protein was detected using anti-HA or anti-HY5 antibodies. For anti-HA, the same blot was displayed at short (upper panel) and longer exposure time (lower panel). Amido Black (A.B.) staining and anti-actin antibody were used as controls. DoF-HY5 samples were run in duplicate. (F) Normalized hypocotyl growth (27°C/21°C) in WT, hy5 and pCAB3:DOF-HY5 rescue lines. (G) Normalized root growth (27°C/21°C) in WT, hy5 and pCAB3:DOF-HY5 rescue lines. n indicates the number of individual seedlings measured. Measured seedlings were obtained in two (D-G) or three (A-C) independent replications of the experiment. In F and G, groups denoted by different letters are significantly different from one another (P<0.05; one-way ANOVA and Tukey HSD post hoc test). Red bar represents the mean (F,G). Scale bars: 100 µm.
Fig. 5.
Fig. 5.
Genome-wide analysis of root response to temperature. (A,B) Genes regulated at 4 h (A) or 18 h (B) after temperature shift in wild-type (Col-0), hy5 and phyAB roots. Gene ontologies (GO) characterize the biological processes enriched among the temperature-regulated genes that are shared between wild-type, hy5 and phyAB samples. (C) Overlapping misregulated genes in hy5 and phyAB roots at 27°C. Gene ontologies characterize the biological processes shared among HY5 and phytochrome co-regulated genes in the root at higher ambient temperature. (D) Differentially regulated genes belonging to the GO category ‘generation of precursor metabolites and energy genes’ in hy5 and phyAB roots at 27°C. Biological triplicates were analyzed; P-values were calculated using AgrigoV2 (A-C).
Fig. 6.
Fig. 6.
Auxin homeostasis regulates root thermomorphogenesis. (A-C) Normalized root growth (27°C/21°C) in wild-type (WT), tir1, afb2, tir1 afb2 (A), tmk1,4 (B) and yucQ (C) seedlings. (D) Differentially regulated genes in hy5 and phyAB roots at 27°C that are auxin (IAA) responsive according to Omelyanchuk et al. (2017), 4 h after temperature shift. (E) IAA concentration [pmol/g of fresh weight (FW)] in roots of seedlings at 6 DAG, 12 h after transfer to 21°C or 27°C (n>3). (F) Relative IAA content in roots compared with those in shoot tissues of seedlings 6 DAG, 12 h after transfer to 21°C or 27°C (n>3). n indicates the number of individual seedlings measured (A-C) or the number of biological replicates (E,F). Measured seedlings were obtained in three (A-C) independent replications of the experiment. In A,E,F, groups denoted by different letters are significantly different from one another [P<0.05; one-way ANOVA and Tukey HSD post hoc test (A,E) or Student–Newmann–Keuls post hoc test (F)]. Other P-values were calculated using a two-tailed, unpaired Student's t-test (B,C) or hypergeometric test (D). Red bar represents the mean (A-C).
Fig. 7.
Fig. 7.
A genetic model for organ growth coordination during plant thermomorphogenesis. Model of root thermosensory response. Roots integrate regulatory signals coming from the shoot through the activity of phytochromes and HY5 with auxin signals mediated by biosynthetic genes (YUC) and signaling (TIR, AFB, TMK).

References

    1. Anders S., Pyl P. T. and Huber W. (2015). HTSeq—a Python framework to work with high-throughput sequencing data. Bioinformatics 31, 166-169.10.1093/bioinformatics/btu638 - DOI - PMC - PubMed
    1. Bellstaedt J., Trenner J., Lippmann R., Poeschl Y., Zhang X., Friml J., Quint M. and Delker C. (2019). A Mobile auxin signal connects temperature sensing in cotyledons with growth responses in hypocotyls. Plant Physiol. 180, 757-766.10.1104/pp.18.01377 - DOI - PMC - PubMed
    1. Benjamins R. and Scheres B. (2008). Auxin: the looping star in plant development. Annu. Rev. Plant Biol. 59, 443-465.10.1146/annurev.arplant.58.032806.103805 - DOI - PubMed
    1. Bielach A., Hrtyan M. and Tognetti V. B. (2017). Plants under stress: involvement of auxin and Cytokinin. Int. J. Mol. Sci. 18, 1427 10.3390/ijms18071427 - DOI - PMC - PubMed
    1. Bürger M., Willige B.C. and Chory J. (2017). A hydrophobic anchor mechanism defines a deacetylase family that suppresses host response against YopJ effectors. Nat. Commun. 8, 2201 10.1038/s41467-017-02347-w - DOI - PMC - PubMed

Publication types

MeSH terms