

SMN Protein Contributes to Skeletal Muscle Cell Maturation Via Caspase-3 and Akt Activation
- PMID: 33144430
- PMCID: PMC7811598
- DOI: 10.21873/invivo.12161
SMN Protein Contributes to Skeletal Muscle Cell Maturation Via Caspase-3 and Akt Activation
Abstract
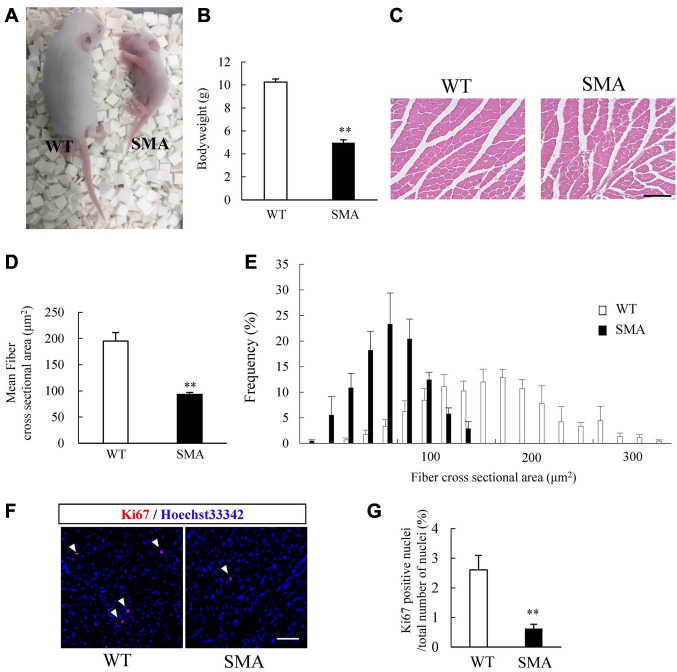
Background/aim: In spinal muscular atrophy (SMA), systemic deficiency of survival motor neurons (SMN) caused by loss or mutation of SMN1 leads to SMA symptoms. SMA was, for a long time, considered as a selective motor-neuron disease. However, accumulated evidence suggests that skeletal muscle cells are affected by low levels of SMN protein. The purpose of this study was to elucidate the function of SMN protein in skeletal cell differentiation and maturation.
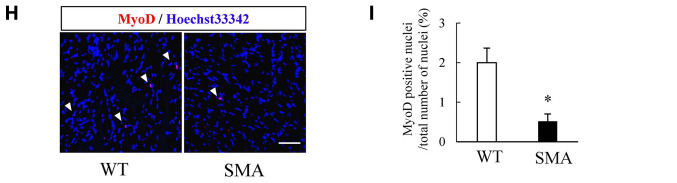
Materials and methods: In SMNΔ7 mice, which exhibit a systemic reduction of SMN protein, muscle atrophy was evaluated. To direct the effect of SMN against muscle cells, SMN functions were examined by knockdown of SMN in mouse myoblasts cell line C2C12 using siRNA.
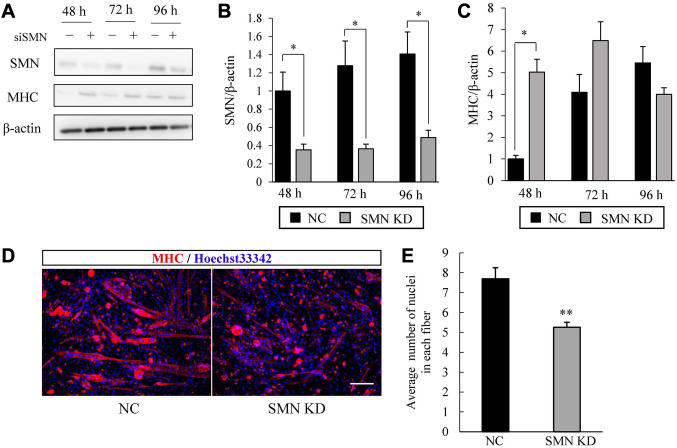
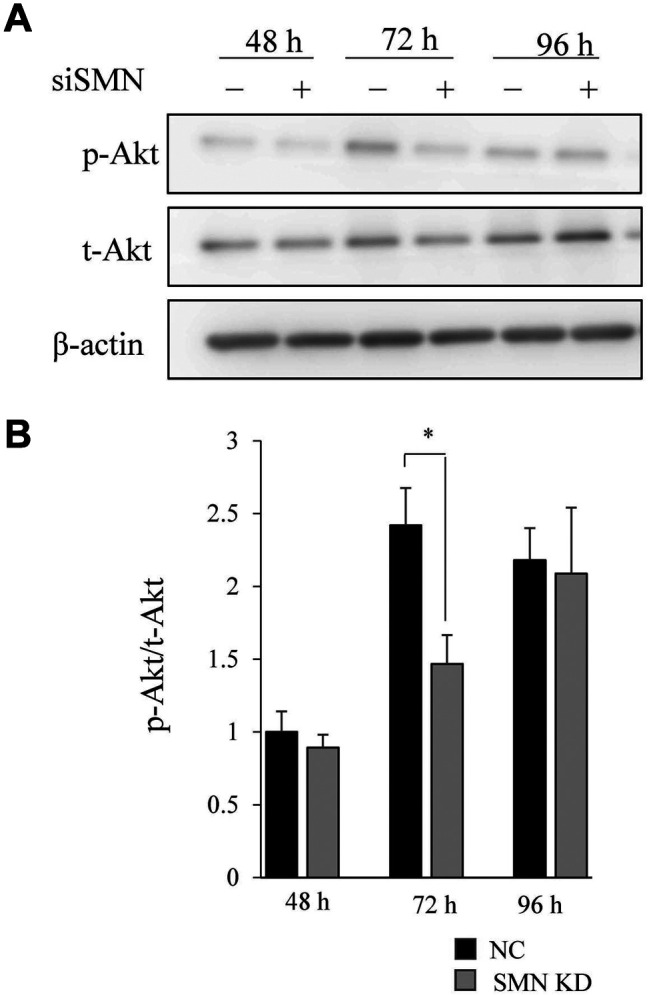
Results: SMNΔ7 mice showed muscle atrophy accompanied by decreased both expression of a myogenesis marker and a proliferating marker. In SMN-knockdown myoblasts, early expression of myosin heavy chain and reduced multinuclear myotube formation were found. Decreased caspase-3 activity and reduced phosphorylation of Akt were observed at an early stage of differentiation in SMN-knockdown myoblasts.
Conclusion: A critical role of SMN protein in muscle cell differentiation via caspase-3 and Akt activation was shown.
Keywords: Myotube formation; skeletal muscles; spinal muscular atrophy; survival motor neurons.
Copyright© 2020, International Institute of Anticancer Research (Dr. George J. Delinasios), All rights reserved.
Conflict of interest statement
The Authors have no conflicts of interest to disclose in regard to this study.
Figures
Similar articles
-
The water extract of Liuwei dihuang possesses multi-protective properties on neurons and muscle tissue against deficiency of survival motor neuron protein.Phytomedicine. 2017 Oct 15;34:97-105. doi: 10.1016/j.phymed.2017.08.018. Epub 2017 Aug 18. Phytomedicine. 2017. PMID: 28899515
-
Loganin possesses neuroprotective properties, restores SMN protein and activates protein synthesis positive regulator Akt/mTOR in experimental models of spinal muscular atrophy.Pharmacol Res. 2016 Sep;111:58-75. doi: 10.1016/j.phrs.2016.05.023. Epub 2016 May 27. Pharmacol Res. 2016. PMID: 27241020
-
Mechanisms of exercise-induced survival motor neuron expression in the skeletal muscle of spinal muscular atrophy-like mice.J Physiol. 2019 Sep;597(18):4757-4778. doi: 10.1113/JP278454. Epub 2019 Aug 22. J Physiol. 2019. PMID: 31361024 Free PMC article.
-
Spinal muscular atrophy and the antiapoptotic role of survival of motor neuron (SMN) protein.Mol Neurobiol. 2013 Apr;47(2):821-32. doi: 10.1007/s12035-013-8399-5. Epub 2013 Jan 13. Mol Neurobiol. 2013. PMID: 23315303 Review.
-
Spinal muscular atrophy: a motor neuron disorder or a multi-organ disease?J Anat. 2014 Jan;224(1):15-28. doi: 10.1111/joa.12083. Epub 2013 Jul 22. J Anat. 2014. PMID: 23876144 Free PMC article. Review.
Cited by
-
SMN promotes mitochondrial metabolic maturation during myogenesis by regulating the MYOD-miRNA axis.Life Sci Alliance. 2023 Jan 5;6(3):e202201457. doi: 10.26508/lsa.202201457. Print 2023 Mar. Life Sci Alliance. 2023. PMID: 36604149 Free PMC article.
-
Transcriptome Analysis in a Primary Human Muscle Cell Differentiation Model for Myotonic Dystrophy Type 1.Int J Mol Sci. 2021 Aug 10;22(16):8607. doi: 10.3390/ijms22168607. Int J Mol Sci. 2021. PMID: 34445314 Free PMC article.
References
-
- Lefebvre S, Burglen L, Reboullet S, Clermont O, Burlet P, Viollet L, Benichou B, Cruaud C, Millasseau P, Zeviani M, Le Paslier D, Frézal J, Cohen D, Weissenbach J, Munnich A, Melki J. Identification and characterization of a spinal muscular atrophy-determining gene. Cell. 1995;80(1):155–165. doi: 10.1016/0092-8674(95)90460-3. - DOI - PubMed
-
- Hahnen E, Forkert R, Marke C, Rudnik-Schoneborn S, Schonling J, Zerres K, Wirth B. Molecular analysis of candidate genes on chromosome 5q13 in autosomal recessive spinal muscular atrophy: Evidence of homozygous deletions of the SMN gene in unaffected individuals. Hum Mol Genet. 1995;4(10):1927–1933. doi: 10.1093/hmg/4.10.1927. - DOI - PubMed
MeSH terms
Substances
LinkOut - more resources
Full Text Sources
Molecular Biology Databases
Research Materials