. 2020 Nov 3;11(1):5549.
doi: 10.1038/s41467-020-19328-1.

Role of specialized composition of SWI/SNF complexes in prostate cancer lineage plasticity

Affiliations

Role of specialized composition of SWI/SNF complexes in prostate cancer lineage plasticity

Joanna Cyrta et al. Nat Commun. .

Abstract

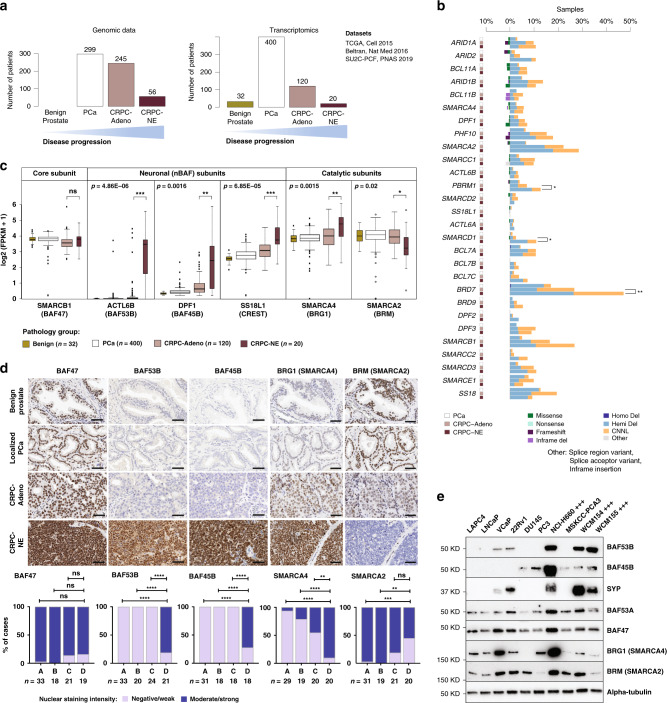
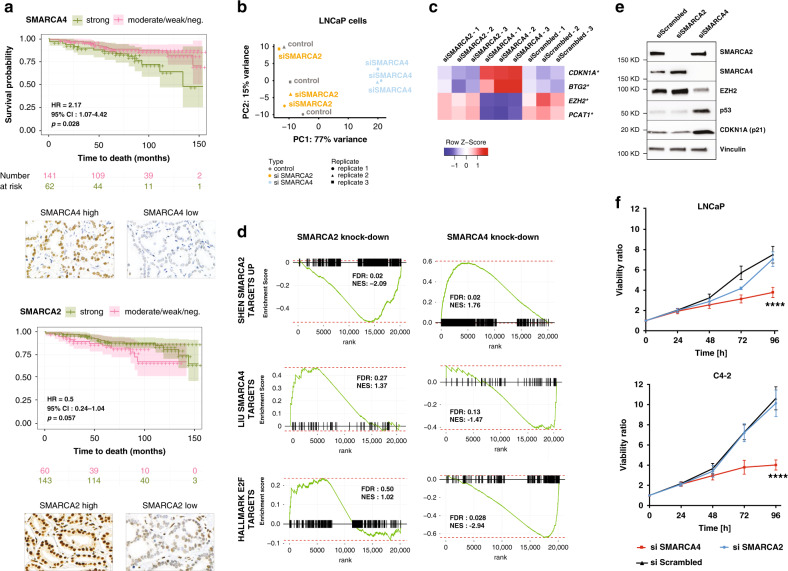
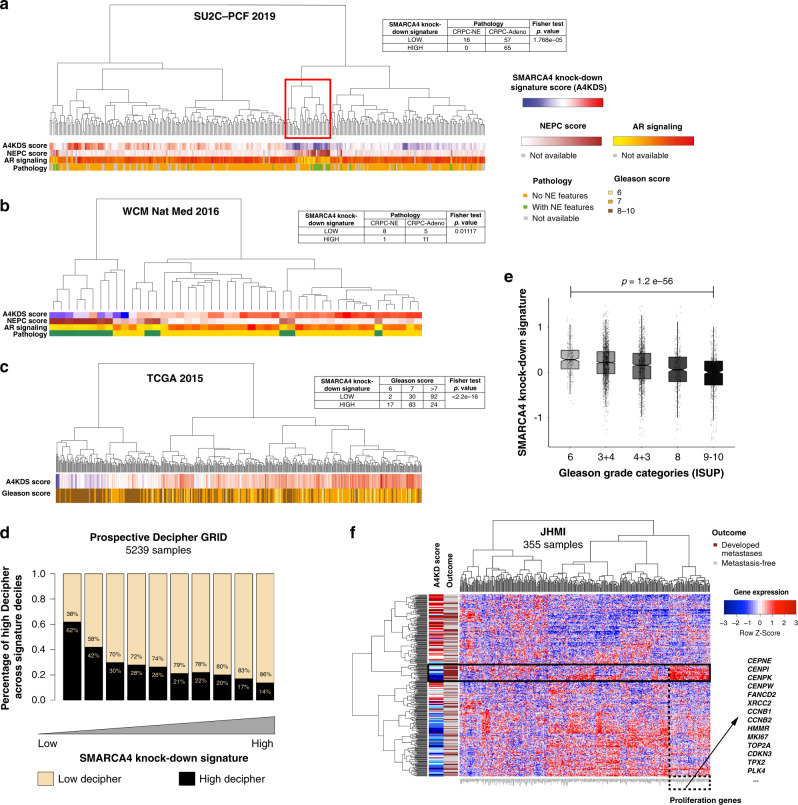
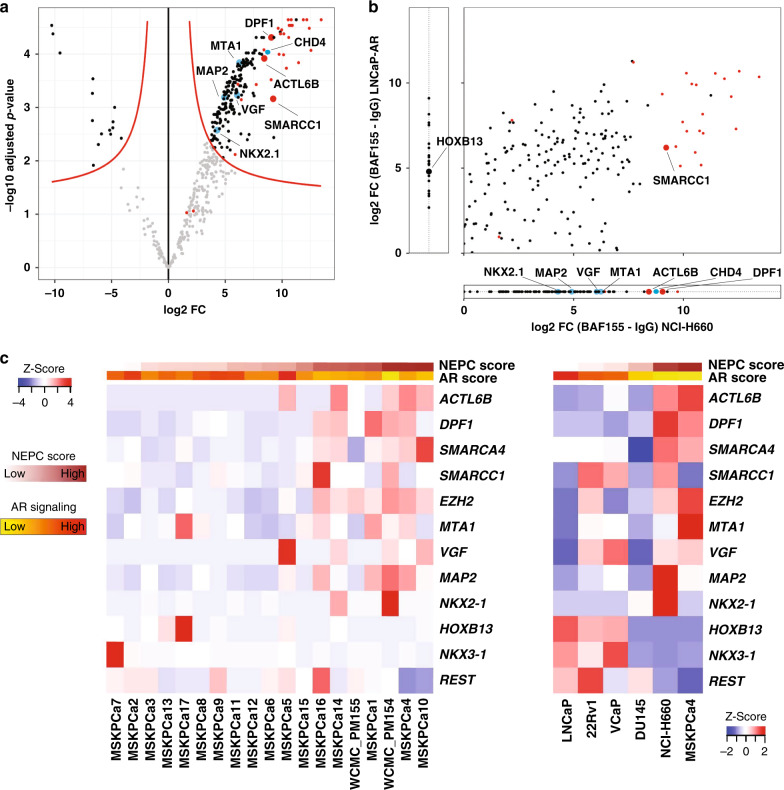
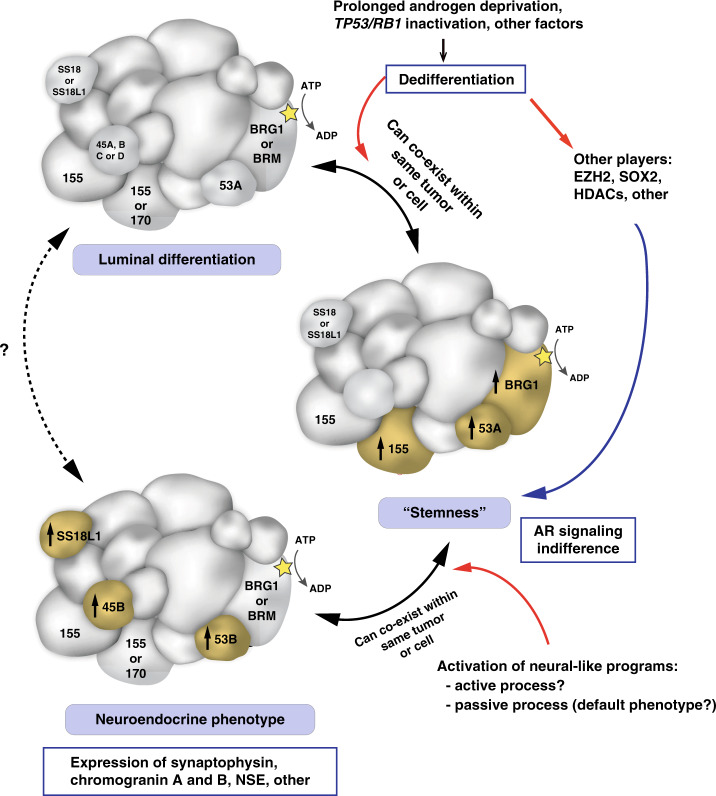
Advanced prostate cancer initially responds to hormonal treatment, but ultimately becomes resistant and requires more potent therapies. One mechanism of resistance observed in around 10-20% of these patients is lineage plasticity, which manifests in a partial or complete small cell or neuroendocrine prostate cancer (NEPC) phenotype. Here, we investigate the role of the mammalian SWI/SNF (mSWI/SNF) chromatin remodeling complex in NEPC. Using large patient datasets, patient-derived organoids and cancer cell lines, we identify mSWI/SNF subunits that are deregulated in NEPC and demonstrate that SMARCA4 (BRG1) overexpression is associated with aggressive disease. We also show that SWI/SNF complexes interact with different lineage-specific factors in NEPC compared to prostate adenocarcinoma. These data point to a role for mSWI/SNF complexes in therapy-related lineage plasticity, which may also be relevant for other solid tumors.


Conflict of interest statement

H.B. has received research funding from Janssen, Astellas, Abbvie, Millennium, and Eli Lilly and consulting with Janssen, Astellas, Sanofi Genzyme, Astra Zeneca, Pfizer. L.P. is now an employee of Loxo Oncology at Lilly. M.A.R. has received research funding from Novartis, Roche, Ventana, Janssen, Astellas, Millennium, and Eli Lilly. M.A.R. is on the SAB of Neogenomics. T.L.L. has received research funding from DeepBio, Decipher, Ventana/Roche. Cornell and Bern Universities have filed a patent application on SWI/SNF diagnostic and therapeutic fields with A.A., J.C., and M.A.R. listed as inventors. The remaining authors declare no competing interests.

Figures

Fig. 1
Fig. 1. Identification of SWI/SNF subunits deregulated in CRPC-NE.
a Summary of the number of patients analyzed by whole exome sequencing (WES) and RNA-seq for each disease state. b WES results for SWI/SNF genes in 600 samples from unique PCa patients. For each gene, three consecutive bars represent alteration frequency in localized hormone treatment-naïve PCa, CRPC-Adeno and CRPC-NE, respectively. c RNA-seq analysis of gene expression levels in 572 unique patient samples from four studies, showing selected genes (ACTL6B: p = 4.86E−06, DPF1: p = 0.0016, SS18L1: p = 6.85E−05, SMARCA4: p = 0.0015, SMARCA2: p = 0.02) significantly deregulated in CRPC-NE. The core subunit SMARCB1 is shown for comparison. The box plots represent the median values and the lower and upper interquartile range (IQR); the upper whisker = min(max(x), Q3 + 1.5 × IQR) and lower whisker = max(min(x), Q1 − 1.5 × IQR), and the outliers are plotted as individual points. d Representative immunostainings against BAF47 (SMARCB1), BAF53B (ACTL6B), BAF45B (DPF1), BRG1 (SMARCA4) and BRM (SMARCA2), and statistical analysis of staining intensity in patient samples. A-benign prostate glands, B-hormone treatment-naïve localized PCa, C-CRPC-Adeno, D-CRPC-NE. **p < 0.01 (p = 0.0057 for BRG1, p = 0.0012 for BRM), ***p < 0.001 (p = 0.0004 for BRM) and ****p < 0.0001, ns indicates not significant (two-sided Fisher’s exact test). Scale bars, 50 μm. e Immunoblot showing expression levels of selected SWI/SNF subunits in PCa cell lines (+++ designates CRPC-NE cell lines). Benign: benign prostatic tissue, PCa: localized hormone treatment-naïve prostate cancer, CRPC-Adeno: Castration resistant prostate cancer, adenocarcinoma subtype, CRPC-NE: Castration resistant prostate cancer, neuroendocrine subtype. Source data are provided in the Source Data file.
Fig. 2
Fig. 2. SWI/SNF SMARCA4 and SMARCA2 expression in prostate cancer.
a Kaplan–Meier curves showing the association between overall survival and SMARCA4 (BRG1) IHC expression (p = 0.028, Log-rank test) or SMARCA2 (BRM) IHC expression (not significant), in 203 patients with localized PCa. b Principal component analysis (PCA) of RNA-seq data for prostate adenocarcinoma (LNCaP) cells 72 h after SMARCA4 or SMARCA2 knock-down. c Expression levels (RNA-seq) of selected genes upon SMARCA4 and SMARCA2 knock-down in LNCaP cells; *FDR < 0.05. d Gene Set Enrichment Analysis based on RNA-seq gene expression analysis in LNCaP cells with SMARCA4 or SMARCA2 knock-down. e Immunoblot showing selected deregulated proteins upon SMARCA4 and SMARCA2 knock-down in LNCaP cells. f Effect of SMARCA4 or SMARCA2 knock-down on cell proliferation of prostatic adenocarcinoma (LNCaP) and CRPC-Adeno (C4-2) cells. N = 3 independent experiments. Data are presented as mean values +/− SEM and analyzed using two-way Anova (****p < 0.0001). Statistical significance was evaluated at 0.05 alpha level with GraphPadPrism, version 8.2.1, Mac. Source data are provided in the Source Data file.
Fig. 3
Fig. 3. Transcriptomic SMARCA4 knock-down signature in PCa cohorts.
a 332 cases of CRPC from the SU2C-PCF cohort (table: n = 138). b 47 cases of CRPC from the WCM cohort (table: n = 25). c 495 cases of localized PCa from the TCGA cohort (table: n = 248); p value = 1.21e−18 (ac represent two-paired tests). d Low SMARCA4 knock-down signature scores are associated with high Decipher scores (surrogate for risk of metastasis) in 5239 primary PCa samples from the Prospective Decipher GRID (Mann–Whitney U test). e Low SMARCA4 knock-down signature scores are associated with higher Gleason score in the same Decipher GRID cohort (Mann–Kendall trend test). The center of each boxplot represents the mean, lower bound represents the 25th percentile, the top bound represents the 75th percentile, the whiskers represent the 95% CI. p value = 1.2e−56. f Unsupervised clustering of patients from in the JHMI natural history PCa cohort (Johns Hopkins Medical Institute, n = 355) based on the downregulated genes from the SMARCA4 knock-down signature, and compared to metastatic outcome (brown: metastatic recurrence, gray: metastasis-free). Overexpression of a subset of genes, many of which are related to proliferation, is seen in a cluster of patients who presented metastatic outcome (black box).
Fig. 4
Fig. 4. SWI/SNF associates with different transcriptional regulators in CRPC-NE and in adenocarcinoma cells.
a Volcano plot showing proteins most significantly represented (upper right) in the co-IP using an anti-BAF155 antibody, as compared to IgG isotype control in NCI-H660 (CRPC-NE) cells (pooled data from 3 co-IP replicates). The x-axis represents log2 fold change (FC) values, the y-axis represents −log10 of adjusted p-values. Each dot represents a protein; red dots represent SWI/SNF members, blue dots indicate notable findings. b A qualitative representation comparing proteins associated with SWI/SNF in NCI-H660 (CRPC-NE) and in LNCaP-AR (adenocarcinoma) cells (averaged data from two co-IP experiments). Plotted are log2 fold change values between BAF155 IP and IgG IP in NCI-H660 cells (x-axis) and in LNCaP-AR cells (y-axis), for proteins present in both cell lines with sufficient evidence in each cell line (i.e., if present in two replicates of at least one condition). Proteins plotted outside of the main field represent proteins that were detected exclusively in one of the cell lines. c Heatmap showing RNA-seq expression (FPKM) of prostate cancer 3D organoids (left) and 2D cell lines (right), ordered by increasing NEPC score.
Fig. 5
Fig. 5. Schematic representation of putative specialized SWI/SNF assemblies in prostate cancer cells.
Hypothetical SWI/SNF assemblies are shown in the context of current knowledge about prostate cancer phenotype plasticity. Subunits of particular interest are annotated with their names. Two names within a subunit indicate possible incorporation of either one of the two paralogs. Subunit sizes are approximately indicative of their molecular weights. 155: BAF155, 170: BAF170, 53A: BAF53A, 53B: BAF53B, 45B: BAF45B, AR: Androgen receptor.

References

    1. Bray F, et al. Global cancer statistics 2018: GLOBOCAN estimates of incidence and mortality worldwide for 36 cancers in 185 countries. CA Cancer J. Clin. 2018;68:394–424. doi: 10.3322/caac.21492. - DOI - PubMed
    1. Rawla P. Epidemiology of prostate cancer. World J. Oncol. 2019;10:63–89. doi: 10.14740/wjon1191. - DOI - PMC - PubMed
    1. Robinson D, et al. Integrative clinical genomics of advanced prostate. Cancer Cell. 2015;162:454. - PubMed
    1. Beltran H, et al. Divergent clonal evolution of castration-resistant neuroendocrine prostate cancer. Nat. Med. 2016;22:298–305. doi: 10.1038/nm.4045. - DOI - PMC - PubMed
    1. Abida, W. et al. Genomic correlates of clinical outcome in advanced prostate cancer. Proc. Natl Acad. Sci. USA 116, 11428–11436 (2019). - PMC - PubMed

Publication types

MeSH terms