. 2020 Nov 3;11(1):5387.
doi: 10.1038/s41467-020-19170-5.

The HUSH complex is a gatekeeper of type I interferon through epigenetic regulation of LINE-1s

Affiliations

The HUSH complex is a gatekeeper of type I interferon through epigenetic regulation of LINE-1s

Hale Tunbak et al. Nat Commun. .

Abstract

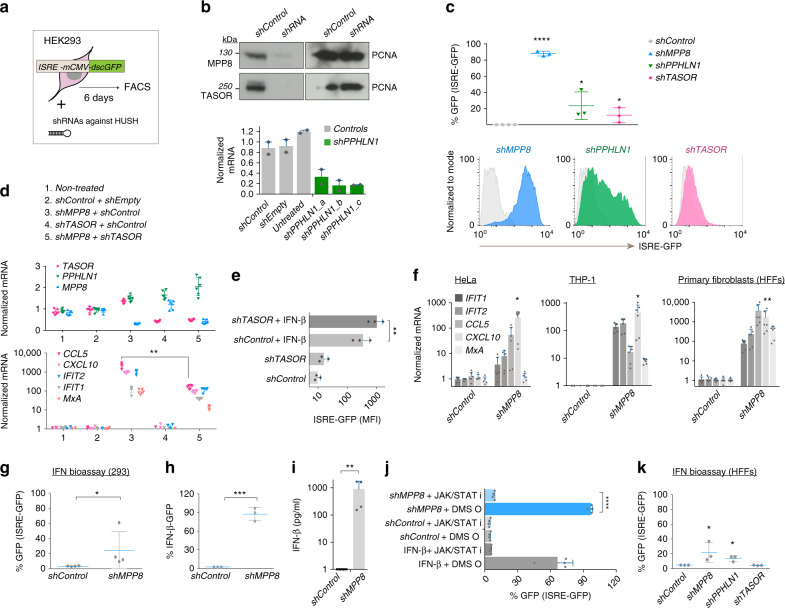
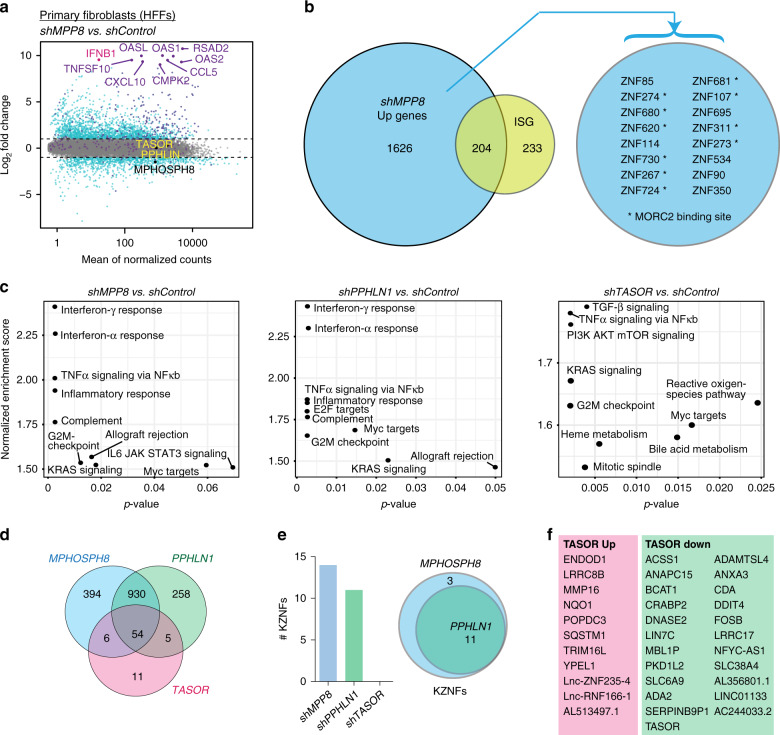
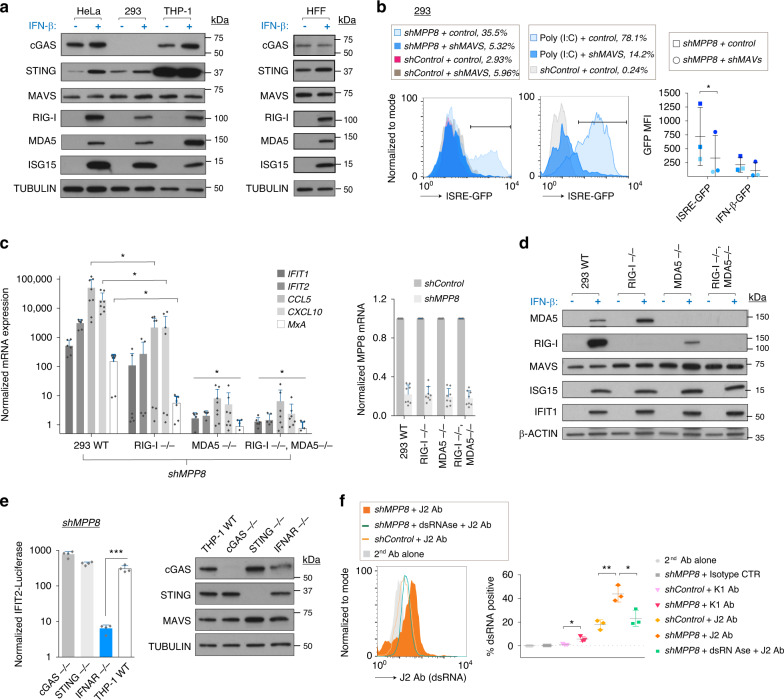
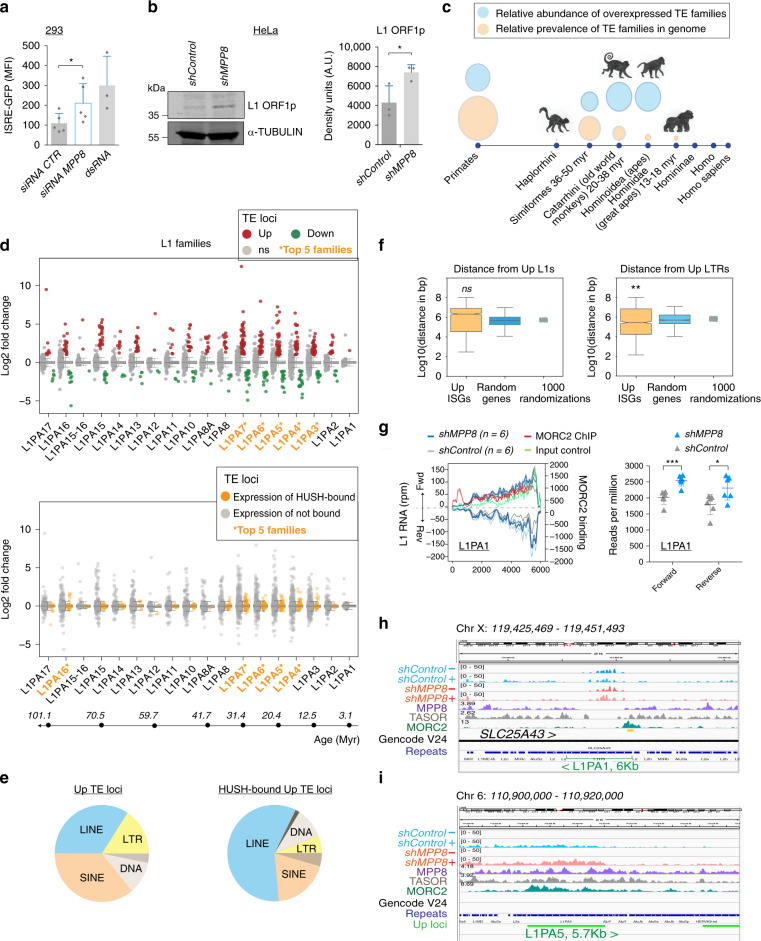
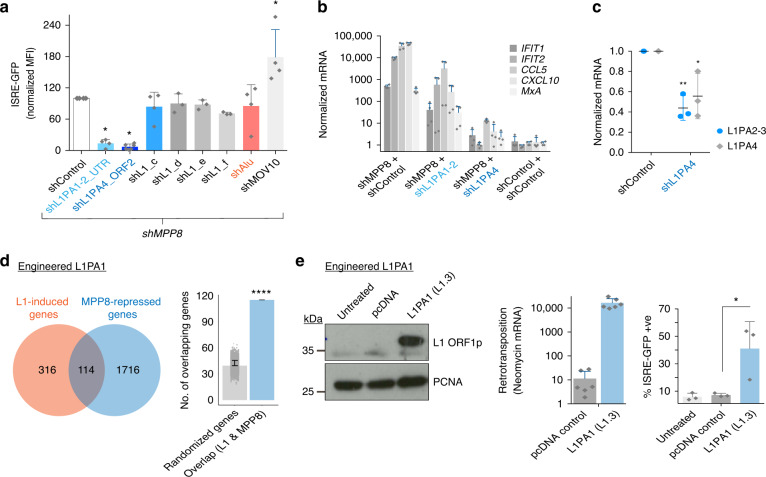
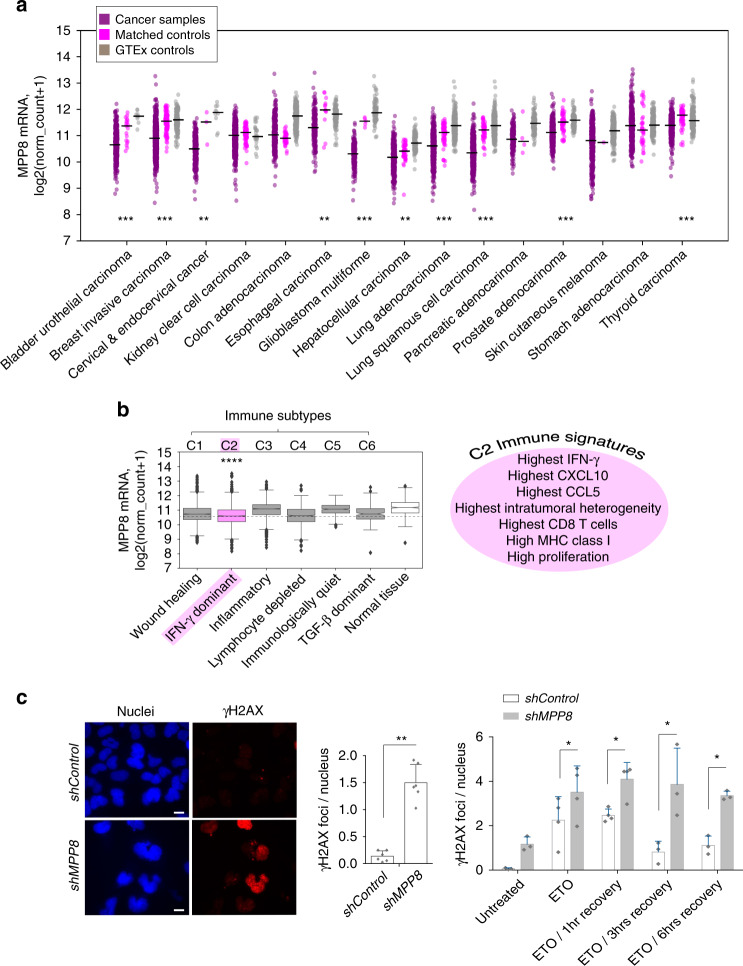
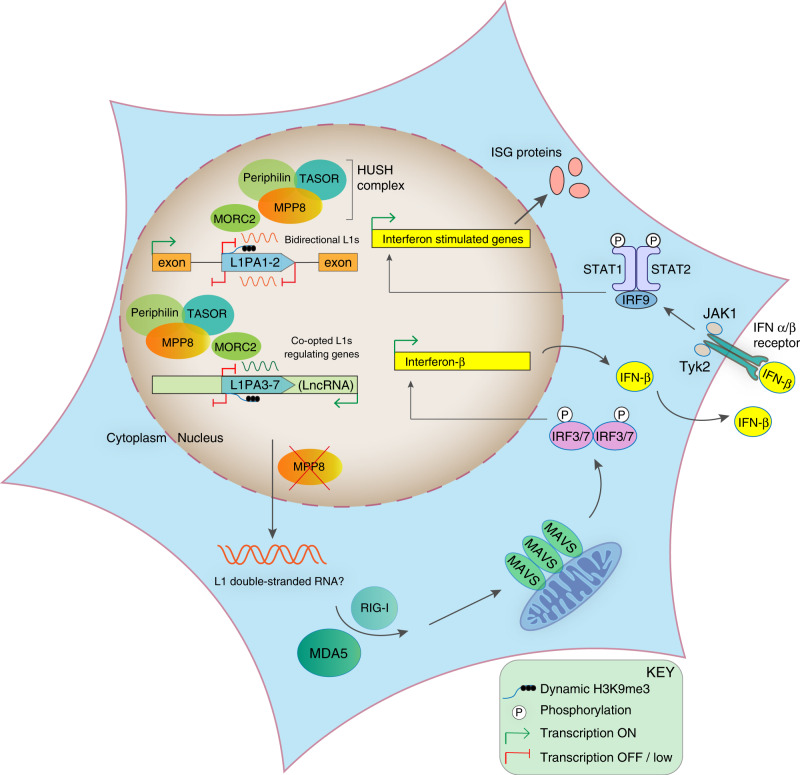
The Human Silencing Hub (HUSH) complex is necessary for epigenetic repression of LINE-1 elements. We show that HUSH-depletion in human cell lines and primary fibroblasts leads to induction of interferon-stimulated genes (ISGs) through JAK/STAT signaling. This effect is mainly attributed to MDA5 and RIG-I sensing of double-stranded RNAs (dsRNAs). This coincides with upregulation of primate-conserved LINE-1s, as well as increased expression of full-length hominid-specific LINE-1s that produce bidirectional RNAs, which may form dsRNA. Notably, LTRs nearby ISGs are derepressed likely rendering these genes more responsive to interferon. LINE-1 shRNAs can abrogate the HUSH-dependent response, while overexpression of an engineered LINE-1 construct activates interferon signaling. Finally, we show that the HUSH component, MPP8 is frequently downregulated in diverse cancers and that its depletion leads to DNA damage. These results suggest that LINE-1s may drive physiological or autoinflammatory responses through dsRNA sensing and gene-regulatory roles and are controlled by the HUSH complex.


Conflict of interest statement

The authors declare no competing interests.

Figures

Fig. 1
Fig. 1. The HUSH complex regulates the type I IFN response.
a Diagram of IFN induction assay: HEK293 cells harbor an integrated IFN reporter expressing destabilized GFP (dscGFP). ISRE: IFN-stimulated response elements; mCMV: minimal CMV promoter. GFP was assessed 6 days post shRNAs. b Western blot and qRT-PCR to assess HUSH depletion day 4 post shRNAs. PPHLN1 mRNA normalized to GAPDH. N = 3 biologically independent samples with technical qRT-PCR duplicates shown. c ISRE-GFP induction 6 days post shRNAs. N = 3 biologically independent experiments. Two-tailed unpaired t tests of shRNAs vs. shControl: p = <0.0001 (shMPP8), p = 0.0372 (shPPHLN1) and p = 0.0466 (TASOR). d shMPP8 was combined with shTASOR or controls as stated. qRT-PCR of endogenous ISG mRNA expression (GAPDH normalized). N = 3 biologically independent experiments with technical duplicates shown. A two-tailed unpaired t test was used to compare shMPP8 + shControl to shMPP8 + shTASOR for CCL5 (p = 0.0021). e shTASOR or shControl-treated cells were treated with IFN-β and ISRE-GFP measured 24 h later. N = 3 biologically independent experiments. P value: 0.0037 (two-tailed paired t test). MFI: mean fluorescent intensity. f QRT-PCR of ISG expression (GAPDH normalization) 6 days post shRNAs (or 3 days in the case of HeLa cells). N = 3 biologically independent experiments with technical duplicates shown. Two-tailed paired t tests were used to compare controls to shMPP8 for CXCL10: p = 0.0473 (HeLa), p = 0.0229 (THP-1s) and p = 0.0084 (HFFs). g IFN bioassay: supernatants from shRNA-treated 293 cells were added to ISRE-GFP reporter 293 cells and GFP expression measured 24 h later. N = 4 biologically independent samples. P = 0.0240 (two-tailed paired t test). h 293 cells containing an IFN-β-destabilized GFP reporter were transduced with the stated shRNAs and GFP measured 6 days later. N = 3 biologically independent samples. P = 0.0005 (two-tailed paired t test). i Supernatants were harvested 6 days post shRNAs and used for an IFN-β ELISA. N = 4 biologically independent samples. P = 0.0023 (two-tailed paired t test). j 293 cells treated with shRNAs in the presence of the JAK/STAT inhibitor Ruxolitinib or DMSO (added from day 1) were harvested for GFP FACS at day 6. N = 4 biologically independent samples. IFN-β  ± Ruxolitinib served as a positive control. P = < 0.0001 (two-tailed unpaired t test). k IFN bioassay: supernatants from shRNA-treated HFFs were added to ISRE-GFP reporter 293 cells and GFP expression measured 24 h later. N = 3 biologically independent samples. Two-tailed paired t test p values: p = 0.0469 (shMPP8), p = 0.0320 (shPPHLN1). All data presented in this figure show mean values ± SD except (b), which depicts mean values ± SEM.
Fig. 2
Fig. 2. The HUSH complex regulates genes involved in inflammation.
Primary fibroblasts (HFFs) were treated with shRNA vectors, and RNA harvested 6 days later for total RNA-sequencing. N = 6 biologically independent experiments. a MA plot showing results of differential expression analysis, where significantly differentially expressed genes (log2 fold change > 1 and a p-adjusted value < 0.05 after Benjamini–Hochberg multiple testing correction of Wald test p-value of shMPP8/shControl) have been highlighted in dark cyan and ISGs are shown in purple. See dataset 1 in Source data for all exact p values. Example upregulated ISGs are labeled as well as HUSH components (of which MPHOSPH8/MPP8 is downregulated). b Venn diagram showing overlap of ISGs (list defined in ref. ) with genes upregulated in MPP8-depleted samples. Upregulated KZNFs are listed. See also Supplementary Fig. 2 for MORC2 binding data using public ChIP data. c Total RNA-seq data were generated for samples depleted for each HUSH component vs. shControls (n = 3 biologically independent experiments and data are represented as gene set enrichment analyses using fgsea, where nominal p-values were calculated for 1000 permutations and corrected for multiple-testing using the Benjamini–Hochberg method). d Venn diagram showing overlap of genes upregulated in each HUSH-depletion. e Comparison of number and overlap of KZNFs upregulated in HUSH-depleted cells. f Significantly differentially-expressed genes unique to TASOR-depleted samples are listed.
Fig. 3
Fig. 3. MPP8-depletion is accompanied by RLR-dependent RNA sensing.
a Western blots on extracts from stated cells treated ± IFN-β for 24 h. N = 2 independent blots with one representative blot shown. b 293 cells were co-transduced with shControl or shMPP8 plus shMAVS or a control vector of the same backbone (hygromycin) and GFP was measured on day 6 (left). MAVS depletion was verified using polyI:C, added 24 h before FACS (middle). Summary data shown for experiments in ISRE-GFP and IFN-β-GFP reporter cells (right, n = 3 biologically independent samples). P = 0.0372 (one-tailed paired t test). MFI: mean fluorescent intensity. c Left: qRT-PCR expression of endogenous ISGs in the stated shRNA-treated 293 cell lines at day 6 (GAPDH normalized). N = 4 biological independent experiments with technical duplicates shown. CCL5 and CXCL10 were measured in all experiments while the other 3 ISGs were measured in 3 of the experiments. One-tailed paired t tests showed expression of all ISGs was significantly lower in MDA5−/− cells and double knockout (DKO) cells than in wildtype (WT) controls. IFIT1: p = 0.0063 (MDA5−/−), p = 0.0026 (DKO); IFIT2: 0.0007 (MDA5−/−), 0.0019 (DKO); CCL5: 0.0002 (MDA5−/−), 0.0028 (DKO); CXCL10: 0.0001 (MDA5−/−), 0.0007 (DKO); MxA: 0.0427 (MDA5−/−), 0.0423 (DKO). Expression of CCL5, CXCL10, and MxA was significantly decreased in RIG-I−/− cells compared to controls. CCL5: p = 0.0183; CXCL10: p = 0.0372; MxA: p = 0.0139. Right: MPP8 depletion efficiency summary (n = 4 biologically independent experiments with technical duplicates shown. d Western blots on extracts from cell lines from c treated ± IFN-β for 24 h. N = 2 independent blots with one representative blot shown. e Left: stated knockout or control (WT) THP-1 reporter cell lines were treated with shRNAs and assayed for secreted Lucia luciferase (driven by IFIT-2) 6 days later. N = 4 biologically independent experiments. Luciferase readings were normalized to background values in shControl-treated cells. P = 0.0003 (one-tailed paired t test). Right: western blots on extracts from stated cells. N = 3 independent blots with one representative blot shown. f 293 cells were treated with shRNAs and fixed 6 days later for intracellular staining with dsRNA antibodies, J2/K1 or control antibodies. N = 3 biologically independent samples. Two-tailed unpaired t test p values = 0.0166 (shMPP8 vs. shControl for K1 Ab); 0.0048 (shMPP8 vs. shControl for J2 Ab); 0.0212 (shMPP8 + J2 Ab ± dsRNase). All data presented in this figure show mean values ± SD.
Fig. 4
Fig. 4. MPP8-depletion results in overexpression of LINE-1s and LTRs.
a ISRE-GFP reporter 293 cells were transfected with control (CTR) or MPP8 siRNAs or dsRNA as a positive control and GFP measured on day 6. N = 5 biologically independent samples or N = 3 for the positive control. P = 0.0108 (two-tailed paired t test). Data show mean  ± SD. MFI: mean fluorescent intensity. b Left: HeLa cells were harvested 4 days post shRNAs and used for western blot for L1 ORF1 protein and alpha-Tubulin. Right: western quantification. N = 3 biologically independent samples. P = 0.0426 (one-tailed paired t test). Data show mean ± SD. c Bubble plots showing the relative prevalence of all TEs in the genome by clade (orange) and relative abundance of overexpressed TE families in shMPP8 samples compared to controls (blue) using RNA-seq data from Fig. 2 and the software TEtranscripts. See Supplementary Fig. 4a for complete diagram. Monkey images drawn by lab members. d Upper panel: TE loci up or downregulated in MPP8-depleted cells (log2 fold change >1, and p adjusted values <0.05 after Benjamini–Hochberg multiple testing correction of Wald test p-value of shMPP8/shControl from DESeq2). See dataset 3 in Source data for all exact p values. Results are shown for loci within the stated LINE-1 families. Ns = expression not significantly changed. Lower panel: strip plot showing HUSH-bound (orange) vs. not known to be bound (gray) LINE-1 loci with their relative expression in shMPP8 samples compared to controls. HUSH peaks defined using epic2, see Supplementary Fig. 3a, using data from ref. . The approximate ages of these LINE-1 families are given underneath using. See Supplementary Fig. 4b for LTR data. The subfamily names with the highest number of upregulated loci (top) or bound loci (bottom) are highlighted in orange. Boxes represent 1st and 3rd quartile, where the central line corresponds to the median; whiskers are ×1.5 of the interquartile range. e Pie charts showing upregulated TE loci (left) and HUSH-bound TE loci (right) classified by family. f Median distance of Upregulated L1s (n = 1494) or LTRs (n = 1177) to transcription start sites of upregulated ISGs (n = 204) compared to the same number of random genes or to the median distance across 1000 randomizations. The median distance for LTRs is significantly closer than randomized genes (p = 0.001, where a one-sided p value was calculated as (1+ no. of randomizations with a median greater than the observed value)/1000 randomizations). Boxplots as in (d) where notches indicate the confidence interval. g Left: the L1PA1 consensus sequence (repBase) was mapped with RNA-seq reads in both strands (left y axis) or with MORC2 ChIP and total input reads from public data (right y axis). Right: The number of RNA-seq reads mapping forward or reverse strands of the L1PA1 consensus sequence were plotted for all samples. Two-tailed unpaired t test values: p = 0.0006 (forward) and p = 0.0291 (reverse). Data show mean ± SD. h Bigwig visualization of example HUSH-bound young LINE-1 expressed bidirectionally and a HUSH-sensitive primate-conserved LINE-1 expressed in sense (i). RNA-seq track scales were all set at 50 and normalized tracks of HUSH-binding were made using data from ref. .
Fig. 5
Fig. 5. LINE-1s regulate the type I IFN response.
a 293 reporter cells were shControl/shMPP8 treated together with the stated shRNAs against TE families or shControl again. GFP MFI (mean fluorescence intensity) at day 6 was normalized to the shMPP8 + shControl sample that was set at 100%. N = 4 biologically independent samples, except for shL1_d-f, where n = 3 and shL1PA4, where n = 6. The control was significantly different to the shL1PA1 group (p = 0.0172), the shL1PA4 group (0.0110) and the MOV10 group (p = 0.0265) (two-tailed paired t tests). b Groups were setup as in (a) but here endogenous ISG expression was measured by qRT-PCR. N = 2 biologically independent experiments with technical duplicates shown. c Knockdown efficiency was verified by qRT-PCR using global LINE-1 primers. N = 3 biologically independent experiments. A decrease in global LINE-1 expression was detectable for shL1PA4: p = 0.0013 (L1PA2-3) and p = 0.0268 (L1PA4) (two-tailed unpaired t tests). d Venn diagram showing overlap of genes induced by overexpression of an engineered L1PA1 reporter in RPE cells from ref. (a Tet-inducible codon-optimised L1PA1 vs. Luciferase control that was induced for 3 days) and genes upregulated upon MPP8-depletion here. Of 114 genes that overlap, 49 are ISGs. Right: significance was assessed by selecting 10,000 randomizations of the same number (1830) of random genes and looking at the mean number that are shared with the L1-induced genes. P = 5.1203e−24 (hypergeometric test). e 293 reporter cells transfected with a pcDNA control or engineered L1PA1 reporter plasmid (ksCMV-101: L1PA1 subtype L1.3). Transfection and retrotransposition verified by western blot and qRT-PCR for spliced Neomycin expression at day 4 (left and middle). N = 3 biologically independent experiments with technical duplicates shown. Right: IFN reporter induction was measured by GFP FACS. N = 3 biologically independent experiments. P = 0.0332 (one-tailed paired t test). All data presented in this figure show mean values ± SD.
Fig. 6
Fig. 6. MPP8 is frequently downregulated in cancers.
a Using The Cancer Genome Atlas (TCGA) data, we selected cancers for which there were matched control samples as well as GTEx expression data from the same tissue. MPP8 is scored here as significantly downregulated when levels are lower in the cancer compared to both controls separately, using a two-sided Mann–Whitney rank test and correcting for multiple testing (p adjusted values were all <0.05 for groups marked with asterisks). Adjusted p values for matched control comparisons and GTEx comparisons respectively are given here: bladder urothelial = 2.40e−05, 1.58e−06; breast invasive = 5.40e−35, 8.79e−61; cervical & endocervica l= 3.12e−03, 2.37e−07; esophageal = 1.07e−03, 4.0e−15; glioblastoma = 2.10e−08, 6.61e−40; liver hepatocellular = 1.31e−03, 5.57e−31; lung adeno = 1.19e−11, 9.56e−82; lung squamous cell = 2.40e−26, 1.41e−97; prostate adeno = 2.06e−11, 8.27e−31; thyroid = 1.25e−10, 9.24e−17. b Left: all cancers were divided by immune subtype based on ref. and levels of MPP8 expression were plotted. MPP8 levels were most significantly different in subtype C2 compared to normal tissue (after pairwise, two-sided t tests between each immune subtype and normal tissue with an fdr multiple test correction: padj = 8.03e−94; C1 n = 2,066, C2 n = 2413, C3 n = 2334, C4 n = 1129, C5 n = 378, C6 n = 180 samples). Boxes represent 1st and 3rd quartile and the central line is the median. Notches indicate the confidence interval; whiskers correspond to 1.5 of the interquartile range and outliers are depicted as diamonds. Right: features of cancers within immune subtype C2 are displayed (terms from ref. ). c 293 reporter cells were treated with shRNAs and then either untreated or treated with etoposide (ETO) for 30 min and allowed to recover for stated times before γH2AX staining. Left: example γH2AX staining images. Middle: summary data of γH2AX foci: N = 6 biologically independent samples. p = 0.0013 (two-tailed paired t test). Right: summary data of recovery assay. N = 4 biologically independent samples, except for the groups, ETO and ETO/1 h, where N = 3. Two-tailed paired t test p values = 0.0303 (ETO) 0.0486 (ETO/1 h) 0.0384 (ETO/3 h) and 0.0258 (ETO/6 h). Data show the mean  ± SD. See Supplementary Fig. 6e for HeLa data.
Fig. 7
Fig. 7. Proposed model.
Inactivation of the HUSH component MPP8 leads to increased expression of bidirectionally-transcribed full-length young LINE-1s (L1PA1 and L1PA2), as well as primate-conserved LINE-1s with potential co-opted roles in gene regulation, (some enriched in long non-coding RNAs). Nucleic acid sensing ensues through dsRNA sensors MDA5 and RIG-I, leading to MAVS signaling and activation and secretion of type I IFNs. IFN-α/β then act on the same cells or bystander cells to mediate induction of IFN-stimulated genes through JAK-STAT signaling. MPP8-depletion is also accompanied by DNA damage and is a factor commonly downregulated in cancers, where its decreased mRNA expression is associated with a dominant IFN immune subtype signature.

References

    1. Platt RN, II, Vandewege MW, Ray DA. Mammalian transposable elements and their impacts on genome evolution. Chromosome Res. 2018;26:25–43. doi: 10.1007/s10577-017-9570-z. - DOI - PMC - PubMed
    1. de Koning AP, Gu W, Castoe TA, Batzer MA, Pollock DD. Repetitive elements may comprise over two-thirds of the human genome. PLoS Genet. 2011;7:e1002384. doi: 10.1371/journal.pgen.1002384. - DOI - PMC - PubMed
    1. Frank JA, Feschotte C. Co-option of endogenous viral sequences for host cell function. Curr. Opin. Virol. 2017;25:81–89. doi: 10.1016/j.coviro.2017.07.021. - DOI - PMC - PubMed
    1. Bulut-Karslioglu A, et al. Suv39h-dependent H3K9me3 marks intact retrotransposons and silences LINE elements in mouse embryonic stem cells. Mol. Cell. 2014;55:277–290. doi: 10.1016/j.molcel.2014.05.029. - DOI - PubMed
    1. Castro-Diaz N, et al. Evolutionally dynamic L1 regulation in embryonic stem cells. Genes Dev. 2014;28:1397–1409. doi: 10.1101/gad.241661.114. - DOI - PMC - PubMed

Publication types

MeSH terms