. 2020 Nov 3;10(1):18909.
doi: 10.1038/s41598-020-75848-2.

Explaining among-country variation in COVID-19 case fatality rate

Affiliations

Explaining among-country variation in COVID-19 case fatality rate

Gabriele Sorci et al. Sci Rep. .

Abstract

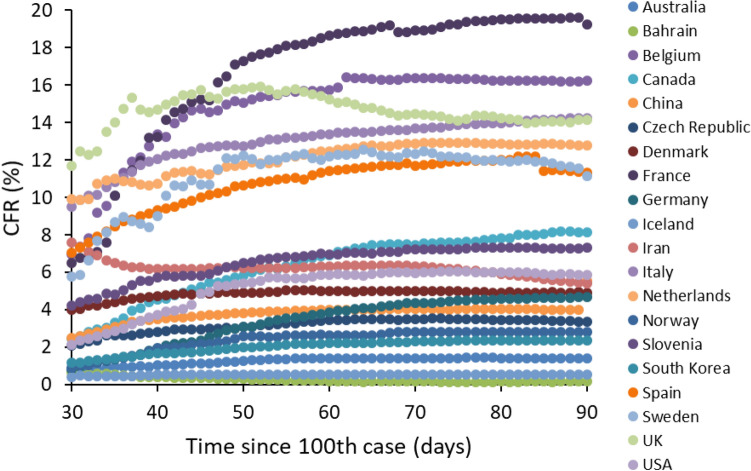
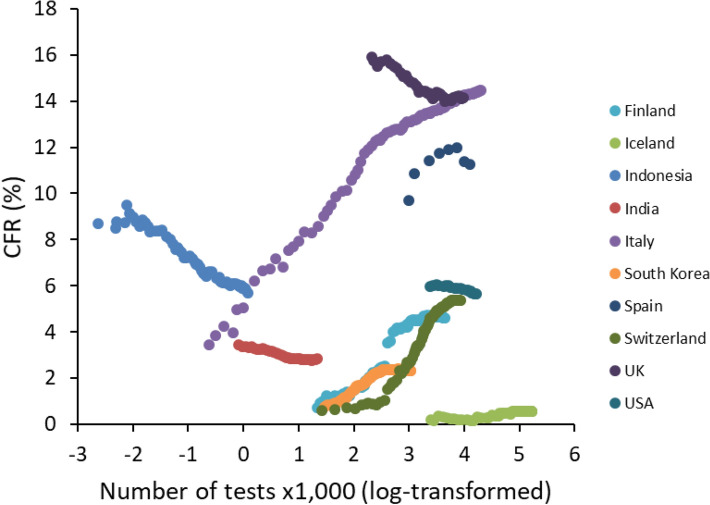
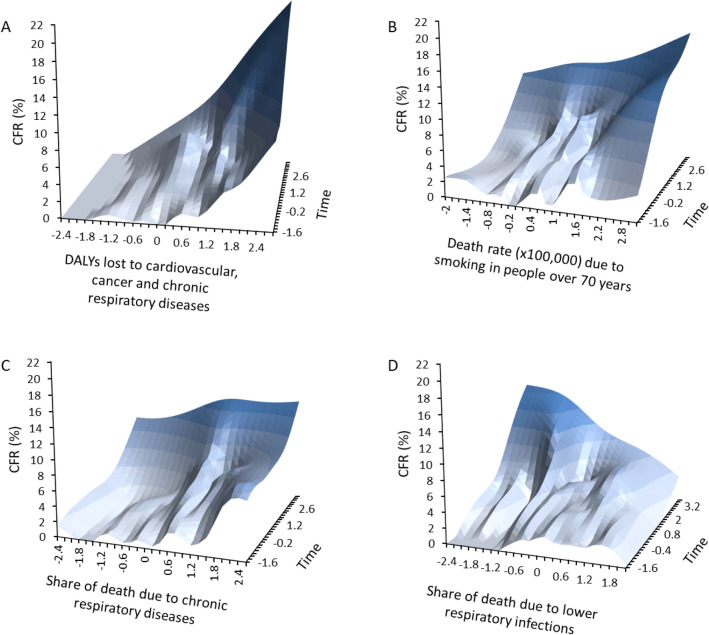
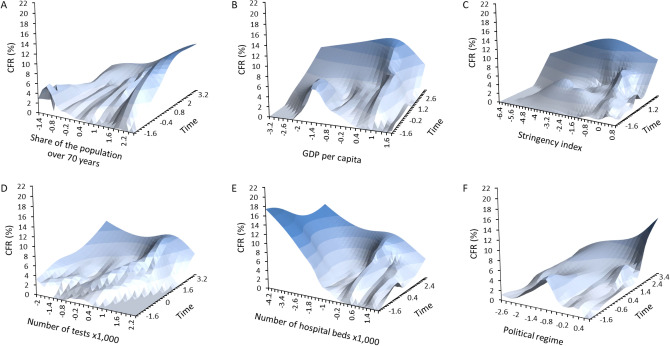
While the epidemic of SARS-CoV-2 has spread worldwide, there is much concern over the mortality rate that the infection induces. Available data suggest that COVID-19 case fatality rate had varied temporally (as the epidemic has progressed) and spatially (among countries). Here, we attempted to identify key factors possibly explaining the variability in case fatality rate across countries. We used data on the temporal trajectory of case fatality rate provided by the European Center for Disease Prevention and Control, and country-specific data on different metrics describing the incidence of known comorbidity factors associated with an increased risk of COVID-19 mortality at the individual level. We also compiled data on demography, economy and political regimes for each country. We found that temporal trajectories of case fatality rate greatly vary among countries. We found several factors associated with temporal changes in case fatality rate both among variables describing comorbidity risk and demographic, economic and political variables. In particular, countries with the highest values of DALYs lost to cardiovascular, cancer and chronic respiratory diseases had the highest values of COVID-19 CFR. CFR was also positively associated with the death rate due to smoking in people over 70 years. Interestingly, CFR was negatively associated with share of death due to lower respiratory infections. Among the demographic, economic and political variables, CFR was positively associated with share of the population over 70, GDP per capita, and level of democracy, while it was negatively associated with number of hospital beds ×1000. Overall, these results emphasize the role of comorbidity and socio-economic factors as possible drivers of COVID-19 case fatality rate at the population level.


Conflict of interest statement

The authors declare no competing interests.

Figures

Figure 1
Figure 1
Time-dependent variation in COVID-19 case fatality rate (CFR) among countries. Time refers to the period between 30 and 90 days post 100th case. For illustrative reasons, only 20 countries are reported here.
Figure 2
Figure 2
Changes in COVID-19 CFR as a function of the number of tests performed (×1000). For illustrative reasons, we report some representative countries showing how the relationship between CFR and number of tests can vary from negative to positive.
Figure 3
Figure 3
Time-dependent variation in COVID-19 case fatality rate (CFR) according to comorbidity factors. Time refers to the number of days between the date of occurrence of 1 death ×1,000,000 and June 11th 2020. (A) DALYs lost to cardiovascular, cancer and chronic respiratory diseases; (B) death rate (×100,000) due to smoking in people over 70 years; (C) share of death due to chronic respiratory diseases; (D) share of death due to lower respiratory infections. The surfaces were generated using a smoothed spline interpolation on the predicted values of the LMMs described in the text. Darker colors indicated higher values of CFR. X- and Y-axis are standardized values, allowing to have similarly scaled axis.
Figure 4
Figure 4
Time-dependent variation in COVID-19 case fatality rate (CFR) according to socio-economic factors. Time refers to the number of days between the date of occurrence of 1 death ×1,000,000 and June 11th 2020. (A) share of the population over 70 years; (B) GDP per capita; (C) stringency index; (D) number of tests ×1000; (E) number of hospital beds ×1000; (F) political regime. The surfaces were generated using a smoothed spline interpolation on the predicted values of the LMMs described in the text. Darker colors indicated higher values of CFR. X- and Y-axis are standardized values, allowing to have similarly scaled axis.

References

    1. Zhu N, Zhang D, Wang W, et al. A novel coronavirus from patients with pneumonia in China, 2019. N. Engl. J. Med. 2020;382:727–733. doi: 10.1056/NEJMoa2001017. - DOI - PMC - PubMed
    1. Zhou P, Yang X-L, Wang X-G, et al. A pneumonia outbreak associated with a new coronavirus of probable bat origin. Nature. 2020 doi: 10.1038/s41586-020-2012-7. - DOI - PMC - PubMed
    1. WHO Director-General's opening remarks at the media briefing on COVID-19—11 March 2020. https://www.who.int/dg/speeches/detail/who-director-general-s-opening-re....
    1. Wu Z, McGoogan JM. Characteristics of and important lessons from the coronavirus disease 2019 (COVID-19) outbreak in China. Summary of a report of 72314 cases from the Chinese center for disease control and prevention. JAMA. 2020;323:1239–1242. doi: 10.1001/jama.2020.2648. - DOI - PubMed
    1. Wang D, Hu B, Hu C, et al. Clinical characteristics of 138 hospitalized patients with 2019 novel coronavirus-infected pneumonia in Wuhan, China. JAMA. 2020;323:1061–1069. doi: 10.1001/jama.2020.1585. - DOI - PMC - PubMed