. 2020 Nov 3;10(1):18921.
doi: 10.1038/s41598-020-75751-w.

Intestinal miRNAs regulated in response to dietary lipids

Affiliations

Intestinal miRNAs regulated in response to dietary lipids

Judit Gil-Zamorano et al. Sci Rep. .

Abstract

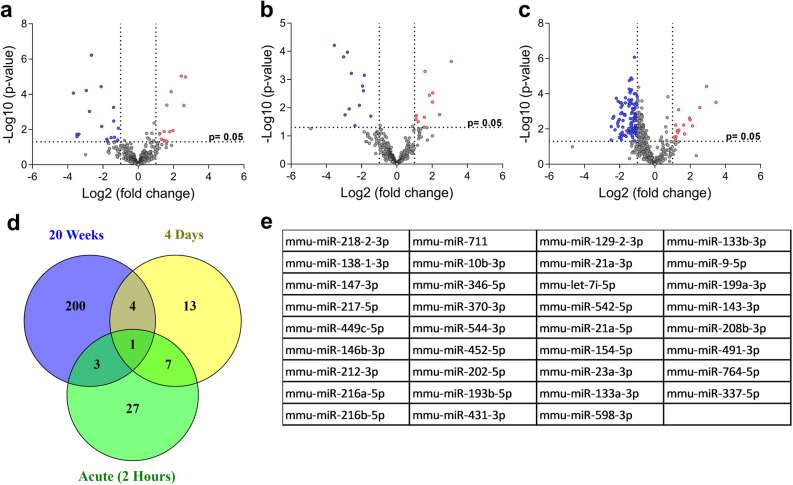
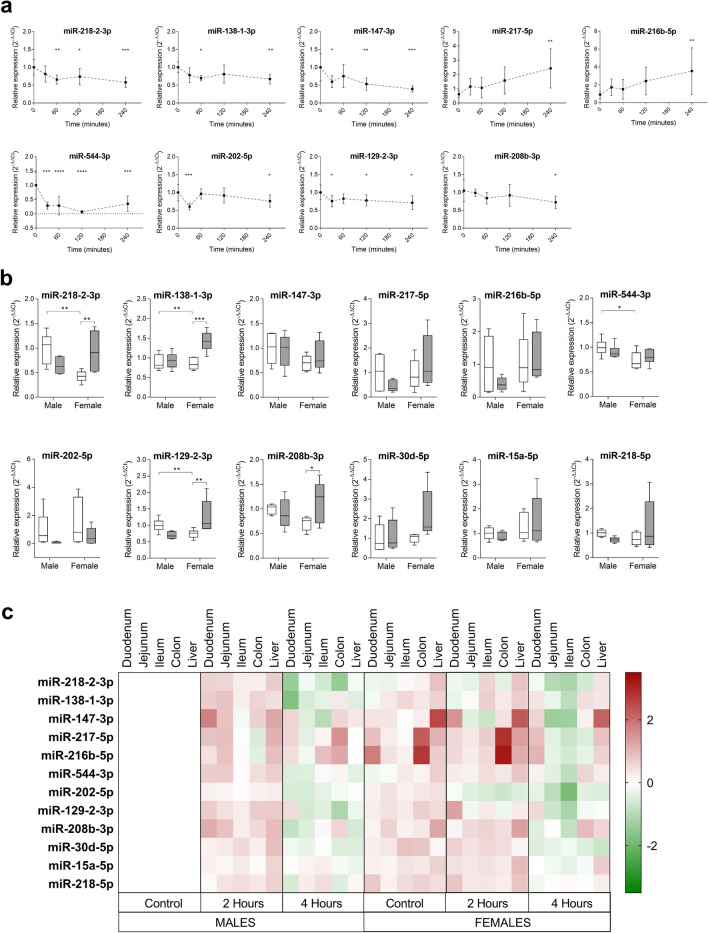
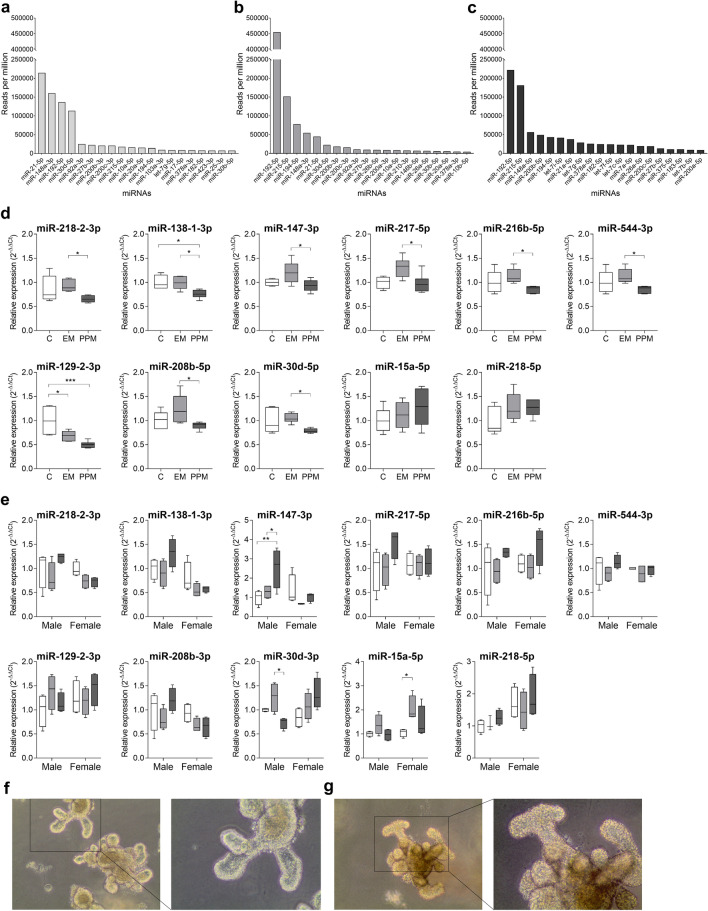
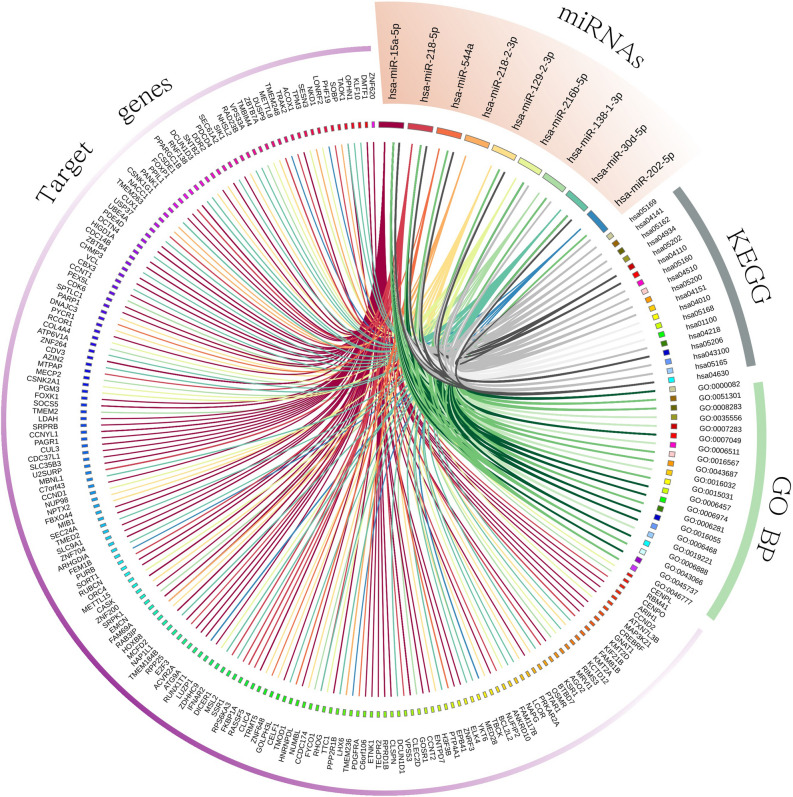
The role of miRNAs in intestinal lipid metabolism is poorly described. The small intestine is constantly exposed to high amounts of dietary lipids, and it is under conditions of stress that the functions of miRNAs become especially pronounced. Approaches consisting in either a chronic exposure to cholesterol and triglyceride rich diets (for several days or weeks) or an acute lipid challenge were employed in the search for intestinal miRNAs with a potential role in lipid metabolism regulation. According to our results, changes in miRNA expression in response to fat ingestion are dependent on factors such as time upon exposure, gender and small intestine section. Classic and recent intestinal in vitro models (i.e. differentiated Caco-2 cells and murine organoids) partially mirror miRNA modulation in response to lipid challenges in vivo. Moreover, intestinal miRNAs might play a role in triglyceride absorption and produce changes in lipid accumulation in intestinal tissues as seen in a generated intestinal Dicer1-deletion murine model. Overall, despite some variability between the different experimental cohorts and in vitro models, results show that some miRNAs analysed here are modulated in response to dietary lipids, hence likely to participate in the regulation of lipid metabolism, and call for further research.


Conflict of interest statement

The authors declare no competing interests.

Figures

Figure 1
Figure 1
Differentially expressed miRNAs found (a) 2 h after an oral administration of a cholesterol-enriched (40 mg) olive oil (250 µL) solution (acute), (b) 4 days after the consumption of a high-fat diet (HFD), and (c) 20 weeks after HFD, in the small intestine (whole) of male C57BL/6 mice (n ≥ 4 per group). Up- and down-regulated miRNAs are shown as red and blue dots, respectively. (d) Venn diagram represents the number of common differently expressed miRNAs in acute, 4 days and 20 weeks studies. mmu-miR-218-2-3p was common among the three studies; mmu-miR-147-3p, -138-1-3p, -1894-3p and -666-3p were common between the two chronic consumption studies; mmu-miR-449c-5p, -1894‐5p and ‐217‐5p were shared by the 20 weeks and acute experiments; mmu‐miR‐879‐3p, ‐711, ‐146b‐3p, ‐216b‐5p, ‐212‐3p, ‐216a‐5p and ‐291a-5p were common to the 4 days and acute studies. (e) List of 35 miRNAs selected for further validation.
Figure 2
Figure 2
(a) Time-course (30, 60, 120 and 240 min) expression of miRNAs showing significant differences in response to an oral lipid challenge in male C57BL/6 mice. Data are shown as mean ± SD; n ≥ 7. *p < 0.05, **p < 0.001, ***p < 0.0001, compared with t = 0 (control). (b) Relative expression of miRNAs determined 2 h after an oral lipid challenge given orally to male and female wild-type mice (grey), compared to controls (white); n ≥ 10 per group. Two-way ANOVA was followed by Bonferroni’s post-hoc tests for multiple comparisons. *p < 0.05, **p < 0.01, ***p < 0.001. (c) Heatmap of differentially expressed intestinal and hepatic miRNAs 2 and 4 h after an oral lipid challenge compared to controls (male mice); n ≥ 8 per group. Up- and down-regulated miRNAs compared to controls are represented in red and green, respectively.
Figure 3
Figure 3
The twenty most abundant miRNAs, represented as reads per million, found in undifferentiated (a) and differentiated (b) Caco-2 cells, and in enteroids (isolated from male and female C57BL/6 mice) exposed to postprandial micelles (PPM) for 24 h (c). (d) Relative expression levels of selected miRNAs in differentiated Caco-2 cells exposed to DMEM (controls), empty micelles (EM) or PPM, for 24 h; n = 6 per group. One-way ANOVA was followed by Bonferroni’s post-hoc tests for multiple comparisons. *p < 0.05, **p < 0.01, ***p < 0.001. (e) Relative expression of selected miRNAs in intestinal organoids exposed to DMEM (controls; white), EM (grey) or PPM (dark grey), for 24 h; n = 4 per group. Two-way ANOVA was followed by Bonferroni’s post-hoc tests for multiple comparisons. *p < 0.05, **p < 0.01. (f,g) Light microscope representative images of mature enteroids treated with empty (f) or post-prandial (g) micelles (for each case, image on the left (10 ×) is zoomed on the right (20 ×)).
Figure 4
Figure 4
CIRCOS graphical representation of relationships among each selected miRNA with their validated target genes and the pathways involved. Different color lines relate each miRNA to genes for which there is an experimentally validated interaction. Lines between each pathway (green for KEGG and grey for GO pathways) and a miRNA imply a relationship based on the latter target genes. The different colour gradation in the pathway lines (green and grey for KEGG and GO, respectively) indicate the adjusted p-value: dark (p-value < 0.05), medium (p-value 0.05–0.01) and light (p-value > 0.01).
Figure 5
Figure 5
(a) Males (squares) and females (circles) weight (g) for WT (Dicer1loxP/loxP, Vil-cre(−)) and KO (Dicer1loxP/loxP, Vil-cre(+)) mice; n ≥ 15 per group. Corresponding means and SD bars are shown for each group. Two-way ANOVA was followed by Bonferroni’s post-hoc tests for multiple comparisons. *p < 0.05, **p < 0.01, ***p < 0.001, ****p < 0.0001. (b) Plasma triglycerides and cholesterol levels 2 h after an oral administration of a cholesterol-enriched olive oil solution (grey), compared to controls (water; white); n ≥ 10 per group. Data are represented as mean ± SD. Two-way ANOVA was followed by Bonferroni’s post-hoc tests for multiple comparisons. p < 0.05, **p < 0.01, ***p < 0.001, ****p < 0.0001. (c) Plasma cholesterol (red) and triglycerides (blue) FPLC profile in WT and Dicer1 KO mice submitted to an oral lipid challenge or water (controls), n = 4 per group.
Figure 6
Figure 6
Intestinal and hepatic triglyceride (a) and cholesterol (b) levels (mg/g) found in WT (Dicer1loxP/loxP, Vil-cre(−)) and KO (Dicer1loxP/loxP, Vil-cre(+)) mice, 2 and 4 h after the administration of cholesterol-enriched olive oil (black) or water (grey); n ≥ 9. Data are represented as mean ± SD. Two-way ANOVA was followed by Bonferroni’s post-hoc tests for multiple comparisons. *p < 0.05, **p < 0.01, ***p < 0.001, ****p < 0.0001.

References

    1. Abumrad NA, Davidson NO. Role of the gut in lipid homeostasis. Physiol. Rev. 2012;92:1061–1085. doi: 10.1152/physrev.00019.2011. - DOI - PMC - PubMed
    1. Dash S, Xiao C, Morgantini C, Lewis GF. New insights into the regulation of chylomicron production. Annu. Rev. Nutr. 2015;35:265–294. doi: 10.1146/annurev-nutr-071714-034338. - DOI - PubMed
    1. Xiao C, Hsieh J, Adeli K, Lewis GF. Gut-liver interaction in triglyceride-rich lipoprotein metabolism. Am. J. Physiol. Endocrinol. Metab. 2011 doi: 10.1152/ajpendo.00178.2011. - DOI - PubMed
    1. Tonkin A, Byrnes A. Treatment of dyslipidemia. F1000Prime Rep. 2014;6:17. doi: 10.12703/P6-17. - DOI - PMC - PubMed
    1. Helwak A, Kudla G, Dudnakova T, Tollervey D. Mapping the human miRNA interactome by CLASH reveals frequent noncanonical binding. Cell. 2013;153:654–665. doi: 10.1016/j.cell.2013.03.043. - DOI - PMC - PubMed

Publication types

MeSH terms