. 2020 Nov 3;10(1):18936.
doi: 10.1038/s41598-020-75850-8.

Key differences between olfactory ensheathing cells and Schwann cells regarding phagocytosis of necrotic cells: implications for transplantation therapies

Affiliations

Key differences between olfactory ensheathing cells and Schwann cells regarding phagocytosis of necrotic cells: implications for transplantation therapies

L Nazareth et al. Sci Rep. .

Abstract

Transplantation of peripheral nervous system glia is being explored for treating neural injuries, in particular central nervous system injuries. These glia, olfactory ensheathing cells (OECs) and Schwann cells (SCs), are thought to aid regeneration by clearing necrotic cells, (necrotic bodies, NBs), as well as myelin debris. The mechanism by which the glia phagocytose and traffic NBs are not understood. Here, we show that OECs and SCs recognize phosphatidylserine on NBs, followed by engulfment and trafficking to endosomes and lysosomes. We also showed that both glia can phagocytose and process myelin debris. We compared the time-course of glial phagocytosis (of both NBs and myelin) to that of macrophages. Internalization and trafficking were considerably slower in glia than in macrophages, and OECs were more efficient phagocytes than SCs. The two glial types also differed regarding their cytokine responses after NB challenge. SCs produced low amounts of the pro-inflammatory cytokine TNF-α while OECs did not produce detectable TNF-α. Thus, OECs have a higher capacity than SCs for phagocytosis and trafficking, whilst producing lower amounts of pro-inflammatory cytokines. These findings suggest that OEC transplantation into the injured nervous system may lead to better outcomes than SC transplantation.


Conflict of interest statement

The authors declare no competing interests.

Figures

Figure 1
Figure 1
Heat exposure induces necrosis of McCoyB cells. The cells were either left untreated or induced to undergo necrosis by heat exposure at 55 °C for 30 min, after which cells were stained and transferred to 96-well plates for imaging. All cells were labelled with cytocalcein (live cell stain, blue), PS sensory dye (Apopxin, red) and membrane-impermeable DNA nuclear dye (DCS1, green). Example images of (AD) untreated control cells and (EH) heat-treated cells. (I) Percentages of cells displaying PS. (J) Percentages of dead cells (cells labelled with DSC1). PS- and DCS1-positive cells were automatically counted using Nikon Elements software. ***P ≤ 0.0001 (unpaired t-test with Welch’s correction). Data represents mean ± SEM (3 biological × 3 technical replicates of ~ 400 cells × 4 FOV). Scale bar: 100 µm.
Figure 2
Figure 2
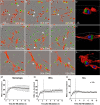
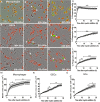
Engulfment of necrotic cells by macrophages, OECs and SCs. Example images of macrophages (J774A.1 cells) (AD), OECs (EH) and SCs (IL) challenged with necrotic cells pre-labelled with cell tracker (CMFDA green), at a NB:live cell ratio of 4:1. OECs/SCs expressed DsRed; macrophages were labelled with CellTracker red dye. Arrows indicate cells establishing contact with NBs. Localisation of internalized NBs within cells was confirmed by confocal imaging and 3D rendering (D, H, L). (MO) Graphical representation of the time-course for necrotic cell internalization by macrophages (M), OECs (N) and SCs (O). The Y-axes shows the number of NBs (green fluorescence) co-localizing with cells (red fluorescence) i.e. internalized NBs. The number of NBs co-localizing with cells at the various time-point were compared to background NB-cell co-localization levels (time zero). Stars shows the time-points at which the number of NBs co-localizing with cells were significantly different from background levels. *P ≤ 0.05, **P ≤ 0.01, ***P ≤ 0.001 (two-way ANOVA with Sidak’s multiple comparison test). Data represents mean ± SEM. n = 3 biological repeats × 3 technical replicates × 4 FOV/well (n = 300–400 cells/FOV). Scale bar: 100 µm in AC, EG, I-K and 10 µm in D, H, L).
Figure 3
Figure 3
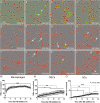
Trafficking of necrotic bodies to endosomes-lysosomes in macrophages and glia. (AL) Example images of macrophages (J774A.1 cells) (AD), OECs (EH) and SCs (IL) (red) with NBs inside endosomes/lysosomes (green, arrowheads). Necrotic cells were tagged with pHrodo STP dye (green) that only fluoresces in acidic pH (i.e. in intracellular endosomes/lysosomes); NBs not in endosomes/lysosomes do not fluoresce (examples shown by arrows in FH). (MO) Graphical representation of NB appearance within endosomes-lysosomes (pHrodo-tagged) between macrophages (M), OECs (N) and SCs (O). The Y-axis shows the number of NBs in endo/lysosomes (green fluorescence) co-localizing with cells (red fluorescence) i.e. internalized NBs. The number of pHrodo-tagged NBs co-localizing with cells at the various time-points were compared to background levels (time zero); stars shows time-points at which there was a significant difference from background *P ≤ 0.05, **P ≤ 0.01, ***P ≤ 0.0001 (two-way ANOVA with Sidak’s multiple comparison test). Data represents mean ± SEM. n = 3 biological repeats × 3 technical replicates × 4 FOV (n = 300–400 cells/FOV).
Figure 4
Figure 4
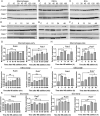
Processing of necrotic bodies in endosomes by macrophages and glia. (AL) Expression of early (Rab5) and late (Rab7) endosomal markers in the different cell types after challenge with necrotic cells. (AF) Example images of Western Blots for Rab5 and Rab7; (AC) show 0–180 min, (DF) show 0–48 h. (GL) Quantification of Rab5 and Rab7 protein expression. Bar graphs represents relative protein expression of Rab5 and Rab7 to a housekeeping protein (β-actin), with data from three independent experiments ± SEM. *P ≤ 0.05, **P ≤ 0.01, ***P ≤ 0.0001 (one-way ANOVA with Dunnett’s multiple comparison post-hoc test).
Figure 5
Figure 5
Necrotic bodies co-localize with lysosomes. (AF) Co-localisation of internalized NBs with lysosomes (LAMP-2) different time-points post challenge with necrotic cells. Green: internalized NBs. Magenta: LAMP-2 immunolabelling. Red: macrophages (A, B; CellTracker Red dye) or OECs/SCs (DsRed; CF). Blue: nuclear stain (Hoechst). Scale bar: 10 µm.
Figure 6
Figure 6
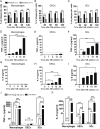
Internalization of necrotic cells by macrophages, OECs and SCs is dependent on PS recognition and results in the production of TNF-α. (AC) Blockage of PS by annexin V impairs NB internalization. Macrophages (A), OECs (B) and SCs (C) were exposed to fluorescently labelled necrotic cells (CMFDA dye, green) which had, or had not, been pre-incubated with annexin V. After 2 h, internalization of necrotic debris was determined. ***P ≤ 0.0001 (two-way ANOVA with Sidak’s multiple comparison test). Data represents mean ± SEM. n = 3 biological repeats × 3 technical replicates × 4 FOV (% phagocytic cells: cells with necrotic bodies/total cells × 100). (DF) Production of TNF-α (GH) Production of IL-6 following exposure to NBs by macrophages, OECs and SCs. At different time-point post exposure to NBs, the TNF-α and IL-6 levels produced by the three cell types were measured using ELISA (D, G: macrophages, E, H: OECs, F, I: SCs). **P ≤ 0.01, ***P ≤ 0.0001 (one-way ANOVA, Dunnett’s multiple comparison post-hoc test). Production of TNF-α (J) and IL-6 (K) in macrophages, OECS and SCs when exposed to NBs or a strong inflammatory stimulus (LPS + IFN-γ) for 24 h. **P ≤ 0.01, ***P ≤ 0.0001 (one-way ANOVA, Dunnett’s multiple comparison post-hoc test). Detectable TNF-α range of kit was 8–1000 pg/ml; IL-6: 4–500 pg/ml (dotted lines). Data represents three biological replicates with two technical replicates per assay experiments ± SEM.
Figure 7
Figure 7
Phagocytosis of myelin by macrophages, OECs and SCs. Shown are example images of macrophages (J774A.1 cells) (AC), OECs (EG), SCs (IK) (red) with myelin debris within endosomes/lysosomes (green, arrowheads). Myelin was labelled with pHrodo STP dye (green) that only fluoresces in acidic compartments (endosomes/lysosomes) within cells. Graphs show the percentage of macrophages (D), OECs (H) and SCs (L) containing myelin debris. Graphs (MN) display the area of myelin inside intracellular acidic compartments (green object area) per cell. Asterisks show time-points at which there was a significant difference from background (time zero). *P ≤ 0.05, **P ≤ 0.01, ***P ≤ 0.0001 (two-way ANOVA with Sidak’s multiple comparison test). Data represents mean ± SEM. n = 3 biological repeats × 3 technical replicates × 4 FOV (n = 300–400 cells/FOV).

Similar articles

Cited by

References

    1. Alizadeh A, Dyck SM, Karimi-Abdolrezaee S. Traumatic spinal cord injury: an overview of pathophysiology, models and acute injury mechanisms. Front. Neurol. 2019 doi: 10.3389/fneur.2019.00282. - DOI - PMC - PubMed
    1. O'Leary RA, Nichol AD. Pathophysiology of severe traumatic brain injury. J. Neurosurg. Sci. 2018;62:542–548. doi: 10.23736/s0390-5616.18.04501-0. - DOI - PubMed
    1. Anthony DC, Couch Y. The systemic response to CNS injury. Exp. Neurol. 2014;258:105–111. doi: 10.1016/j.expneurol.2014.03.013. - DOI - PubMed
    1. Sierra A, Abiega O, Shahraz A, Neumann H. Janus-faced microglia: beneficial and detrimental consequences of microglial phagocytosis. Front. Cell. Neurosci. 2013 doi: 10.3389/fncel.2013.00006. - DOI - PMC - PubMed
    1. Magnus T, Chan A, Linker RA, Toyka KV, Gold R. Astrocytes are less efficient in the removal of apoptotic lymphocytes than microglia cells: Implications for the role of glial cells in the inflamed central nervous system. J. Neuropathol. Exp. Neurol. 2002;61:760–766. doi: 10.1093/jnen/61.9.760. - DOI - PubMed

Publication types

Substances