. 2020 Nov 3;10(1):18886.
doi: 10.1038/s41598-020-76017-1.

Rampant loss of social traits during domestication of a Bacillus subtilis natural isolate

Affiliations

Rampant loss of social traits during domestication of a Bacillus subtilis natural isolate

Hugo C Barreto et al. Sci Rep. .

Abstract

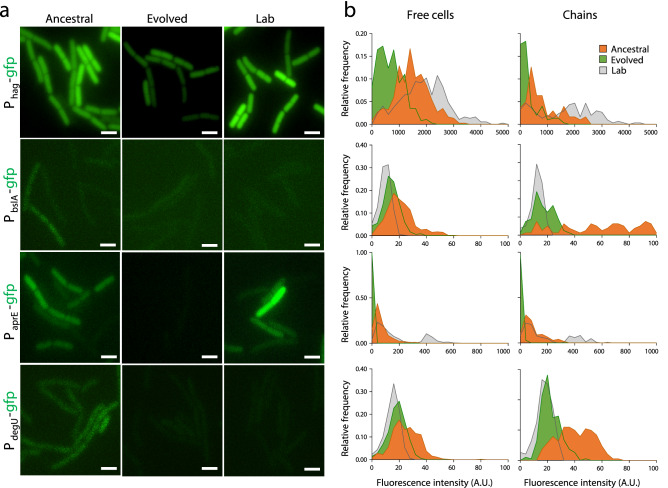
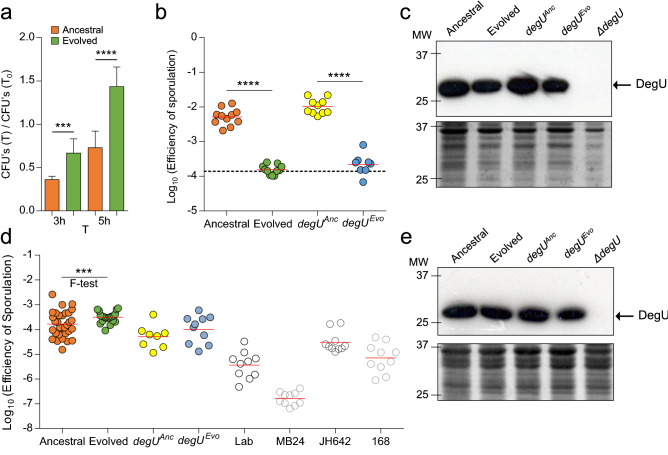
Most model bacteria have been domesticated in laboratory conditions. Yet, the tempo with which a natural isolate diverges from its ancestral phenotype under domestication to a novel laboratory environment is poorly understood. Such knowledge, however is essential to understanding the rate of evolution, the time scale over which a natural isolate can be propagated without loss of its natural adaptive traits, and the reliability of experimental results across labs. Using experimental evolution, phenotypic assays, and whole-genome sequencing, we show that within a week of propagation in a common laboratory environment, a natural isolate of Bacillus subtilis acquires mutations that cause changes in a multitude of traits. A single adaptive mutational step in the gene coding for the transcriptional regulator DegU impairs a DegU-dependent positive autoregulatory loop and leads to loss of robust biofilm architecture, impaired swarming motility, reduced secretion of exoproteases, and to changes in the dynamics of sporulation across environments. Importantly, domestication also resulted in improved survival when the bacteria face pressure from cells of the innate immune system. These results show that degU is a target for mutations during domestication and underscores the importance of performing careful and extremely short-term propagations of natural isolates to conserve the traits encoded in their original genomes.


Conflict of interest statement

The authors declare no competing interests.

Figures

Figure 1
Figure 1
Changes in colony morphology with domestication. (a) Representative image of the Ancestral colony morphology and the three different types of colony morphology, a, b and c, observed at the eighth and sixteenth days of the domestication experiment in the five evolved populations; (b) frequency of each morphotype in the five populations at day 8 (Ancestral, n = 163; Population 1, n = 407; Population 2, n = 140; Population 3, n = 110; Population 4, n = 132; Population 5, n = 162); (c) frequency of morphotype b in population 1 over time (Ancestral, n = 163; day 2, n = 200; day 4, n = 189; day 6, n = 238; day 8, n = 407). The scale bar represents 1 cm and applies to all panels. For panel b and c, n stands for the number of colonies. This figure was generated with Microsoft Excel 2019 MSO (version 16.0.10366.20016; https://www.microsoft.com) and Microsoft PowerPoint 2019 MSO (version 16.0.10366.20016; https://www.microsoft.com).
Figure 2
Figure 2
Domestication is accompanied by mutations in degU. (a) degU region of the B. subtilis chromosome (top) and domain organization of the DegU protein (bottom). The position of the various mutations detected and the corresponding amino acid substitution is indicated. (b) Model of the full-length DegU protein of B. subtilis obtained by comparative modeling and using the crystal structure of the LiaR protein from Enterococcus faecalis as the template (PDB code: 5hev). The protein is thought to form a dimer and the two monomers are represented in blue and light brown, with the position of the receiver and DNA-binding domains indicated. The red arrows indicate the location of the single amino acid substitutions found in DegU. a and b show a magnification of the regions encompassing the V131D (a) and the I186M and H200Y (b) substitutions. In b, the region of the helix-turn-helix (HTH) motif is modeled with DNA, to highlight the likely involvement of residues I186 and H200 in DNA binding. The HTH motif was independently modeled using the crystal structure of the LiaR DNA-binding domain as the template (PDB code: 4wuh). (c) Representative images showing the complex biofilm morphology of Ancestral and clones representative of each population after 16 days of domestication. The mutations in DegU present in each clone are indicated in red. All strains were incubated in MSgg for 96 h at 28 °C. Scale bar 1 cm. This figure was generated with Microsoft PowerPoint 2019 MSO (version 16.0.10366.20016; https://www.microsoft.com).
Figure 3
Figure 3
degUEvo is responsible for the alteration in swarming motility and colony architecture. (a) Swarming motility assay of Ancestral, Evolved, degUAnc, degUEvo, ΔdegU, and Lab. LB plates fortified with 0.7% of agar were inoculated incubated for 16 h at 28 °C. Swarm expansion, resulting from bacterial growth, appears in white, whereas uncolonized agar appears in black. (b) Representative images showing the complex colony architecture development along with the indicated time points of the Ancestral and Evolved. The strains were grown in MSgg medium at 28 °C. (c) Representative images showing the complex colony architecture of the indicated strains on MSgg agar plates incubated for 96 h at 28 °C. Scale bars 1 cm. For all panels, the assays were repeated a minimum of three times. This figure was generated with Microsoft PowerPoint 2019 MSO (version 16.0.10366.20016; https://www.microsoft.com).
Figure 4
Figure 4
degUEvo is responsible for the alteration in biofilm complexity, exoprotease secretion, phage resistance, and the pattern of gene expression during biofilm formation. (a) Quantification by the crystal violet method of the biofilms formed by the Ancestral (n = 18 for 24 h; n = 15 for 48 h), Evolved (n = 22 for 24 h; n = 15 for 48 h), degUAnc (n = 18 for 24 h, n = 19 for 48 h), and degUEvo (n = 19 for 24 h; n = 18 for 48 h) in MSgg broth incubated at 25 °C for the indicated time points. Mann–Whitney U tests were used. ****p < 0.0001. (b) Dimension of the halos produced by the Ancestral (n = 4), Evolved (n = 4), degUAnc (n = 3), degUEvo (n = 3), and ΔdegU (n = 4) in LB fortified with 1.5% agar and supplemented with 2% of skimmed milk incubated at 37 °C for 48 h. Unpaired t test with Welch’s correction were used. ****p < 0.0001 and ***p = 0.007. The error bar represents the standard deviation. (c) Efficiency of Plating (EOP) shown in white numbers in the superior right corner for the Ancestral, Evolved, degUAnc, degUEvo, ΔdegU using as a reference the indicator strain Lab (PY79), which is phage sensitive. The number of plaque-forming units (PFU’s) is shown in the superior left corner in white numbers. The yellow arrows indicate SPP1 phage plaques. Note that Ancestral is sensitive to SPP1 but the plaque size is reduced when compared to the Lab strain, while the Evolved is resistant. Scale bars 1 cm. (d) Representative images of the expression of transcriptional fusions between the aprE, bslA, hag, and degU promoter regions and gfp in Ancestral, Evolved, and Lab after 96 h of incubation in MSgg at 28 °C. Scale bar 1 cm. In panel a and b the error bars represent the standard deviation. This figure was generated with Microsoft Excel 2019 MSO (version 16.0.10366.20016; https://www.microsoft.com) and Microsoft PowerPoint 2019 MSO (version 16.0.10366.20016; https://www.microsoft.com).
Figure 5
Figure 5
degUEvo alters the pattern of gene expression at the single-cell level. (a) Representative images of the expression of hag-, bslA-, aprE- and degU-gfp transcriptional fusions in Ancestral, Evolved, and Lab one hour after the onset of stationary phase in LB. The cultures were grown with agitation at 37 °C. Scale bar 1 µm. (b) Relative frequency of expression of transcriptional fusions of the indicated promoters to gfp in the same conditions as above. For the relative frequency of expression of transcriptional fusions in free cells, a total of 371 (hag-gfp), 453 (bslA-gfp), 713 (aprE-gfp), and 561 (degU-gfp) cells from Ancestral, Evolved and Lab were analyzed. For the relative frequency of expression of transcriptional fusions in chains, a total of 150 (hag-gfp), 79 (bslA-gfp), 168 (aprE-gfp), and 191 (degU-gfp) cells from Ancestral, Evolved and Lab were analyzed. This figure was generated with GraphPad Prism 7 software for Windows (version 7.04; https://www.graphpad.com/scientific-software/prism/) and Microsoft PowerPoint 2019 MSO (version 16.0.10366.20016; https://www.microsoft.com).
Figure 6
Figure 6
degUEvo increases survival in the presence of macrophages and changes sporulation efficiency in an environment-dependent manner. (a) Macrophages were infected with Ancestral (n = 9) and Evolved (n = 9) and colony-forming units of both the intracellular and extracellular bacteria obtained by plating at the indicated time points. Unpaired t test with Welch’s correction were used, where ***corresponds to p = 0.001 and **** to p < 0.0001. The error bar represents the standard deviation. (b) Comparison of the sporulation efficiency in RPMI medium between Ancestral (n = 11), Evolved (n = 11), degUAnc (n = 10) and degUEvo (n = 8). The efficiency of sporulation was calculated as the ratio between the heat resistant spore counts and total (viable) cells. The dashed line indicates the average sporulation efficiency for the Ancestral in LB. ANOVA with Tukey’s multiple comparison tests were used, where **** corresponds to p < 0.0001. (c) Accumulation of DegU in Ancestral, Evolved, degUAnc, degUEvo, and the degU insertional mutant in RPMI. (d) Comparison of the sporulation efficiency and variance in LB between Ancestral (n = 31), Evolved (n = 21), degUAnc (n = 8), degUEvo (n = 10), Lab (n = 10) and three other commonly used laboratory strains (MB24, n = 10, JH642, n = 10, and 168, n = 10). For the mean sporulation efficiency, an ANOVA and Tukey’s multiple comparison test was used. For the variance the F test was used. ***p = 0.0002. (e) The levels of DegU are similar between Ancestral and Evolved in LB. Accumulation of DegU in Ancestral, Evolved, degUAnc, degUEvo, and the degU insertional mutant. In (c,e), the cells were collected after growth in RPMI (c) or LB (e) and whole-cell lysates prepared (see “Methods”). Proteins (20 µg) in whole-cell lysates were resolved by SDS-PAGE and subject to immunoblot analysis with an anti-DegU antibody. The arrow shows the position of DegU; the red arrows indicate slightly higher levels of DegU. The panel below the immunoblot shows part of a Coomassie-stained gel, run in parallel, as a loading control. The position of molecular weight markers (in kDa) is shown on the left side of the panels. In panels (b,d) the red line indicates the mean. The full-length blots and full-length Coomassie-stained gels are presented in Supplementary Figure S6. This figure was generated with GraphPad Prism 7 software for Windows (version 7.04; https://www.graphpad.com/scientific-software/prism/) and Microsoft PowerPoint 2019 MSO (version 16.0.10366.20016; https://www.microsoft.com).

Similar articles

Cited by

References

    1. Vlamakis H, Chai Y, Beauregard P, Losick R, Kolter R. Sticking together: Building a biofilm the Bacillus subtilis way. Nat. Rev. Microbiol. 2013;11:157–168. doi: 10.1038/nrmicro2960. - DOI - PMC - PubMed
    1. Eydallin G, Ryall B, Maharjan R, Ferenci T. The nature of laboratory domestication changes in freshly isolated Escherichia coli strains. Environ. Microbiol. 2014;16:813–828. doi: 10.1111/1462-2920.12208. - DOI - PubMed
    1. Leiman SA, Arboleda LC, Spina JS, McLoon AL. SinR is a mutational target for fine-tuning biofilm formation in laboratory-evolved strains of Bacillus subtilis. BMC Microbiol. 2014;14:301. doi: 10.1186/s12866-014-0301-8. - DOI - PMC - PubMed
    1. Marks ME, et al. The genetic basis of laboratory adaptation in Caulobacter crescentus. J. Bacteriol. 2010;192:3678–3688. doi: 10.1128/JB.00255-10. - DOI - PMC - PubMed
    1. Kuthan M, et al. Domestication of wild Saccharomyces cerevisiae is accompanied by changes in gene expression and colony morphology. Mol. Microbiol. 2003;47:745–754. doi: 10.1046/j.1365-2958.2003.03332.x. - DOI - PubMed

Publication types

LinkOut - more resources