. 2020 Nov 3;10(1):18941.
doi: 10.1038/s41598-020-75899-5.

Mito Hacker: a set of tools to enable high-throughput analysis of mitochondrial network morphology

Affiliations

Mito Hacker: a set of tools to enable high-throughput analysis of mitochondrial network morphology

Ali Rohani et al. Sci Rep. .

Abstract

Mitochondria are highly dynamic organelles that can exhibit a wide range of morphologies. Mitochondrial morphology can differ significantly across cell types, reflecting different physiological needs, but can also change rapidly in response to stress or the activation of signaling pathways. Understanding both the cause and consequences of these morphological changes is critical to fully understanding how mitochondrial function contributes to both normal and pathological physiology. However, while robust and quantitative analysis of mitochondrial morphology has become increasingly accessible, there is a need for new tools to generate and analyze large data sets of mitochondrial images in high throughput. The generation of such datasets is critical to fully benefit from rapidly evolving methods in data science, such as neural networks, that have shown tremendous value in extracting novel biological insights and generating new hypotheses. Here we describe a set of three computational tools, Cell Catcher, Mito Catcher and MiA, that we have developed to extract extensive mitochondrial network data on a single-cell level from multi-cell fluorescence images. Cell Catcher automatically separates and isolates individual cells from multi-cell images; Mito Catcher uses the statistical distribution of pixel intensities across the mitochondrial network to detect and remove background noise from the cell and segment the mitochondrial network; MiA uses the binarized mitochondrial network to perform more than 100 mitochondria-level and cell-level morphometric measurements. To validate the utility of this set of tools, we generated a database of morphological features for 630 individual cells that encode 0, 1 or 2 alleles of the mitochondrial fission GTPase Drp1 and demonstrate that these mitochondrial data could be used to predict Drp1 genotype with 87% accuracy. Together, this suite of tools enables the high-throughput and automated collection of detailed and quantitative mitochondrial structural information at a single-cell level. Furthermore, the data generated with these tools, when combined with advanced data science approaches, can be used to generate novel biological insights.


Conflict of interest statement

The authors declare no competing interests.

Figures

Figure 1
Figure 1
Mito Hacker Workflow. (a) Batch Analysis: Multiple images can be uploaded at the same time. (b) Cell Catcher: First, the ghost cells are identified and removed from each image, and then individual cells are separated based on Expectation Maximization (EM). (c) Mito Catcher: Pixel intensity distribution within the nuclear zone is used to estimate the background and signal levels to effectively segment the mitochondrial network. (d) MiA: The segmented mitochondrial networks are quantified using MiA, and the data for the quantified networks is exported in a tabular format. Scale Bars: 10 μm.
Figure 2
Figure 2
Cell Catcher isolates individual cells on each image using the expectation maximization. (a) A multi-cell image uploaded to Cell Catcher. (b) Nuclei are segmented and separated. (c) The nuclei are used as initial seed to estimate the distribution of the mitochondria across different cells on the image. (d) After various rounds of mitochondria assignment, the seeds’ structures and orientation are updated to reflect the effects of newly added mitochondria at each step. (e) The final map of individual cells on the images after separation by Cell Catcher. Scale Bars: 10 μm.
Figure 3
Figure 3
Single cell isolation using cell catcher. Murine pancreatic cancer cells were transiently transfected with mito-YFP and imaged using confocal microscopy. (a,b) Sample multi-cell images processed by Cell Catcher to identify and separate individual cells. The two cells on bottom right in (a) and (b) that have substantial overlap with the frame edges are identified as bad cells by Cell Catcher, automatically exported to a separate folder and excluded from subsequent analysis. Excluded images remain available to the user. Scale Bars: 10 μm.
Figure 4
Figure 4
Adaptive Mitochondrial Masking (AdaMM). (a) Image of a sample cell to be analyzed. (b) The image is divided into equally sized blocks, and the empty blocks are removed. (c) The distribution of average signal across the tiles is calculated. (d) A generalized logistic function is fit to the tile intensity distribution to determine the level of correction needed for each tile based on its signal level. (e) Each tile receives a different correction factor, and the adjusted threshold is used to locally segment the contents of each tile. (f) The segmented tiles are attached together to create the final, locally thresholded image of the cell for analysis. Scale Bars: 10 μm.
Figure 5
Figure 5
Morphological measurements from MiA. (a) A schematic of a mitochondrion showing the basic geometrical measurements such as area, perimeter, convex hull and the solidity of mitochondrion. (b) Measuring the bounding box of a mitochondrion and its extent. The orange lines depict the skeleton of the mitochondrion, which is extracted through a thinning process. (c) Measuring the major and minor axes of mitochondria and its orientation.
Figure 6
Figure 6
Analysis of Mito Hacker-generated data. (a) Representative images of KPDC145 (Drp1−/−), KPDC253 (Drp1+/+) and KPDC143 (Drp1+/−). Qualitative analysis of mitochondrial morphology indicates that KDPC145 is morphologically distinct from KPDC253 and KPDC143. (b) Distributions of various mitochondrial measurements from > 185 individual cells per cell line; (i, ii) Morphological measurements at the mitochondria level; (iii, iv) Morphological measurements at the sub-mitochondria level (mitochondrial skeleton); (v, vi) Morphological measurements at the cell level. Scale Bars: 10 μm.
Figure 7
Figure 7
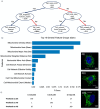
Predictive modeling using Mito Hacker-generated data. (a) The decision structure behind the classification of the three different cell lines. The structure suggests that the average of the area of the mitochondria across the cells is a strong predictor of the cell line. (b) List of the important features in distinguishing the morphological structures among different cell lines, ranked based on the achieved information gain after splitting the data. This is the ranking of the features after removing the highly correlated features from the dataset, using the IVF method. (c) The confusion matrix of the model after outlier removal. The matrix shows that the majority of the drop in the performance happens because the model is not able to effectively separate KPDC253 and KPDC143 (~ %75 accuracy). (d) Three representative cells from each of the three different cell lines demonstrating the apparent morphological similarity between KDPC253 and KPDC143. Scale Bars: 10 μm.

Similar articles

Cited by

References

    1. Sprenger H-G, Langer T. The good and the bad of mitochondrial breakups. Trends Cell Biol. 2019;29:888–900. doi: 10.1016/j.tcb.2019.08.003. - DOI - PubMed
    1. Pernas L, Scorrano L. Mito-Morphosis: Mitochondrial fusion, fission, and cristae remodeling as key mediators of cellular function. Annu. Rev. Physiol. 2016;78:505–531. doi: 10.1146/annurev-physiol-021115-105011. - DOI - PubMed
    1. Archer SL. Mitochondrial dynamics–mitochondrial fission and fusion in human diseases. N. Engl. J. Med. 2013;369:2236–2251. doi: 10.1056/NEJMra1215233. - DOI - PubMed
    1. Zanella F, Lorens JB, Link W. High content screening: Seeing is believing. Trends Biotechnol. 2010;28:237–245. doi: 10.1016/j.tibtech.2010.02.005. - DOI - PubMed
    1. Moen E, et al. Deep learning for cellular image analysis. Nat. Methods. 2019;16:1233–1246. doi: 10.1038/s41592-019-0403-1. - DOI - PMC - PubMed

Publication types