. 2020 Nov 3;10(1):18906.
doi: 10.1038/s41598-020-76049-7.

Concomitant genetic ablation of L-type Cav1.3 (α1D) and T-type Cav3.1 (α1G) Ca2+ channels disrupts heart automaticity

Affiliations

Concomitant genetic ablation of L-type Cav1.3 (α1D) and T-type Cav3.1 (α1G) Ca2+ channels disrupts heart automaticity

Matthias Baudot et al. Sci Rep. .

Abstract

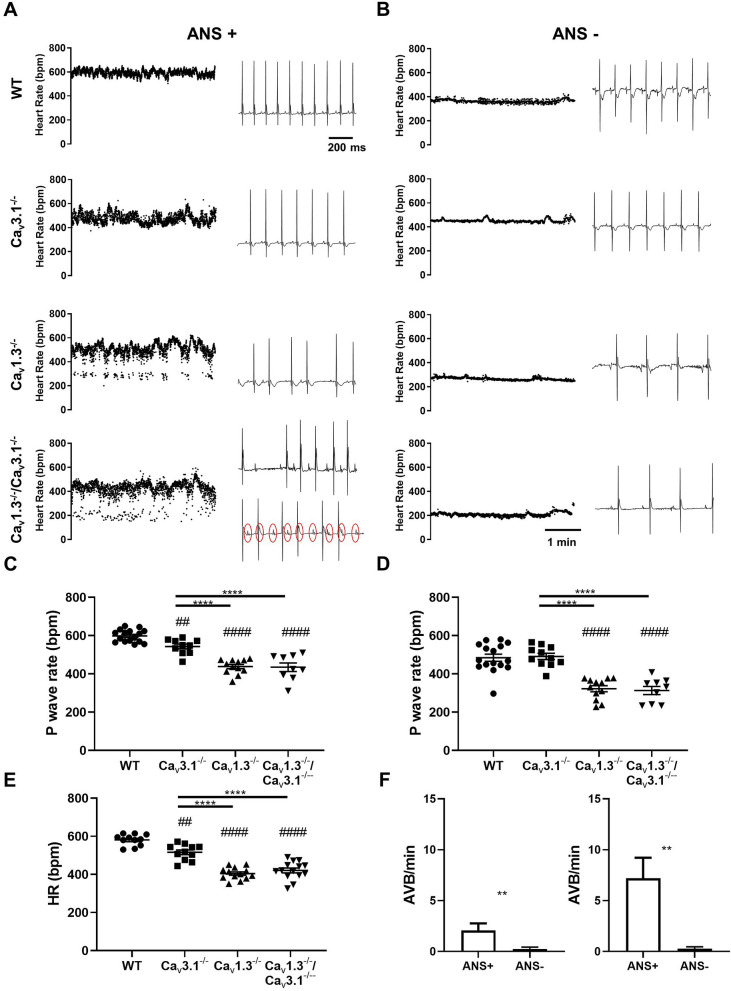
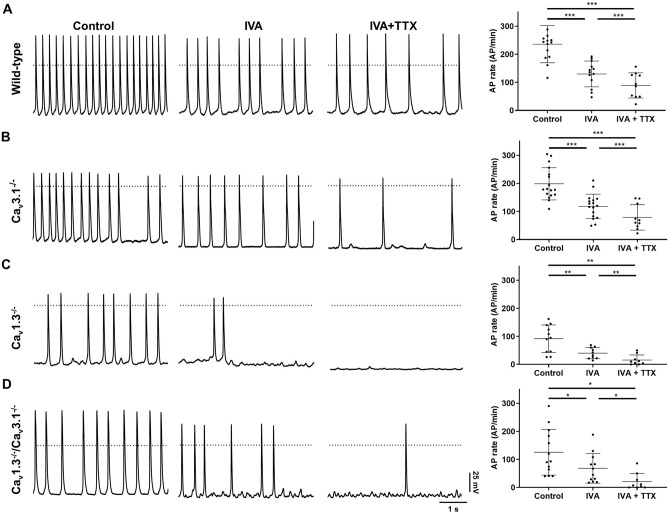
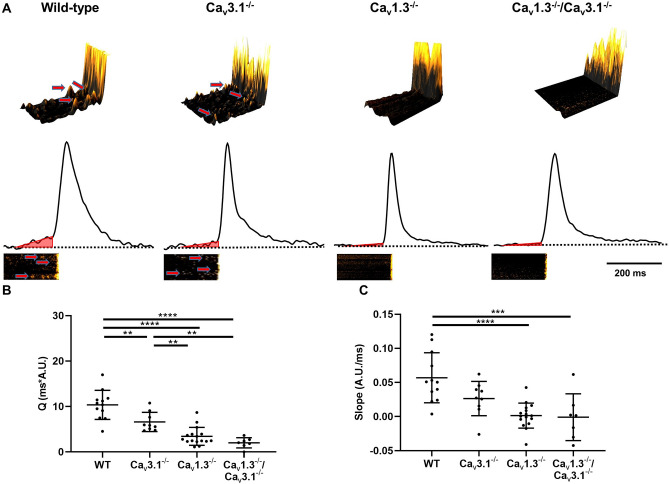
Cardiac automaticity is set by pacemaker activity of the sinus node (SAN). In addition to the ubiquitously expressed cardiac voltage-gated L-type Cav1.2 Ca2+ channel isoform, pacemaker cells within the SAN and the atrioventricular node co-express voltage-gated L-type Cav1.3 and T-type Cav3.1 Ca2+ channels (SAN-VGCCs). The role of SAN-VGCCs in automaticity is incompletely understood. We used knockout mice carrying individual genetic ablation of Cav1.3 (Cav1.3-/-) or Cav3.1 (Cav3.1-/-) channels and double mutant Cav1.3-/-/Cav3.1-/- mice expressing only Cav1.2 channels. We show that concomitant loss of SAN-VGCCs prevents physiological SAN automaticity, blocks impulse conduction and compromises ventricular rhythmicity. Coexpression of SAN-VGCCs is necessary for impulse formation in the central SAN. In mice lacking SAN-VGCCs, residual pacemaker activity is predominantly generated in peripheral nodal and extranodal sites by f-channels and TTX-sensitive Na+ channels. In beating SAN cells, ablation of SAN-VGCCs disrupted late diastolic local intracellular Ca2+ release, which demonstrates an important role for these channels in supporting the sarcoplasmic reticulum based "Ca2+ clock" mechanism during normal pacemaking. These data implicate an underappreciated role for co-expression of SAN-VGCCs in heart automaticity and define an integral role for these channels in mechanisms that control the heartbeat.


Conflict of interest statement

The authors declare no competing interests.

Figures

Figure 1
Figure 1
ICa in isolated SAN cells from wild-type and mutant mice. (A) Sample traces recorded from a HP of − 80 mV (top line) or from − 55 mV (bottom line) in SAN cells of wild-type (WT) (a), Cav3.1−/ (b), Cav1.3−/ (c) and Cav1.3−//Cav3.1−/ mice (d). (B) Current-to-voltage (I–V) relationship of Ca2+ current recorded from a HP = − 80 mV (black circles) or from HP = − 55 mV (red circles) in SAN cells from the following genotypes: wild-type (a, n = 16), Cav3.1−/ (b, n = 15), Cav1.3−/ (c, n = 15) and Cav1.3−//Cav3.1−/ mice (d, n = 18). In (a) and (b), the dashed line indicates the net ICaT I–V curve, calculated as the difference between values obtained from HP of − 55 mV from those from HP − 80 mV. (C,D) Relative density of ICaT and ICaL recorded in SAN cells isolated from wild-type (black bars, n = 16), Cav3.1−/ (a, open bars, n = 15), Cav1.3−/ (b, open bars, n = 15) and Cav1.3−//Cav3.1−/ mice (c, open bars, n = 18) at different test potentials from HP = − 80 mV (C) and HP = − 55 mV (D).
Figure 2
Figure 2
ECG recordings in wild-type and mutant mice. (A) Sample dot plots of heart rate (left panels) and ECG recordings (right panels) under control conditions with autonomic nervous system (ANS+) in wild-type (WT, Cav3.1−/, Cav1.3−/ and Cav1.3−//Cav3.1−/ mice. Red circles indicate P waves in ECG recording in Cav1.3−/−/Cav3.1−/− mice presenting 3rd degree AV block. (B) Dot plots of heart rate (left panels) and ECG recordings (right panels) following intraperitoneal injection of atropine (1 mg/kg) and propranolol (5 mg/kg) to inhibit the input of the autonomic nervous system (ANS−) in WT, Cav3.1−/−, Cav1.3−/− and Cav1.3−/−/Cav3.1−/−mice. (C,D). Averaged rate of P waves (atrial rate) in wild-type (n = 16) and mutant mice under control conditions (ANS+) (C, Cav3.1−/− n = 10, Cav1.3−/− n = 12, Cav1.3−/−/Cav3.1−/− n = 9) or following concomitant injection of atropine and propranolol (ANS−) (D, WT n = 16 Cav3.1−/− n = 11, Cav1.3−/− n = 12, Cav1.3−/−/Cav3.1−/− n = 9) conditions. (E) Averaged ventricular rates (HR) in wild-type (n = 11) and mutant mice (Cav3.1−/− n = 11, Cav1.3−/− n = 13, Cav1.3−/−/Cav3.1−/ n = 14) under control (ANS+) conditions. Statistics: one-way ANOVA followed by Tukey’s multiple comparisons. Whiskers indicate mean ± the SEM. (#) Indicates comparison with wild-type. (F) Number of atrioventricular blocks (AVB) under control and atropine and propranolol inhibition conditions in n = 12 Cav1.3−/ (left) and n = 9 Cav1.3−//Cav3.1−/ (right) mice. Statistics: unpaired t test. (#) Indicates comparison with wild-type. Statistics: Wilcoxon matched-pairs signed rank test.
Figure 3
Figure 3
Rhythm dissociation in mutant hearts following concomitant deletion of SAN-VGCCs. (A) Line plots of atrial (green line) and ventricular (blue line) rates (left panel) and sample ECGs (right panel) recorded ex vivo on isolated Langendorff perfused heart under control conditions in n = 8 WT, n = 6 Cav3.1−/, n = 8 Cav1.3−/ and n = 7 Cav1.3−//Cav3.1−/. (B) P wave rates in isolated wild-type and mutant hearts under control conditions. (C) Differences between atrial and ventricular rates of isolated hearts. Statistics: one-way ANOVA followed by Tukey’s multiple comparisons. Whiskers indicate mean ± the SEM. (#) Indicates comparison with wild-type.
Figure 4
Figure 4
SAN automaticity and distribution of pacemaker leading sites in SAN/atria from wild-type and mutant mice. (A) Sample snapshots of SAN/atria preparations with points showing the position of the pacemaking leading region. Connecting lines indicate alternating leading regions in in the same mutant SAN. (B) Comparison between atrial rates of n = 8 wild-type, n = 8 Cav3.1−/, n = 7 Cav1.3−/ and n = 6 Cav1.3−//Cav3.1−/ SAN/atria preparations. (C) Coefficient of variability of atrial rates from the same mice as in (B). Statistics: one-way ANOVA followed by Tukey’s multiple comparisons test. Whiskers indicate mean ± the SD. (D) Linear regression between the rate from the leading region and the distance from the normal leading region recorded in wild-type preparations. (#) Indicates comparison with wild-type.
Figure 5
Figure 5
Heart rates in wild-type and mutant mice under pharmacologic inhibition of If. Dot plots of heart rates and sample ECGs recorded before (A) and after (B) intraperitoneal (IP) injection of ivabradine (IVA, 6 mg/kg) in n = 14 WT, n = 9 Cav3.1−/, n = 10 Cav1.3−/ and n = 14 Cav1.3−//Cav3.1−/ mice. Plotted averaged heart rates measured before (C) and after (D) IVA injection in all genotypes. (E) Relative effect of IVA 6 mg/kg (I.P. injection) on heart rates measured in all genotypes. In panels (C, D) and (E), whiskers indicate mean ± the SEM. Statistics: one-way ANOVA followed by Tukey’s multiple comparisons test. (#) Indicates comparison with wild-type mice.
Figure 6
Figure 6
Pacemaker arrest by concomitant inhibition of If and INa(TTX) in Cav1.3−/ SAN/atria preparations. (A) Atrial rates of n = 7 WT, n = 6 Cav3.1−/, n = 7 Cav1.3−/ and n = 6 Cav1.3−//Cav3.1−/ isolated Langendorff hearts under ivabradine (IVA, 10 µM) perfusion. (B) Atrial rates of isolated hearts under IVA 10 µM + TTX 100 nM perfusion. (C) Sample snapshots of the localization of leading regions under IVA 10 µM perfusion (left panels) and averaged rates of depolarization in n = 7 WT, n = 7 Cav3.1−/ , n = 6 Cav1.3−/ and n = 6 Cav1.3−//Cav3.1−/ SAN/atria preparations. (D) Same representation as in (C) with leading region in IVA 10 µM + TTX 100 nM perfusion. Statistics: one-way ANOVA followed by Tukey’s multiple comparisons test. Whiskers indicate mean ± the SD. (#) Indicates comparison with wild-type.
Figure 7
Figure 7
Pacemaker activity in SAN cells from wild-type and mutant mice. Sample perforated-patch action potential recordings (left panels) of SAN cells under control conditions (control), following perfusion of IVA (3 µM) and concomitant perfusion of IVA and TTX (IVA + TTX, 50 nM), from wild-type (A, n = 14), Cav3.1−/ (B, n = 17), Cav1.3−/ (C, n = 11) and Cav1.3−//Cav3.1−/ (D, n = 13). The left panels show corresponding averaged rates of action potentials. Statistics: one-way ANOVA followed by Holm–Sidak multiple comparisons test. Whiskers indicate mean ± SD.
Figure 8
Figure 8
Confocal line scan imaging of intracellular Ca2+ ([Ca2+]i) release during pacemaker activity of SAN cells from wild-type and mutant mice. Confocal line scan (left) images (top, left), corresponding sample traces of the time integral (bottom, left) and averaged frequency of spontaneous [Ca2+]i transients (right) of SAN cells form wild-type (A, n = 13), Cav3.1−/ (B, n = 8), Cav1.3−/ (C, n = 13) and Cav1.3−//Cav3.1−/ (D, n = 7) loaded with Fluo-4 and perfused with Tyrode’s solution (left) or IVA 3 µM (center) or IVA 3 µM + TTX 50 nM (right). Statistics: one-way ANOVA followed by Holm–Sidak multiple comparisons test. Whiskers indicate mean ± the SD.
Figure 9
Figure 9
Genetic ablation of SAN-VGCCs suppresses late diastolic local [Ca2+]i release (LCR). (A, top panel). Samples of 3D reconstruction of recordings of the change in fluorescence ratio F/F0 recorded 150 ms before the spontaneous cell-wide [Ca2+]i release transient. Red arrows indicate late diastolic LCR. (A, bottom panel). Corresponding samples traces of the time integral of the fluorescence ratio F/F0 signal recorded from wild-type, Cav3.1−/, Cav1.3−/, Cav1.3−//Cav3.1−/ isolated SAN cells. Red triangles represent the zone considered for calculating the slope and time integral of ramp phases, which reflects late diastolic LCR. The ramp phase was calculated starting 150 ms before the peak of the [Ca2+]i transient. The bottom insets show corresponding 2D line scan images. Time integral (Q) of F/F0 (B) and slope (C) of the ramp phase in n = 12 wild-type, n = 9 Cav3.1−/, n = 16 Cav1.3−/ and n = 7 Cav1.3−//Cav3.1−/ isolated SAN cells. A.U. indicate arbitrary units of the F/F0 ratio. Statistics: one-way ANOVA followed by Holm–Sidak multi comparison test.

References

    1. Mangoni ME, Nargeot J. Genesis and regulation of the heart automaticity. Physiol. Rev. 2008;88:919–982. doi: 10.1152/physrev.00018.2007. - DOI - PubMed
    1. DiFrancesco D. Pacemaker mechanisms in cardiac tissue. Annu. Rev. Physiol. 1993;55:455–472. doi: 10.1146/annurev.ph.55.030193.002323. - DOI - PubMed
    1. Lakatta EG, Maltsev VA, Vinogradova TM. A coupled SYSTEM of intracellular Ca2+ clocks and surface membrane voltage clocks controls the timekeeping mechanism of the heart's pacemaker. Circ. Res. 2010;106:659–673. doi: 10.1161/CIRCRESAHA.109.206078. - DOI - PMC - PubMed
    1. Monfredi O, Maltsev VA, Lakatta EG. Modern concepts concerning the origin of the heartbeat. Physiology (Bethesda) 2013;28:74–92. doi: 10.1152/physiol.00054.2012. - DOI - PMC - PubMed
    1. Yaniv Y, Lakatta EG, Maltsev VA. From two competing oscillators to one coupled-clock pacemaker cell system. Front. Physiol. 2015;6:28. doi: 10.3389/fphys.2015.00028. - DOI - PMC - PubMed

Publication types

LinkOut - more resources