. 2021 Apr;28(4):1270-1283.
doi: 10.1038/s41418-020-00650-6. Epub 2020 Nov 3.

IL-24 deficiency protects mice against bleomycin-induced pulmonary fibrosis by repressing IL-4-induced M2 program in macrophages

Affiliations

IL-24 deficiency protects mice against bleomycin-induced pulmonary fibrosis by repressing IL-4-induced M2 program in macrophages

Li-Zong Rao et al. Cell Death Differ. 2021 Apr.

Erratum in

Abstract

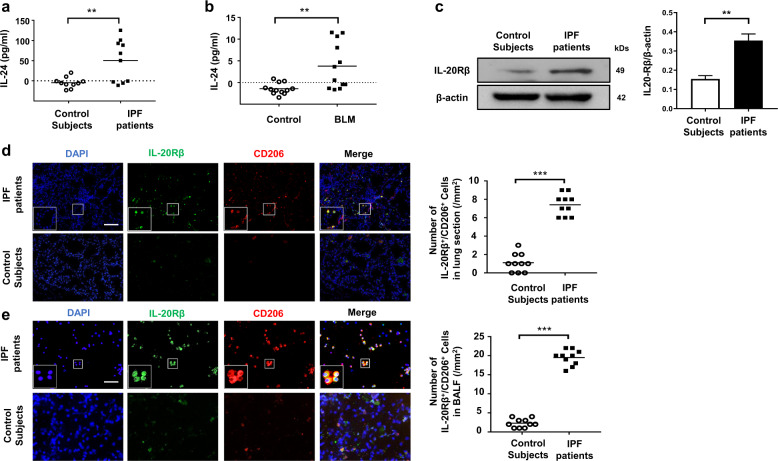
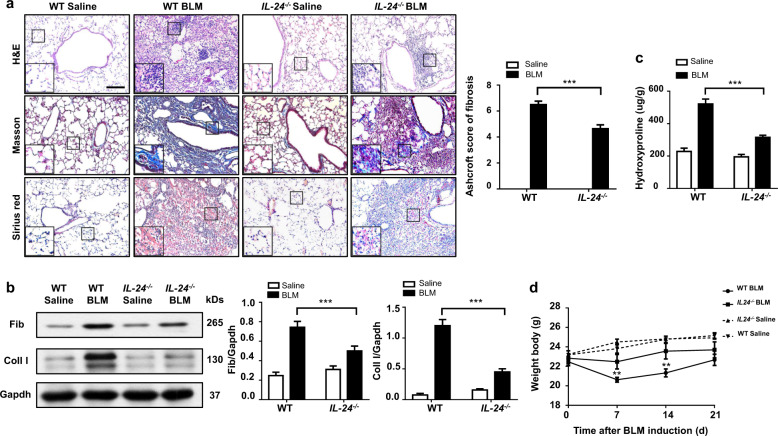
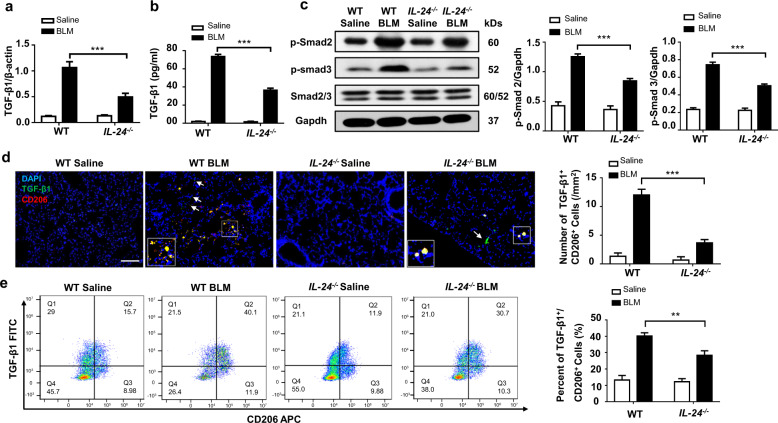
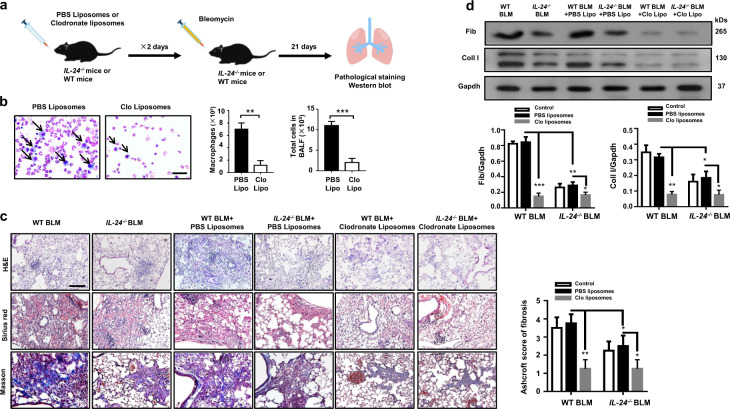
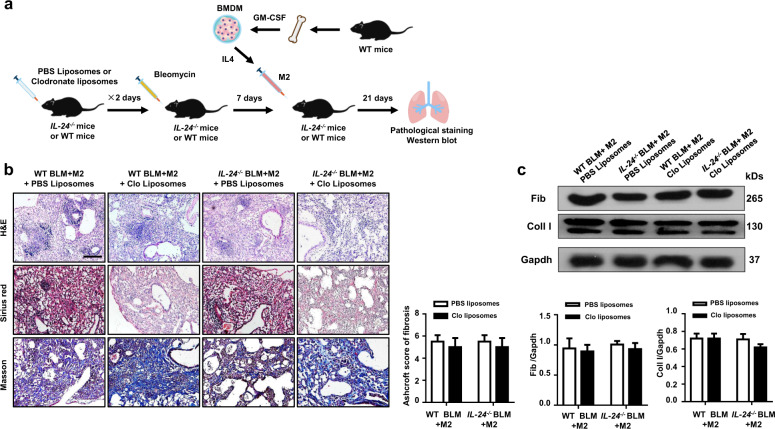
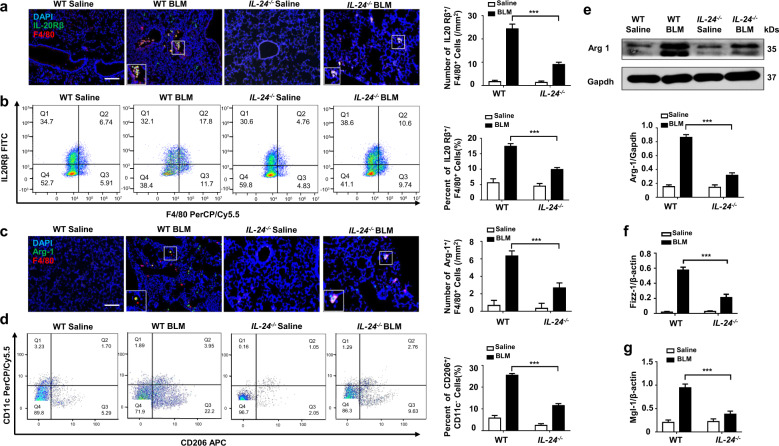
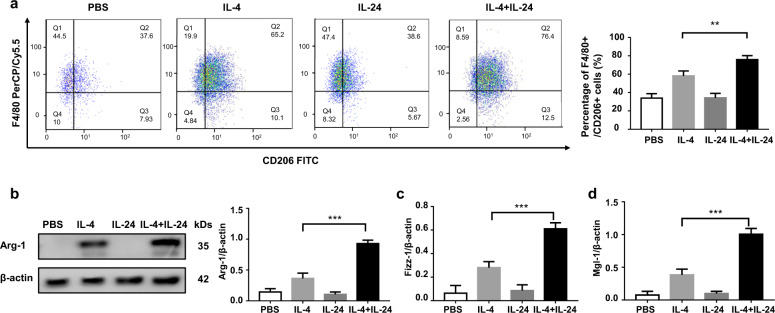
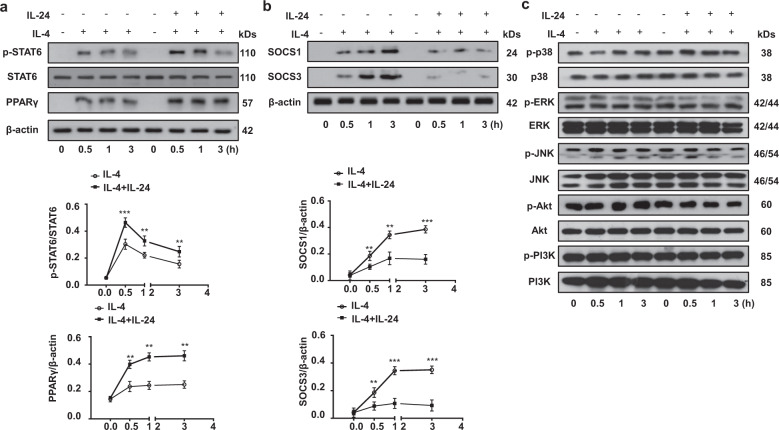
Idiopathic pulmonary fibrosis (IPF) is the most common type of idiopathic interstitial pneumonia and has one of the poorest prognosis. However, the molecular mechanisms underlying IPF progression remain largely unknown. In this study, we determined that IL-24, an IL-20 subfamily cytokine member, was increased both in the serum of IPF patients and the bronchoalveolar lavage fluid (BALF) of mice following bleomycin (BLM)-induced pulmonary fibrosis. As a result, IL-24 deficiency protected mice from BLM-induced lung injury and fibrosis. Specifically, loss of IL-24 significantly attenuated transforming growth factor β1 (TGF-β1) production and reduced M2 macrophage infiltration in the lung of BLM-induced mice. Mechanistically, IL-24 alone did not show a perceptible impact on the induction of M2 macrophages, but it synergized with IL-4 to promote M2 program in macrophages. IL-24 suppressed IL-4-induced expression of suppressor of cytokine signaling 1 (SOCS1) and SOCS3, through which it enhanced signal transducer and activator of transcription 6/peroxisome proliferator-activated receptor gamma (STAT6/PPARγ) signaling, thereby promoting IL-4-induced production of M2 macrophages. Collectively, our data support that IL-24 synergizes with IL-4 to promote macrophage M2 program contributing to the development of pulmonary fibrosis.


Conflict of interest statement

The authors declare that they have no conflict of interest.

Figures

Fig. 1
Fig. 1. Analysis of IL-24 expression in IPF patients and in BLM-induced mice.
a ELISA analysis of IL-24 levels in the serum from IPF patients and healthy subjects. A total of ten IPF patients and ten control subjects were analyzed. Results are shown as the median; each dot represents one patient. The dotted line indicates the detection limit. Statistical analysis was performed using the Student’s t test (**p < 0.01). b ELISA analysis of IL-24 levels in the BALF of mice following 21 days of BLM induction. Twelve mice were analyzed in each group. Each dot represents an animal, and the median is presented. The dotted line indicates the detection limit. Statistical analysis was performed using the Student’s t test (**p < 0.01). c Western blot analysis of IL-20Rβ expression in the lung homogenates derived from IPF patients and control subjects. Left panel: a representative Western blot result. Right panel: a bar graph showing the mean data for five IPF patients and five control subjects analyzed. Statistical analysis was performed using the Student’s t test (**p < 0.01). d Representative results for co-immunostaining of IL-20Rβ and CD206 (an M2 macrophage marker) in the lung sections from patients with IPF and healthy subjects. The nuclei were stained blue by DAPI, Scale bar, 50 μm. A total of ten IPF patients and ten control subjects were analyzed. Scatter plot indicates the IL-20Rβ+/CD206+ cell count (numbers/mm2) in the lung sections from IPF patients and healthy subjects; each dot represents a patient. Statistical analysis was performed using the Student’s t test (***p < 0.001). e Representative results for co-immunostaining of IL-20Rβ and CD206 (an M2 macrophage marker) in the BALF from patients with IPF and healthy subjects. The nuclei were stained blue by DAPI, Scale bar, 50 μm. A total of ten IPF patients and ten control subjects were analyzed. Scatter plot indicates the IL-20Rβ+/CD206+ cell count (numbers/mm2) in the BALF from IPF patients and healthy subjects; each dot represents a patient. Statistical analysis was performed using the Student’s t test (***p < 0.001). BLM bleomycin, IPF idiopathic pulmonary fibrosis.
Fig. 2
Fig. 2. Loss of IL-24 attenuates lung injury and fibrosis.
a Histological analysis of the severity of lung fibrosis in mice after BLM induction. Left panel: representative results for H&E (top), Masson (center), and Sirius red (bottom) staining. The insets show higher magnification images for a particular location. Right panel: a bar graph showing the semiquantitative Ashcroft scores for the severity of fibrosis, Scale bar, 50 μm. Error bars represent means ± SEM (n = 12). Statistical analysis was performed using one-way ANOVA (***p < 0.001). b Western blot analysis of the fibrotic markers collagen I and fibronectin. Left panel: a representative Western blot result. Right panel: a bar graph showing the mean data for all mice analyzed in each group. Error bars represent means ± SEM (n = 12). Statistical analysis was performed using one-way ANOVA (***p < 0.001). c Bar graph showing the quantification of hydroxyproline content in the lungs of mice after BLM induction. Error bars represent means ± SEM (n = 12). Statistical analysis was performed using one-way ANOVA (***p < 0.001). d Body weight changes during the course of BLM-induced fibrosis. Error bar represents the mean ± SEM of 12 mice analyzed. Statistical analysis was performed using one-way ANOVA (**p < 0.01). BLM bleomycin, Coll I collagen I, Fib fibronectin, WT wild type.
Fig. 3
Fig. 3. Loss of IL-24 attenuates TGF-β1 signaling after BLM induction.
a RT-PCR analysis of TGF-β1 expression in the lung homogenates. b ELISA results for TGF-β1 levels in the BALF. Error bar represents the mean ± SEM of 12 mice analyzed. Statistical analysis was performed using one-way ANOVA (***p < 0.001). c Results for Western blot analysis of TGF-β1 and downstream Smad2 and 3 activities. Left panel: a representative Western blot result for Smad2/3, p-Smad2, and p-Smad3 in the lung homogenates. Right panel: a bar graph showing the results for all mice examined. Error bar represents the mean ± SEM of 12 mice analyzed. Statistical analysis was performed using one-way ANOVA (***p < 0.001). d Co-immunostaining of TGF-β1 and CD206 in the lung sections. Scale bar, 50 μm. The white arrows indicate TGF-β1+/CD206 cells in the lung sections. Error bar represents the mean ± SEM of 12 mice analyzed. Statistical analysis was performed using one-way ANOVA (***p < 0.001). e Flow cytometry analysis of TGF-β1 and CD206 expression in the lung single-cell suspensions in both BLM induced WT and IL-24−/− mice. Left panel: a scatter diagram for flow cytometry analysis. Right panel: a bar graph showing the data with five mice examined, the cells were first gated in F4/80 and CD11b, and then subjected to analysis of TGF-β1-FITC and CD206-APC expressions. Error bar represents the mean ± SEM of five mice analyzed. Statistical analysis was performed using one-way ANOVA (**p < 0.01). BALF bronchoalveolar lavage fluid, BLM bleomycin, TGF-β1 transforming growth factor β1.
Fig. 4
Fig. 4. Depletion of macrophages abolishes the protective effect conferred by IL-24 deficiency on BLM-induced lung injury and fibrosis.
a A schematic diagram for the macrophage depletion. Macrophages were depleted by intratracheal injection of clodronate liposomes, and injection of PBS liposomes were served as the controls. b Clodronate liposomes efficiently depleted macrophages in the lungs; macrophages were almost undetectable in the BALF of clodronate liposomes-treated mice along with a significant reduction in total cell numbers, Scale bar, 25 μm. Error bars represent means ± SEM (n = 5). Statistical analysis was performed using the Student’s t test (**p < 0.01; ***p < 0.001). c Depletion of macrophages restored IL-24−/− mice with manifestations similar as WT mice following BLM induction, as evidenced by the comparable histological changes and Ashcroft scores. Left panel: representative results for H&E, Sirius red, and Masson staining. Scale bar, 50 μm. Right panel: a bar graph showing the semiquantitative Ashcroft scores for the severity of fibrosis. Error bars represent means ± SEM (n = 5). Statistical analysis was performed using one-way ANOVA (*p < 0.05; **p < 0.01). d Macrophage-depleted WT and IL-24−/− mice manifested comparable levels of collagen I and fibronectin expression in the lung following BLM induction. Error bar represents the mean ± SEM of five mice analyzed. Statistical analysis was performed using one-way ANOVA (*p < 0.05; **p < 0.01; ***p < 0.001). BALF bronchoalveolar lavage fluid, BLM bleomycin, Clo Lipo clodronate liposomes, Coll I collagen I, Fib fibronectin, WT wild type.
Fig. 5
Fig. 5. IL-24 deficiency protects mice against pulmonary fibrosis relies on the reduction of M2 macrophages.
a The schematic diagram for macrophage adoptive transfer studies. IL-4-induced WT M2 BMDMs were adoptively transferred into clodronate liposomes-treated or PBS liposomes-treated WT and IL-24−/− mice through intratracheal injection at day 7 of BLM induction. b Adoptive transfer of WT M2 macrophages into IL-24−/− mice restored their susceptibility to BLM-induced pulmonary fibrosis. Left panel: a representative result for H&E, Sirius red, and Masson staining, the images were taken under ×200 magnifications. Scale bar, 50 μm. Right panel displays the semiquantitative Ashcroft scores relevant to the severity of fibrosis. Error bars represent means ± SEM (n = 5). Statistical analysis was performed using one-way ANOVA. c Western blot results for analysis of collagen I and fibronectin expression in the lung homogenates from WT and IL-24−/− mice following adoptive transfer. Error bars represent means ± SEM (n = 5). Statistical analysis was performed using one-way ANOVA. M2 M2 macrophages, Clo clodronate liposomes, BLM bleomycin, Coll I collagen I, Fib fibronectin, WT wild type.
Fig. 6
Fig. 6. IL-24 deficiency attenuates the number of M2 macrophages in the lung of mice following BLM induction.
a Results for co-immunostaining of IL-20Rβ and F4/80 in BLM-induced lung sections. IL-20Rβ was significantly overexpressed in infiltrated macrophages. Scale bar, 50 μm. Error bar represents the mean ± SEM of 12 mice analyzed. Statistical analysis was performed using one-way ANOVA (***p < 0.001). b Flow cytometry analysis of IL-20Rβ and F4/80 expression in lung single-cell suspensions in both BLM induced WT and IL-24−/− mice. Left panel: a scatter diagram for flow cytometry analysis. Right panel: a bar graph showing the data with five mice analyzed. The L-20Rβ FITC+ and F4/80-PerCP/Cy5.5+ cells were gated from CD206-APC+/CD11b-PE/Cy7+ cells. Error bar represents the mean ± SEM of five mice analyzed. Statistical analysis was performed using one-way ANOVA (**p < 0.01). c Co-immunostaining of Arg-1 and F4/80 in the lung sections. Scale bar, 50 μm. Error bar represents the mean ± SEM of 12 mice analyzed. Statistical analysis was performed using one-way ANOVA (***p < 0.001). d Flow cytometry analysis of the number of M2 macrophage in the lung single-cell suspensions from both BLM induced WT and IL-24−/− mice. Left panel: a scatter diagram for flow cytometry analysis. Right panel: a bar graph showing the data with five mice analyzed. CD206-APC+ and CD11c-PerCP/Cy5.5 cells were gated from the F4/80-PE and CD11b-PE/Cy7 two positive cells. Error bar represents the mean ± SEM of five mice analyzed. Statistical analysis was performed using one-way ANOVA (**p < 0.01). e Results for arginase-1 expression in the lung homogenates. Upper panel: a representative Western blot result. Lower panel: a bar graph showing the expression levels of arginase-1 in all mice examined for each group. Error bar represents the mean ± SEM of 12 mice analyzed. Statistical analysis was performed using one-way ANOVA (***p < 0.001). f Real-time PCR results for analysis of Fizz1 expression in the lung. g Real-time PCR analysis of Mgl-1 expression in the lung. Error bar represents the mean ± SEM of 12 mice analyzed. Statistical analysis was performed using one-way ANOVA (***p < 0.001). Arg-1 arginase-1, BLM bleomycin, Fizz1 Found in Inflammatory Zone-1, Mgl-1 Probable metabotropic glutamate receptor mgl-1.
Fig. 7
Fig. 7. IL-24 indirectly promotes the macrophage M2 program.
a Flow cytometry analysis of CD206 expression in BMDMs following stimulation with IL-4 with or without IL-24 co-stimulation. Left panel: a scatter diagram for flow cytometry analysis. Right panel: a bar graph showing the data of five mice analyzed. Error bar represents the mean ± SEM of five mice analyzed. Statistical analysis was performed using one-way ANOVA (***p < 0.001). b Results for arginase-1 expression in BMDMs following stimulation with IL-4 with in the presence or absence IL-24 co-stimulation. Error bar represents the mean ± SEM of five mice analyzed. Statistical analysis was performed using one-way ANOVA (***p < 0.001). Real-time PCR results for analysis of Fizz1 (c) and Mgl-1 (d) expression in BMDMs following stimulation with IL-4, IL-24, and IL-24/IL-4, respectively. Each bar represents the mean ± SEM of five mice analyzed. Statistical analysis was performed using one-way ANOVA (***p < 0.001). Arg-1 arginase-1, Fizz1 Found in Inflammatory Zone-1, Mgl-1 Probable metabotropic glutamate receptor mgl-1.
Fig. 8
Fig. 8. The impact of IL-24 on IL-4-stimulated STAT6/PPAR-γ signaling and SOCS1/3 expression in macrophages.
a IL-24 promoted IL-4-induced STAT6/PPAR-γ signaling. Upper panel: representative Western blot results for STAT6, p-STAT6, and PPAR-γ at different time points stimulated with IL-4 and IL-24/IL-4. Lower panel: figures showing the data with five mice analyzed. Statistical analysis was performed using one-way ANOVA (**p < 0.01; ***p < 0.001). b IL-24 indirectly repressed SOCS1/3 expression. Upper panel: representative Western blot results for SOCS1 and SOCS3 at the indicated time points following IL-4 and IL-24/IL-4 stimulation. Lower panel: figures showing the data with five mice studied. Statistical analysis was performed using one-way ANOVA (**p < 0.01; ***p < 0.001). c IL-24 did not affect MAPK (p38, ERK1/2, and JNK), Akt and PI3K signaling. PPAR-γ peroxisome proliferator-activated receptor gamma, p-STAT6 phosphorylated STAT6, SOCS1 and SOCS3 suppressor of cytokine signaling 1 and suppressor of cytokine signaling 3, STAT6 signal transducer and activator of transcription 6.

References

    1. Hutchinson J, Fogarty A, Hubbard R, McKeever T. Global incidence and mortality of idiopathic pulmonary fibrosis: a systematic review. Eur Respir J. 2015;46:795–806. - PubMed
    1. Hopkins RB, Burke N, Fell C, Dion G, Kolb M. Epidemiology and survival of idiopathic pulmonary fibrosis from national data in Canada. Eur Respir J. 2016;48:187–95. - PubMed
    1. Ley B, Collard HR, King TE., Jr Clinical course and prediction of survival in idiopathic pulmonary fibrosis. Am J Respir Crit Care Med. 2011;183:431–40. - PubMed
    1. Desai O, Winkler J, Minasyan M, Herzog EL. The role of immune and inflammatory cells in idiopathic pulmonary fibrosis. Front Med (Lausanne) 2018;5:43. - PMC - PubMed
    1. Richeldi L, Collard HR, Jones MG. Idiopathic pulmonary fibrosis. Lancet. 2017;389:1941–52. - PubMed

Publication types