

Managing the spread of disease with mobile phone data
- PMID: 33144750
- PMCID: PMC7561616
- DOI: 10.1016/j.jdeveco.2020.102559
Managing the spread of disease with mobile phone data
Abstract
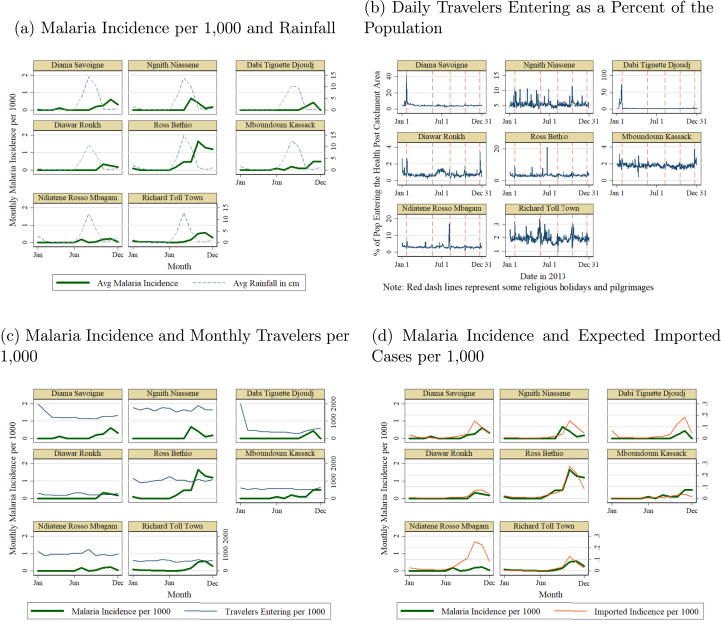
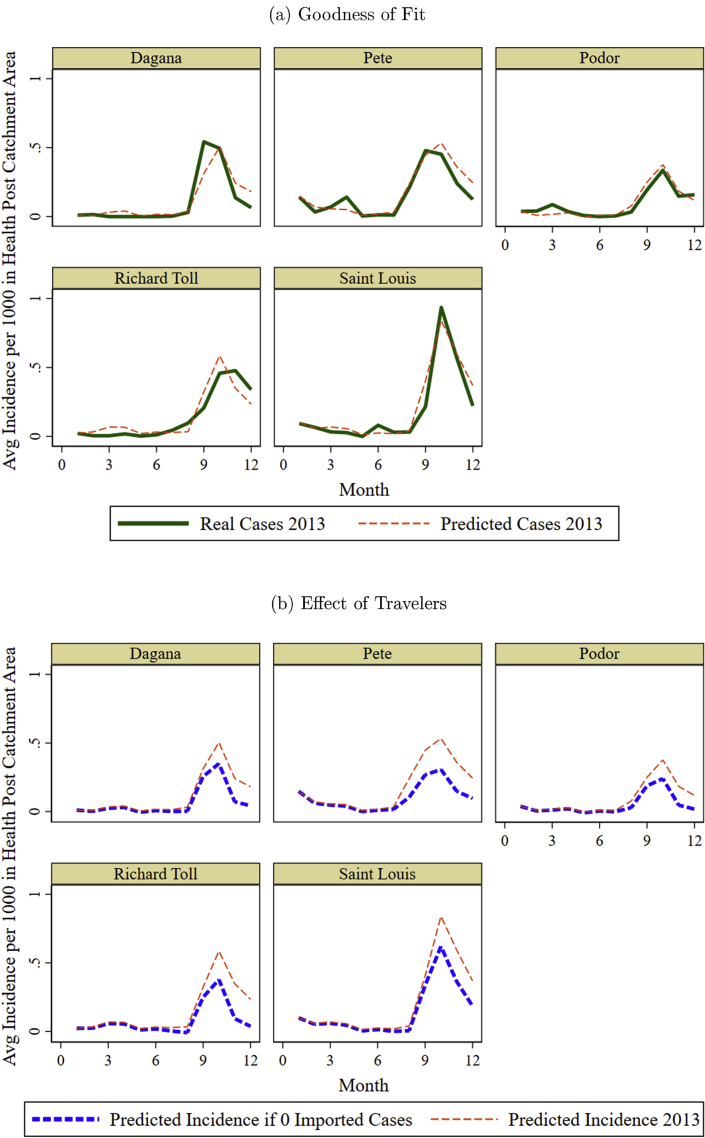
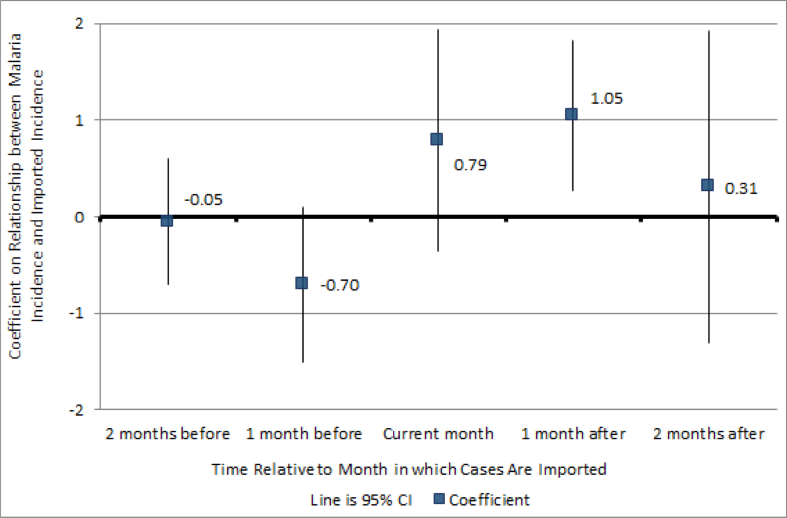
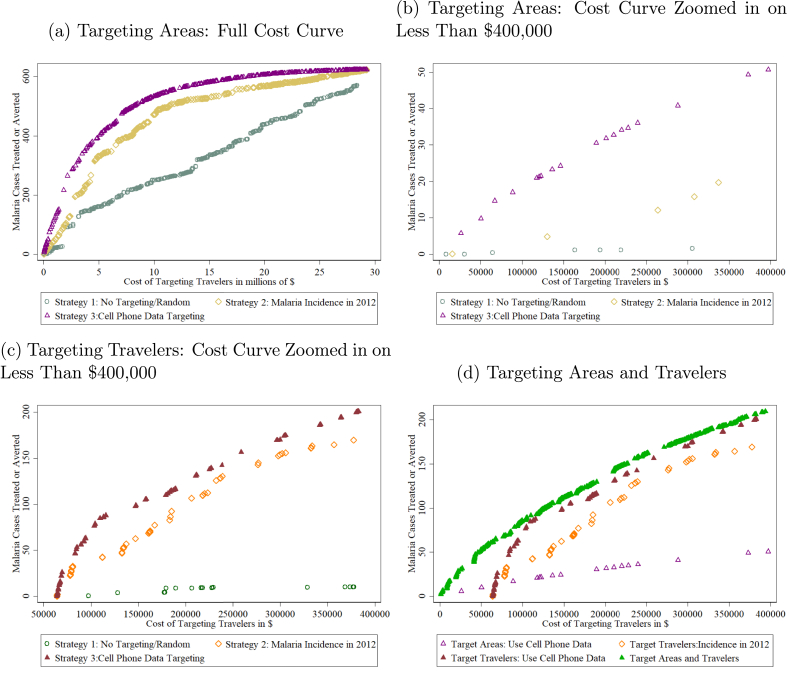
While human mobility has important benefits for economic growth, it can generate negative externalities. This paper studies the effect of mobility on the spread of disease in a low-incidence setting when people do not internalize their risks to others. Using malaria as a case study and 15 billion mobile phone records across nine million SIM cards, this paper quantifies the relationship between travel and the spread of disease. The estimates indicate that an infected traveler contributes to 1.66 additional cases reported in the health facility at the traveler's destination. This paper develops a simulation-based policy tool that uses mobile phone data to inform strategic targeting of travelers based on their origins and destinations. The simulations suggest that targeting informed by mobile phone data could reduce the caseload by 50 percent more than current strategies that rely only on previous incidence.
Keywords: Big data; Epidemics; Health; Mobile phones; Mobility; Public policy.
© 2020 The Author.
Figures
Similar articles
-
Surveillance for travel-related disease--GeoSentinel Surveillance System, United States, 1997-2011.MMWR Surveill Summ. 2013 Jul 19;62:1-23. MMWR Surveill Summ. 2013. PMID: 23863769
-
Using mobile phone data to predict the spatial spread of cholera.Sci Rep. 2015 Mar 9;5:8923. doi: 10.1038/srep08923. Sci Rep. 2015. PMID: 25747871 Free PMC article.
-
Quantifying seasonal population fluxes driving rubella transmission dynamics using mobile phone data.Proc Natl Acad Sci U S A. 2015 Sep 1;112(35):11114-9. doi: 10.1073/pnas.1423542112. Epub 2015 Aug 17. Proc Natl Acad Sci U S A. 2015. PMID: 26283349 Free PMC article.
-
Traveler's diarrhea: a clinical review.JAMA. 2015 Jan 6;313(1):71-80. doi: 10.1001/jama.2014.17006. JAMA. 2015. PMID: 25562268 Review.
-
[Assessment of travel-associated risks and advice to travelers].Rev Prat. 2007 Apr 30;57(8):831-42. Rev Prat. 2007. PMID: 17633600 Review. French.
Cited by
-
Ethical, Legal, and Sociocultural Issues in the Use of Mobile Technologies and Call Detail Records Data for Public Health in the East African Region: Scoping Review.Interact J Med Res. 2022 Jun 2;11(1):e35062. doi: 10.2196/35062. Interact J Med Res. 2022. PMID: 35533323 Free PMC article.
-
A stitch in time: The importance of water and sanitation services (WSS) infrastructure maintenance for cholera risk. A geospatial analysis in Harare, Zimbabwe.PLoS Negl Trop Dis. 2023 Jun 16;17(6):e0011353. doi: 10.1371/journal.pntd.0011353. eCollection 2023 Jun. PLoS Negl Trop Dis. 2023. PMID: 37327203 Free PMC article.
-
Adjusting mobile phone data to account for children's travel and the impact on measles dynamics in Zambia.Am J Epidemiol. 2025 Jun 3;194(6):1584-1594. doi: 10.1093/aje/kwae304. Am J Epidemiol. 2025. PMID: 39191642 Free PMC article.
-
Air pollution and mobility patterns in two Ugandan cities during COVID-19 mobility restrictions suggest the validity of air quality data as a measure for human mobility.Environ Sci Pollut Res Int. 2023 Mar;30(12):34856-34871. doi: 10.1007/s11356-022-24605-1. Epub 2022 Dec 15. Environ Sci Pollut Res Int. 2023. PMID: 36520281 Free PMC article.
-
Estimation of mobility and population in Spain during different phases of the COVID-19 pandemic from mobile phone data.Sci Rep. 2023 Jun 2;13(1):8962. doi: 10.1038/s41598-023-36108-1. Sci Rep. 2023. PMID: 37268712 Free PMC article.
References
-
- Adda Jérôme. Economic activity and the spread of viral diseases: evidence from high frequency data. Q. J. Econ. 2016;131(2):891–941.
-
- Adriansen Hanne Kirstine. Understanding pastoral mobility: the case of Senegalese fulani. Geogr. J. 2008;174(3):207–222.
-
- Agence Nationale de la Statistique et de la Démographie . 2014. Enquete a l’ecoute du Senegal 2014.
-
- Agence Nationale de la Statistique et de la Démographie . Rapport Definitif RGPHAE 2013. ANSD; 2014.
Grants and funding
LinkOut - more resources
Full Text Sources