

Review
doi: 10.1007/s41745-020-00200-6.
Epub 2020 Oct 30.
Mathematical Models for COVID-19 Pandemic: A Comparative Analysis
Affiliations
- PMID: 33144763
- PMCID: PMC7596173
- DOI: 10.1007/s41745-020-00200-6
Item in Clipboard
Review
Mathematical Models for COVID-19 Pandemic: A Comparative Analysis
J Indian Inst Sci.
2020.
Abstract
COVID-19 pandemic represents an unprecedented global health crisis in the last 100 years. Its economic, social and health impact continues to grow and is likely to end up as one of the worst global disasters since the 1918 pandemic and the World Wars. Mathematical models have played an important role in the ongoing crisis; they have been used to inform public policies and have been instrumental in many of the social distancing measures that were instituted worldwide. In this article, we review some of the important mathematical models used to support the ongoing planning and response efforts. These models differ in their use, their mathematical form and their scope.
© Indian Institute of Science 2020.
Figures
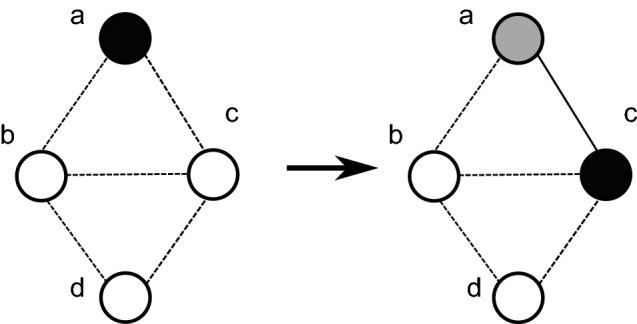
The SIR process on a graph. The contact graph is defined on a population . The node colors white, black and gray represent the Susceptible, Infected and Recovered states, respectively. Initially, only node a is infected, and all other nodes are susceptible. A possible outcome at is shown, in which node c becomes infected, while node a recovers. Node a tries to independently infect both its neighbors b and c, but only node c gets infected—this is indicated by the solid edge (a, c). The probability of getting this outcome is .
Update of
-
Models for COVID-19 Pandemic: A Comparative Analysis.ArXiv [Preprint]. 2020 Sep 21:arXiv:2009.10014v1. ArXiv. 2020. Update in: J Indian Inst Sci. 2020;100(4):793-807. doi: 10.1007/s41745-020-00200-6. PMID: 32995366 Free PMC article. Updated. Preprint.
References
-
- Adhikari B, Xu X, Ramakrishnan N, Prakash BA (2019) Epideep: exploiting embeddings for epidemic forecasting. In: Proceedings of the 25th ACM SIGKDD international conference on knowledge discovery and data mining, KDD ’19, pp 577–586, New York, NY, USA. Association for Computing Machinery
-
- Murray C (2020) Forecasting the impact of the first wave of the Covid-19 pandemic on hospital demand and deaths for the USA and European economic area countries. 04. 10.1101/2020.04.21.20074732
-
- Perone G. An ARIMA model to forecast the spread and the final size of Covid-2019 epidemic in Italy (first version on SSRN 31 march) SSRN Electron J. 2020 doi: 10.2139/ssrn.3564865. - DOI
Publication types
Grants and funding
LinkOut - more resources
Full Text Sources