. 2020 May 31;9(1):1769373.
doi: 10.1080/20013078.2020.1769373.

Triple knockdown of CDC37, HSP90-alpha and HSP90-beta diminishes extracellular vesicles-driven malignancy events and macrophage M2 polarization in oral cancer

Affiliations

Triple knockdown of CDC37, HSP90-alpha and HSP90-beta diminishes extracellular vesicles-driven malignancy events and macrophage M2 polarization in oral cancer

Kisho Ono et al. J Extracell Vesicles. .

Abstract

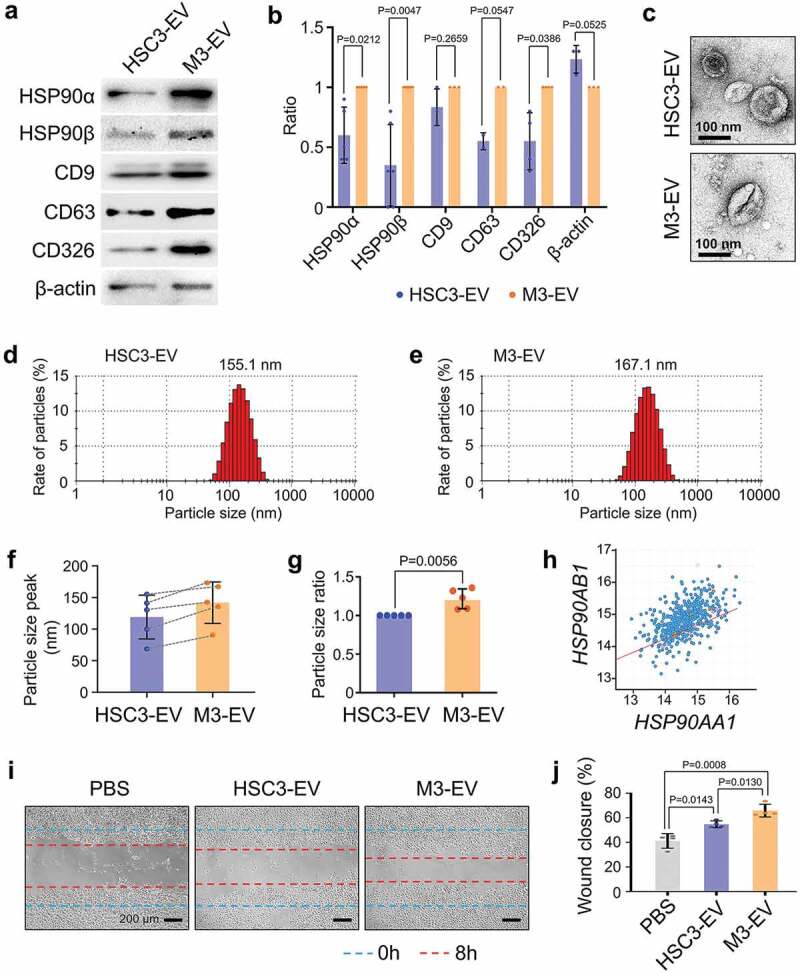
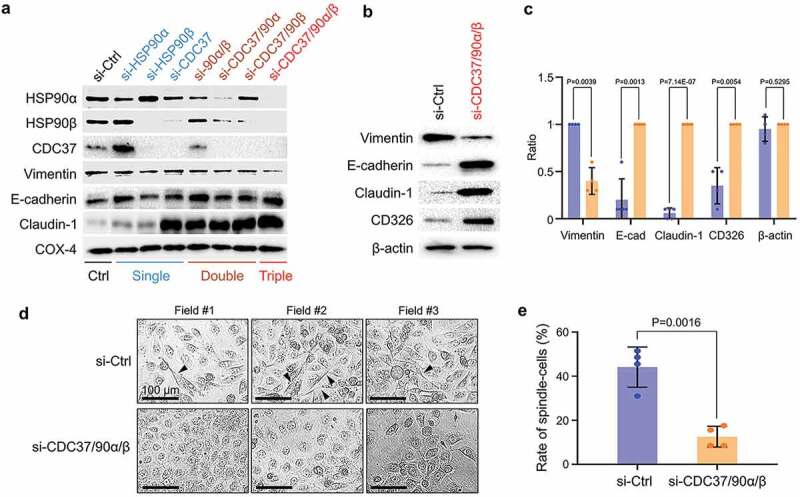
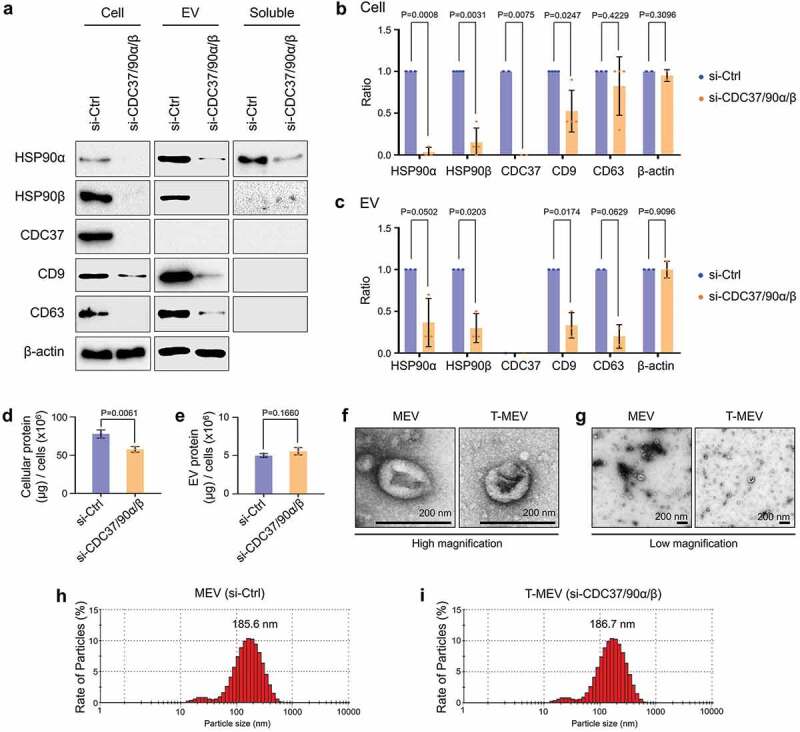
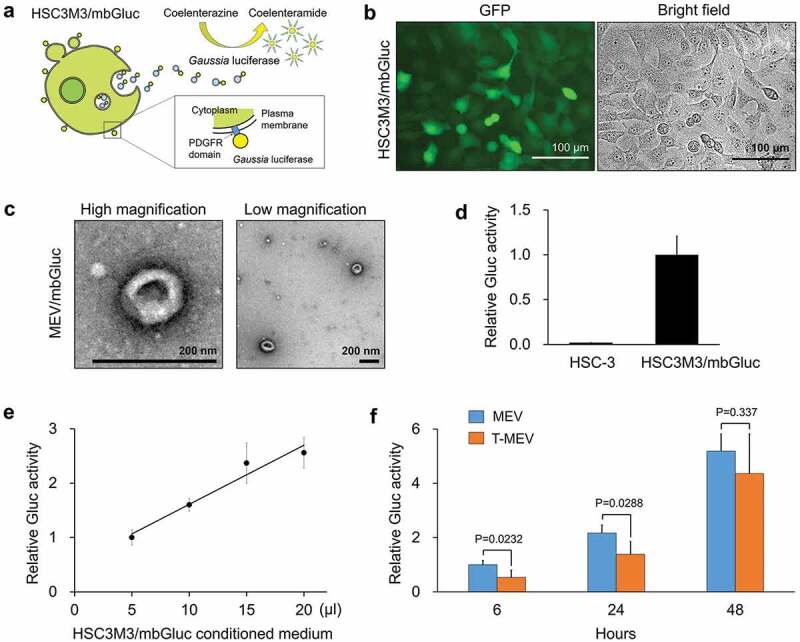
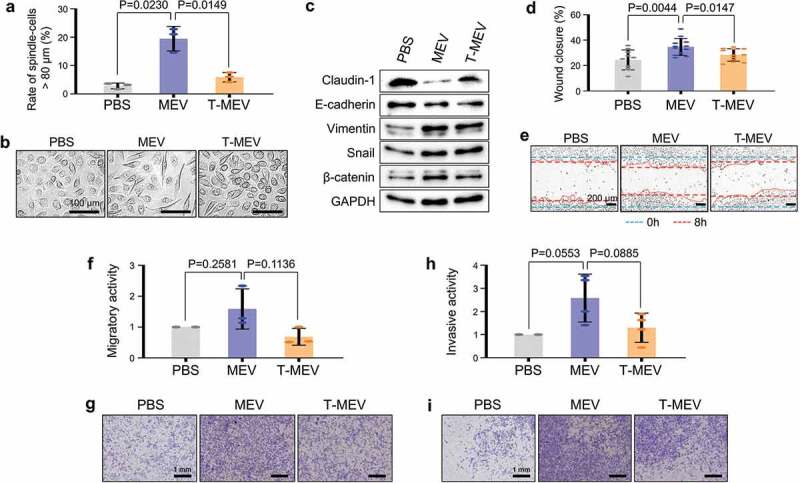
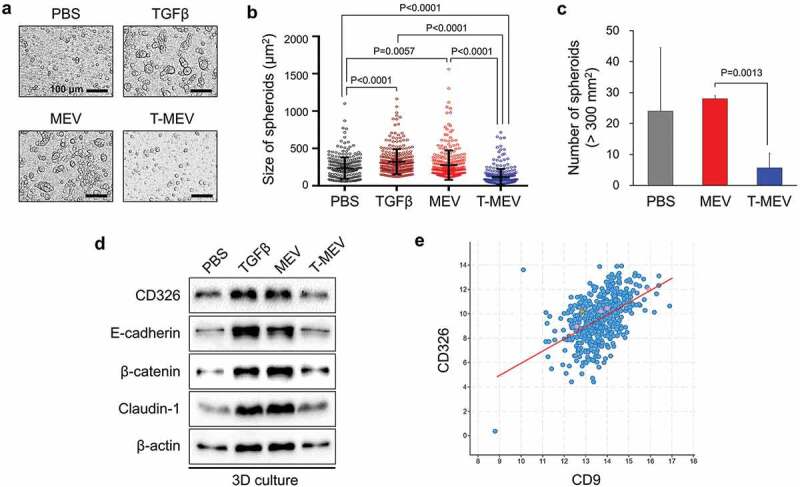
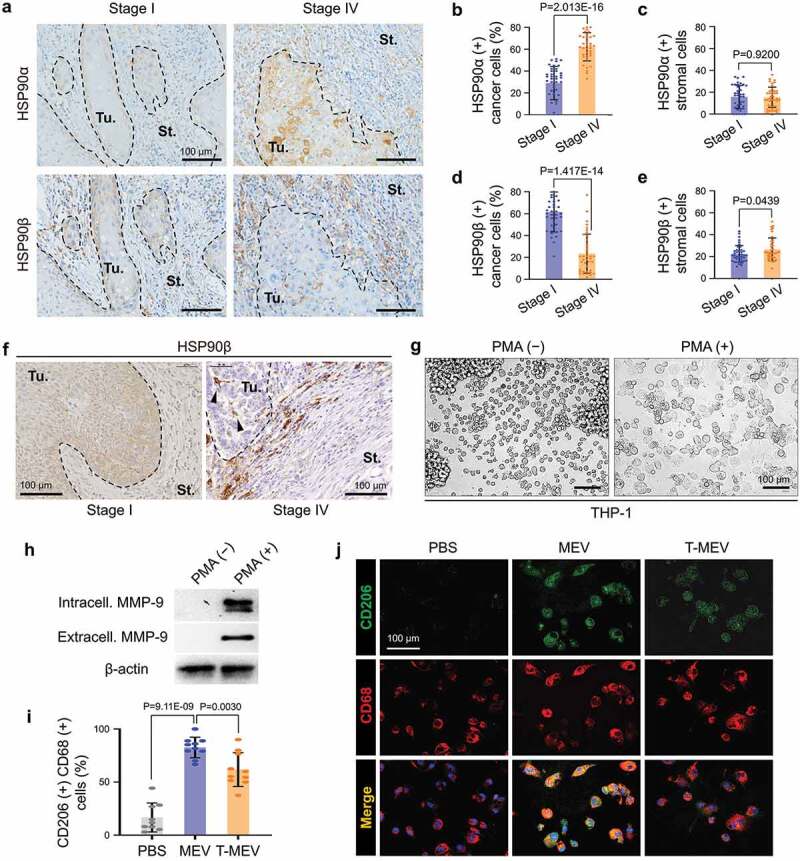
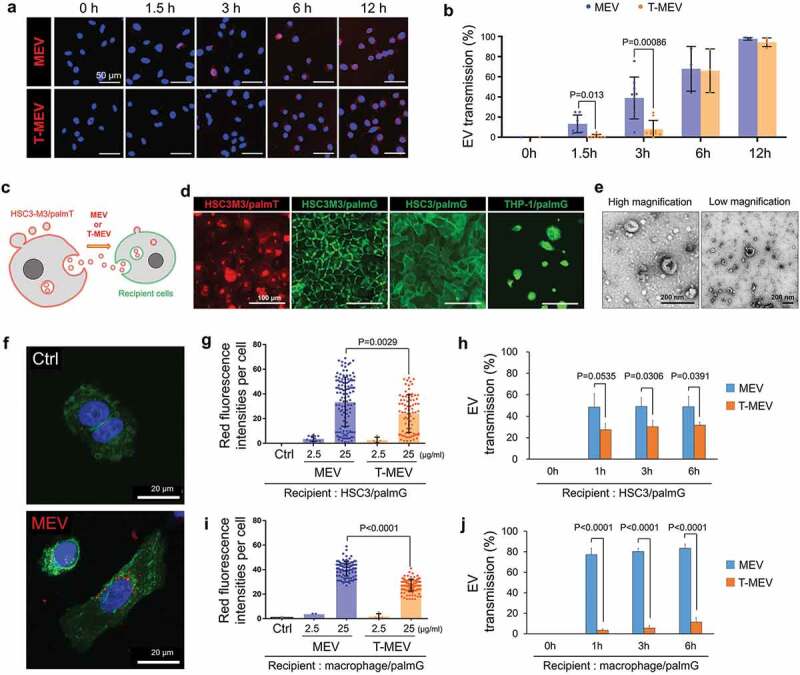
Evidence has been accumulating to indicate that extracellular vesicles (EVs), including exosomes, released by cancer cells can foster tumour progression. The molecular chaperones - CDC37, HSP90α and HSP90β play key roles in cancer progression including epithelial-mesenchymal transition (EMT), although their contribution to EVs-mediated cell-cell communication in tumour microenvironment has not been thoroughly examined. Here we show that triple depletion of the chaperone trio attenuates numerous cancer malignancy events exerted through EV release. Metastatic oral cancer-derived EVs (MEV) were enriched with HSP90α HSP90β and cancer-initiating cell marker CD326/EpCAM. Depletion of these chaperones individually induced compensatory increases in the other chaperones, whereas triple siRNA targeting of these molecules markedly diminished the levels of the chaperone trio and attenuated EMT. MEV were potent agents in initiating EMT in normal epithelial cells, a process that was attenuated by the triple chaperone depletion. The migration, invasion, and in vitro tumour initiation of oral cancer cells were significantly promoted by MEV, while triple depletion of CDC37/HSP90α/β reversed these MEV-driven malignancy events. In metastatic oral cancer patient-derived tumours, HSP90β was significantly accumulated in infiltrating tumour-associated macrophages (TAM) as compared to lower grade oral cancer cases. HSP90-enriched MEV-induced TAM polarization to an M2 phenotype, a transition known to support cancer progression, whereas the triple chaperone depletion attenuated this effect. Mechanistically, the triple chaperone depletion in metastatic oral cancer cells effectively reduced MEV transmission into macrophages. Hence, siRNA-mediated knockdown of the chaperone trio (CDC37/HSP90α/HSP90β) could potentially be a novel therapeutic strategy to attenuate several EV-driven malignancy events in the tumour microenvironment.

Abbreviations: CDC37: cell division control 37; EMT: epithelial-mesenchymal transmission; EV: extracellular vesicles; HNSCC: head and neck squamous cell carcinoma; HSP90: heat shock protein 90; TAM: tumour-associated macrophage.

Keywords: CDC37; Extracellular vesicles; HSP90; epithelial-mesenchymal transition; oral cancer; tetraspanin; tumour-associated macrophage.


Figures

Figure 1.
Figure 1.
Different characters of high- and low-metastatic oral cancer-derived EVs. (a) Western blotting showing HSP90α, HSP90β, tetraspanins (CD9, CD63), and CD326 in HSC-3-derived EVs (HSC3-EV) and HSC-3-M3-derived EVs (M3-EV). Similar data were obtained from three independent experiments. (b) Column scatters plotting to compare protein levels in HSC3-EV vs. M3-EV. Relative band intensities of Western blotting were plotted. (c) Representative TEM images of HSC3-EV and M3-EV. Scale bars, 100 nm. (d,e) Representative particle diameter distribution of (d) HSC3-EV and (e) M3-EV. (f) EV size peaks from five independent experiments. Dotted lines indicate the same sets of experiments. (g) The ratio of EV size peaks. (h) Scatter plot showing co-expression correlation between HSP90AA1 and HSP90AB1 in HNSCC. A regression line was shown in red. Data were represented as log2. The data set of head and neck squamous cell carcinoma (HNSCC) with 523 patient-derived 523 samples (TCGA, Pan-Cancer Atlas) was analysed using cBioPortal. (i,j) Wound healing assay of HSC-3 cells treated with PBS, HSC3-EV or M3-EV. (i) Representative images at 8 h after the wounding. --- (blue) initial wounds. --- (red) closed wounds at 8 h. Scale bars, 200 μm. (j) Rate of the wound closure. n = 4.
Figure 2.
Figure 2.
The siRNA-mediated knockdown of CDC37/HSP90α/HSP90β diminishes the EMT phenotype in metastatic oral cancer cells. (a) Representative Western blotting showing HSP90α, HSP90β, CDC37, and EMT markers. HSC-3-M3 cells were transfected with siRNAs targeting CDC37, HSP90α and/or HSP90β or non-targeting siRNA (si-Ctrl) for 48 h. COX4, loading control. Similar data were obtained from two independent experiments. (b–e) Anti-EMT effect of triple chaperone knockdown. HSC-3-M3 cells were transfected with siRNAs targeting CDC37/HSP90α/HSP90β or si-Ctrl. Medium was replaced with serum-free one at 24 h post-transfection. Cells were further cultured 48 h prior to protein sampling and photo taking. (b) Western blotting showing EMT markers. β-actin, loading control. Similar data were obtained from four independent experiments. (c) Alteration of EMT markers. The band intensities of Western blotting were quantified. (d,e) Morphological analysis of EMT. (d) Representative photomicrographs of HSC-3-M3 cells transfected with siRNA. Arrowheads indicate spindle-shaped cells. Scale bars, 100 μm. Similar data were obtained from three independent experiments. (e) Rates of spindle-shaped cells. Spindle shaped cells were defined as the cells with more than two-fold length/width ratio. n = 4 random fields.
Figure 3.
Figure 3.
Triple knockdown of CDC37/HSP90α/HSP90β inhibits proteostasis and alters properties of EVs. HSC-3-M3 cells were transfected with non-targeting siRNA (si-Ctrl) or siRNA mixture targeting CDC37, HSP90α, and HSP90β (si-CDC37/90α/β). Medium was replaced with serum-free one at 24 h post-transfection. Cell lysates, EV and non-EV soluble fractions of culture supernatants were collected at 48 h post-medium change. (a) Representative Western blotting showing HSP90, CDC37, CD9, CD63 and β-actin. (b,c) Column scatters plotting to compare protein levels between si-Ctrl vs. si-CDC37/90α/β groups in cells (b) and EVs (c). Relative band intensities of Western blotting were plotted. (d,e) Protein quantification of the whole cell lysates and EV fractions. (d) Total cellular protein levels per 106 cells. n = 3. (e) Total EV protein levels per 106 cells. n = 3. (f,g) Representative TEM images of EV fractions at (f) high and (g) low magnifications. Scale bars, 200 nm. (h,i) Particle diameter distribution of EV fractions from HSC-3-M3 transfected with si-Ctrl (h) or si-CDC37/90α/β (i), called MEV and T-MEV, respectively.
Figure 4.
Figure 4.
Triple knockdown of CDC37/HSP90α/β inhibited the release of membrane-bound Gaussia luciferase (mbGluc) reporter. The expression construct of mbGluc fused with the PDGFR transmembrane domain was stably transfected to HSC-3-M3 cells. GFP was co-expressed by an internal ribosomal entry sequence (IRES) for labelling the donor cells designated as HSC3M3/mbGluc. (a) Schemes showing a concept of Gluc-labelled EVs. (b) Representative images of HSC3M3/mbGluc cells. Left, an image of GFP-expressed HSC3M3/mbGluc cells. Right, a bright-field image. Scale bars, 100 μm. (c) A representative TEM images of mbGluc-MEV. Scale bars, 200 nm. (d, e) Establishment of mbGluc quantification. (d) Relative Gluc activities of 20 μL culture media of HSC-3 (as negative control) and HSC3M3/mbGluc cells. (e) A standard curve of Gluc activities. Culture media were prepared at 48 h after the medium change. (f) Relative Gluc activities of MEV and T-MEV. HSC3M3/mbGluc cells were transfected with control siRNA or si-CDC37/HSP90α/β for 24 h and then culture media were replaced with fresh ones. Gluc activities in the culture supernatants were measured at 6, 24 and 48 h after the medium changes. Values were normalized with the number of cells. n = 3.
Figure 5.
Figure 5.
Triple depletion of CDC37/HSP90α/HSP90β inhibited EV-driven malignancy events. (a-c) EMT levels altered by MEV and T-MEV. Epithelial cell line RT7 was treated with MEV, T-MEV or PBS. (a) Rate of spindle-shaped cells longer than 80 μm. n = 3. (b) Representative images of RT7 cells. Scale bars, 100 μm. (c) Western blotting showing EMT markers. (d,e) Wound healing assay. HSC-3 cells were treated with MEV, T-MEV or PBS. (d) Rate of wound closure. n = 12. (e) Representative photomicrographs of closing wounds. --- (blue) initial wounds. --- (red) closed wounds at 8 h. Scale bars, 200 μm. (f,g) Migration assay using a transwell system. (f) Migration activities of HSC-3 cells treated with MEV, T-MEV or PBS. n = 3. (g) Representative images of migrated cells. Cells were stained with Diff-Quik. Scale bars, 1 mm. (h,i) Invasion assay using Transwell system. (h) Invasion activities of HSC-3 cells treated with MEV, T-MEV or PBS. n = 3. (i) Representative images of invaded cells. Cells were stained with Diff-Quik. Scale bars, 1 mm.
Figure 6.
Figure 6.
Metastatic EVs promote tumorsphere formation, a property diminished by triple chaperone knockdown. (a–d) In vitro tumorigenesis assay in the three-dimensional (3D) culture system. HSC-3 cells were treated with MEX (50 μg/mL), T-MEX (50 μg/mL), TGFβ (5 ng/mL) or PBS in nano-culture plates and then (a–c) tumorsphere formation and (d) protein expression levels were examined. (a) Representative photomicrographs of tumorspheres. Scale bars, 100 μm. (b) Column scatter plotting showing tumorsphere size. The size of the top 300 tumorspheres was measured in each group using ArrayScan HCS System. The horizontal lines indicate mean ± SD analysed by ANOVA Turkey’s multiple comparisons test. (c) The number of tumorspheres altered by MEX or T-MEX. Tumorspheres larger than 200 mm2 were counted. n = 3, P = 0.0201. (d) Western blotting showing CD326/EpCAM, E-cadherin, β-catenin, claudin-1 and β-actin. The cell lysates were prepared from the tumorspheres. (e) Scatter plot showing co-expression correlation between CD326/EpCAM and CD9 in head and neck squamous cell carcinoma (HNSCC). A regression line was shown in red. Data were represented as log2. The data set of HNSCC with 523 patient-derived 523 samples (TCGA, Pan-Cancer Atlas) was analysed.
Figure 7.
Figure 7.
Metastatic oral cancer-derived MEVs induced macrophages M2 polarization. (a–f) Immunohistochemistry (IHC) of oral cancer patient-derived specimens. (a) Representative IHC showing HSP90α and HSP90β in stage I vs. stage IV oral cancers. Tu, tumour. St, stroma. --- borders between tumour and stroma. (b–e) Rate of (b,c) HSP90α+ or (d,e) HSP90β+ cancer cells or stromal cells. The rates were calculated by counting immuno-positive cells per total cell number in each random field in (b,d) tumour areas or (c,e) 100 mm2 stromal areas. Five random fields each in 8 oral cancer cases. N = 40. (f) IHC for HSP90β in stage I vs. stage IV oral cancer. Arrowheads, HSP90β-positive infiltrating tumour-associated macrophages (TAM). (g–j) Macrophage M2 polarity was altered by MEV and T-MEV. THP-1 cells were stimulated with PMA for the differentiation to macrophages and then treated with MEV, T-MEV (25 μg/mL) or PBS. (g) Representative images of THP-1 cells treated with or without PMA for 24 h. (h) Western blotting of extracellular and intracellular MMP-9 in THP-1 cells with or without PMA treatment. (i,j) Immunocytochemistry of macrophage markers with or without MEV or T-MEV. (i) Rate of CD206/CD68 double-positive M2-like macrophages. N = 9. (j) Representative staining images of CD206 (green) and CD68 (red). Blue, DAPI. Scale bars, 100 μm.
Figure 8.
Figure 8.
Triple knockdown of CDC37/HSP90α/HSP90β attenuates EV transmission potential into recipient macrophages and cancer cells. (a,b) Transmission of MEV and T-MEV into recipient HSC-3 cells. MEV was prepared from the culture supernatant of HSC-3-M3 transfected with si-Ctrl. T-MEV was prepared from the culture supernatant of HSC-3-M3 transfected with si-CDC37/90α/β. MEV and T-MEV were labelled with red-fluorescent ceramide and added to the culture media of HSC-3 cells. Cells were fixed at the indicated incubation period and analysed under fluorescent microscopy. (a) Representative images of vesicular transmission. Scale bars, 50 μm. Blue, DAPI staining. (b) The rate of EV transmission per total cells. N = 3. (c-j) Monitoring EVs labelled with membrane-bound palmitoylation (palm) signal-fused fluorescent proteins. (c) A scheme of the concept of fluorescent EV transmission. (d) Representative fluorescent images of HSC3M3/palmT, HSC3M3/palmG, HSC3/palmG and THP1/palmG cells. THP1/palmG was stimulated with PMA. Scale bars, 100 μm. (e) Representative TEM images of MEV released by HSC3M3/palmT cells. Scale bars, 200 nm. (f) Confocal laser scanning microscopy of HSC3/palmG cells treated with or without palmT-MEV. MEV (red) were prepared from culture media of HSC3 M3/palmT cells and added to the culture media of HSC3/palmG cells (green). Blue, DAPI staining. Scale bars, 20 μm. (g–j) MEV transmission rate into (g,h) HSC3/palmG cells or (i,j) THP1/palmG macrophages. For macrophage differentiation, THP1/palmG cells were stimulated with PMA. (g,i) Column scatters plotting of MEV transmission. The values indicate palmT fluorescence intensity per cell at 1 h after the addition of MEV or T-MEV. The upper end of each column indicates mean. (h,j) Transmission efficiencies of MEV vs. T-MEV into (h) HSC3/palmG cells and (j) THP1/palmG-derived macrophages. n = 3.
Figure 9.
Figure 9.
Graphical abstract. (a) Metastatic oral cancer cells secreted HSP90-high EVs transmitting to recipient cells. Metastatic oral cancer-EVs initiated EMT in normal epithelial cells and promoted migration, invasion, and tumorigenesis in oral cancer cells and M2-like polarity in tumour-associated macrophages. (b) The siRNAs-mediated triple silencing of CDC37/HSP90α/HSP90β diminished EMT markers in oral cancer cells. The HSP90-depleted EVs-reduced activities for transmission and pro-malignancy in recipient cells.

Similar articles

Cited by

References

    1. Thery C, Witwer KW, Aikawa E, et al. Minimal information for studies of extracellular vesicles 2018 (MISEV2018): a position statement of the international society for extracellular vesicles and update of the MISEV2014 guidelines. J Extracell Vesicles. 2018;7(1):1535750. - PMC - PubMed
    1. Colombo M, Raposo G, Thery C.. Biogenesis, secretion, and intercellular interactions of exosomes and other extracellular vesicles. Annu Rev Cell Dev Biol. 2014;30:255–21. - PubMed
    1. van Niel G, D’Angelo G, Raposo G. Shedding light on the cell biology of extracellular vesicles. Nat Rev Mol Cell Biol. 2018. April;19(4):213–228. - PubMed
    1. Seyama M, Yoshida K, Yoshida K, et al. Outer membrane vesicles of Porphyromonas gingivalis attenuate insulin sensitivity by delivering gingipains to the liver. Biochim Biophys Acta Mol Basis Dis. 2020. February 20;1866(6):1–12. - PubMed
    1. Okusha Y, Eguchi T, Tran MT, et al. Extracellular vesicles enriched with moonlighting metalloproteinase are highly transmissive, pro-tumorigenic, and trans-activates cellular communication network factor (CCN2/CTGF): CRISPR against cancer. Cancers (Basel). 2020;12(4):1–27. - PMC - PubMed

LinkOut - more resources