

Unidirectional response to bidirectional selection on body size II. Quantitative genetics
- PMID: 33144977
- PMCID: PMC7593195
- DOI: 10.1002/ece3.6783
Unidirectional response to bidirectional selection on body size II. Quantitative genetics
Abstract
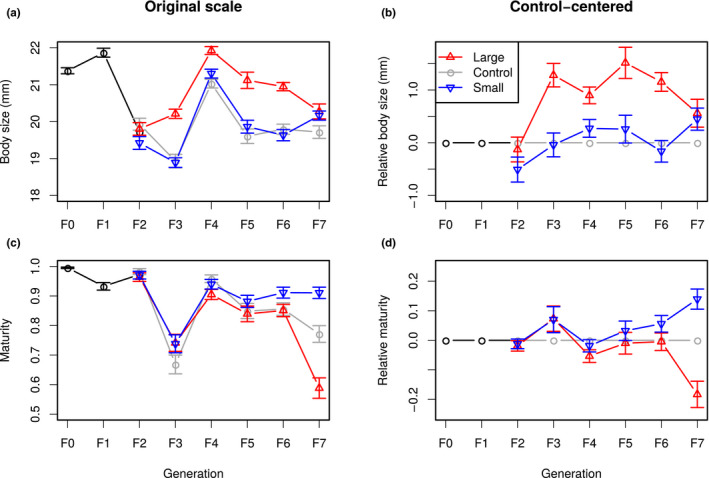
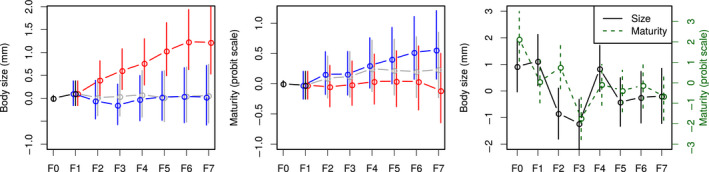
Anticipating the genetic and phenotypic changes induced by natural or artificial selection requires reliable estimates of trait evolvabilities (genetic variances and covariances). However, whether or not multivariate quantitative genetics models are able to predict precisely the evolution of traits of interest, especially fitness-related, life history traits, remains an open empirical question. Here, we assessed to what extent the response to bivariate artificial selection on both body size and maturity in the medaka Oryzias latipes, a model fish species, fits the theoretical predictions. Three lines (Large, Small, and Control lines) were differentially selected for body length at 75 days of age, conditional on maturity. As maturity and body size were phenotypically correlated, this selection procedure generated a bi-dimensional selection pattern on two life history traits. After removal of nonheritable trends and noise with a random effect ("animal") model, the observed selection response did not match the expected bidirectional response. For body size, Large and Control lines responded along selection gradients (larger body size and stasis, respectively), but, surprisingly, the Small did not evolve a smaller body length and remained identical to the Control line throughout the experiment. The magnitude of the empirical response was smaller than the theoretical prediction in both selected directions. For maturity, the response was opposite to the expectation (the Large line evolved late maturity compared to the Control line, while the Small line evolved early maturity, while the opposite pattern was predicted due to the strong positive genetic correlation between both traits). The mismatch between predicted and observed response was substantial and could not be explained by usual sources of uncertainties (including sampling effects, genetic drift, and error in G matrix estimates).
Keywords: Bayesian mixed models; G matrix; animal model; artificial selection; asymmetric response; bivariate selection; evolvability.
© 2020 The Authors. Ecology and Evolution published by John Wiley & Sons Ltd.
Conflict of interest statement
The authors declare no competing financial and/or nonfinancial interests.
Figures


Similar articles
-
Unidirectional response to bidirectional selection on body size. I. Phenotypic, life-history, and endocrine responses.Ecol Evol. 2020 Sep 13;10(19):10571-10592. doi: 10.1002/ece3.6713. eCollection 2020 Oct. Ecol Evol. 2020. PMID: 33072281 Free PMC article.
-
The mutation matrix and the evolution of evolvability.Evolution. 2007 Apr;61(4):727-45. doi: 10.1111/j.1558-5646.2007.00071.x. Evolution. 2007. PMID: 17439608
-
Selection for small body size favours contrasting sex-specific life histories, boldness and feeding in medaka, Oryzias latipes.BMC Evol Biol. 2019 Jun 19;19(1):127. doi: 10.1186/s12862-019-1460-x. BMC Evol Biol. 2019. PMID: 31216987 Free PMC article.
-
The evolution of the G matrix: selection or drift?Heredity (Edinb). 2000 Feb;84 ( Pt 2):135-42. doi: 10.1046/j.1365-2540.2000.00695.x. Heredity (Edinb). 2000. PMID: 10762382 Review.
-
Phenotypic plasticity and experimental evolution.J Exp Biol. 2006 Jun;209(Pt 12):2344-61. doi: 10.1242/jeb.02244. J Exp Biol. 2006. PMID: 16731811 Review.
Cited by
-
Unidirectional response to bidirectional selection on body size. I. Phenotypic, life-history, and endocrine responses.Ecol Evol. 2020 Sep 13;10(19):10571-10592. doi: 10.1002/ece3.6713. eCollection 2020 Oct. Ecol Evol. 2020. PMID: 33072281 Free PMC article.
-
Ecological ramifications of adaptation to size-selective mortality.R Soc Open Sci. 2021 Oct 6;8(10):210842. doi: 10.1098/rsos.210842. eCollection 2021 Oct. R Soc Open Sci. 2021. PMID: 34754498 Free PMC article.
-
A method to predict the response to directional selection using a Kalman filter.Proc Natl Acad Sci U S A. 2022 Jul 12;119(28):e2117916119. doi: 10.1073/pnas.2117916119. Epub 2022 Jul 6. Proc Natl Acad Sci U S A. 2022. PMID: 35867739 Free PMC article.
-
Genomic prediction of growth in a commercially, recreationally, and culturally important marine resource, the Australian snapper (Chrysophrys auratus).G3 (Bethesda). 2022 Mar 4;12(3):jkac015. doi: 10.1093/g3journal/jkac015. G3 (Bethesda). 2022. PMID: 35100370 Free PMC article.
References
-
- Alvarez, I. , Niemi, J. , & Simpson, M. (2014). Bayesian inference for a covariance matrix. arXiv, 1408.4050.
LinkOut - more resources
Full Text Sources
Research Materials
