

Feral populations of Brassica oleracea along Atlantic coasts in western Europe
- PMID: 33145003
- PMCID: PMC7593181
- DOI: 10.1002/ece3.6821
Feral populations of Brassica oleracea along Atlantic coasts in western Europe
Abstract
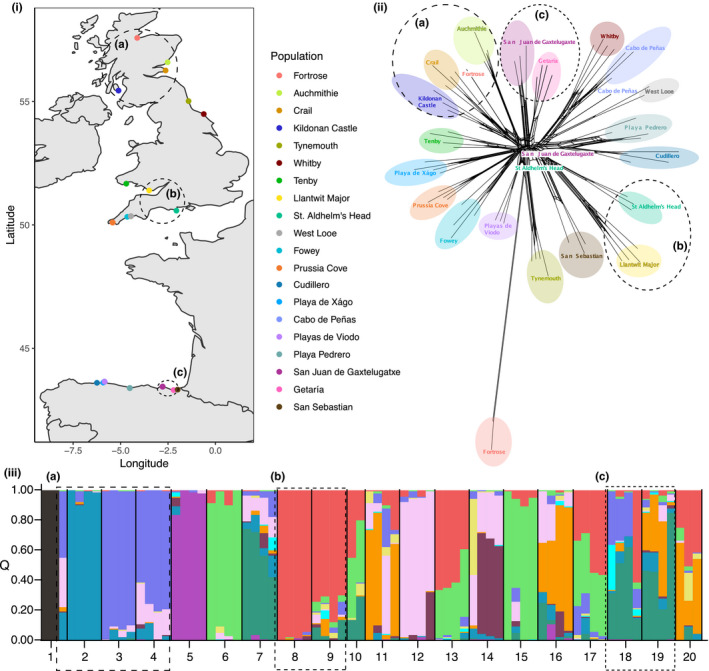
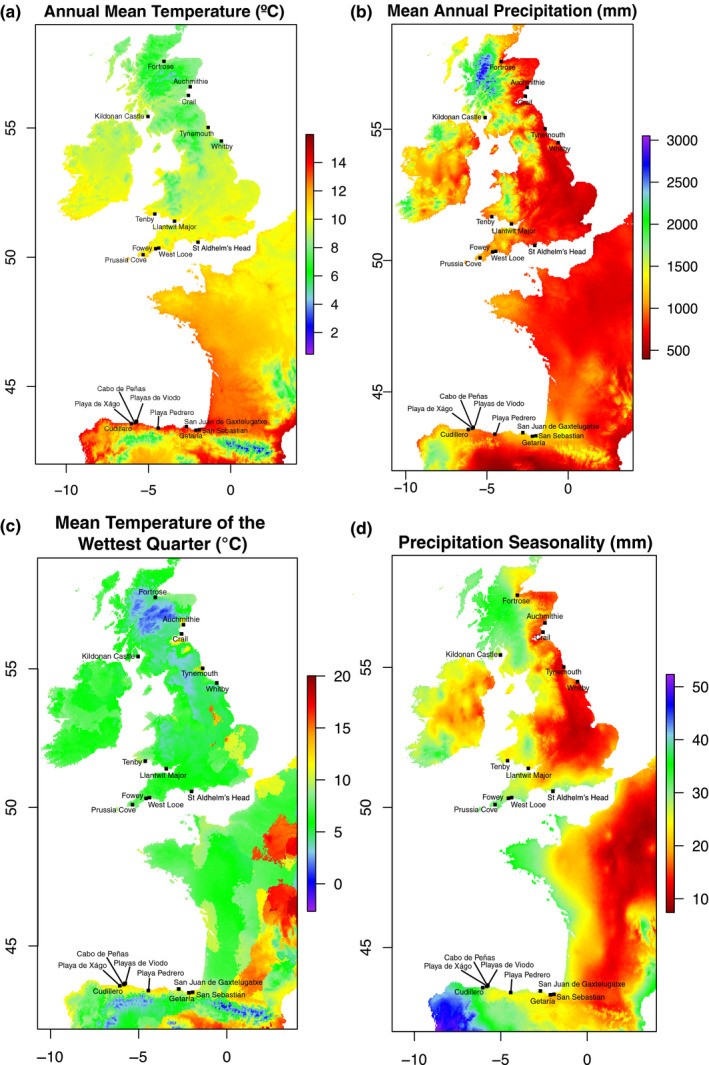
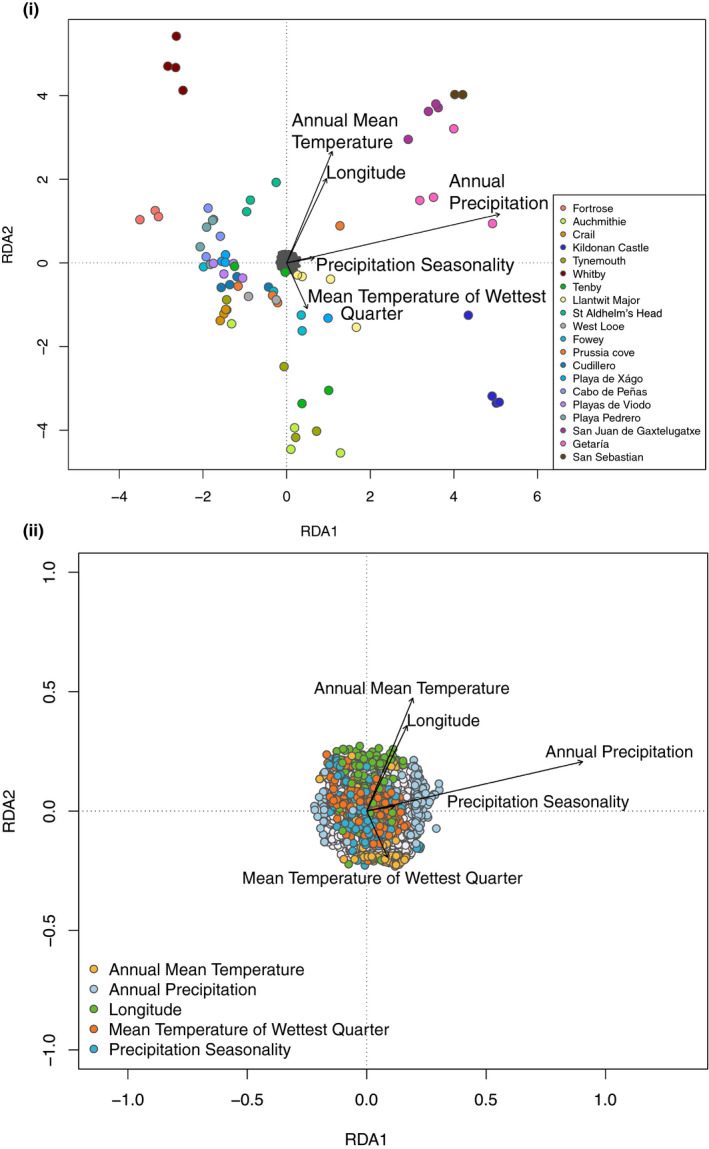
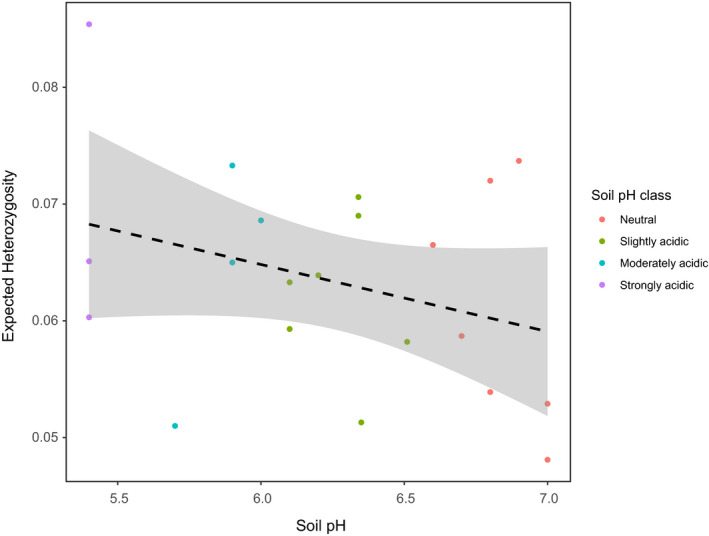
There has been growing emphasis on the role that crop wild relatives might play in supporting highly selected agriculturally valuable species in the face of climate change. In species that were domesticated many thousands of years ago, distinguishing wild populations from escaped feral forms can be challenging, but reintroducing variation from either source could supplement current cultivated forms. For economically important cabbages (Brassicaceae: Brassica oleracea), "wild" populations occur throughout Europe but little is known about their genetic variation or potential as resources for breeding more resilient crop varieties. The main aim of this study was to characterize the population structure of geographically isolated wild cabbage populations along the coasts of the UK and Spain, including the Atlantic range edges. Double-digest restriction-site-associated DNA sequencing was used to sample individual cabbage genomes, assess the similarity of plants from 20 populations, and explore environment-genotype associations across varying climatic conditions. Interestingly, there were no indications of isolation by distance; several geographically close populations were genetically more distinct from each other than to distant populations. Furthermore, several distant populations shared genetic ancestry, which could indicate that they were established by escapees of similar source cultivars. However, there were signals of local adaptation to different environments, including a possible relationship between genetic diversity and soil pH. Overall, these results highlight wild cabbages in the Atlantic region as an important genetic resource worthy of further research into their relationship with existing crop varieties.
Keywords: Brassica oleracea; crop wild relatives; domestication; environment–genotype associations; feral populations; isolation by distance.
© 2020 The Authors. Ecology and Evolution published by John Wiley & Sons Ltd.
Conflict of interest statement
None declared.
Figures
Similar articles
-
The Evolutionary History of Wild, Domesticated, and Feral Brassica oleracea (Brassicaceae).Mol Biol Evol. 2021 Sep 27;38(10):4419-4434. doi: 10.1093/molbev/msab183. Mol Biol Evol. 2021. PMID: 34157722 Free PMC article.
-
Intraspecific diversification of the crop wild relative Brassica cretica Lam. using demographic model selection.BMC Genomics. 2020 Jan 14;21(1):48. doi: 10.1186/s12864-019-6439-x. BMC Genomics. 2020. PMID: 31937246 Free PMC article.
-
Brassica rapa Domestication: Untangling Wild and Feral Forms and Convergence of Crop Morphotypes.Mol Biol Evol. 2021 Jul 29;38(8):3358-3372. doi: 10.1093/molbev/msab108. Mol Biol Evol. 2021. PMID: 33930151 Free PMC article.
-
Prospects of Feral Crop De Novo Redomestication.Plant Cell Physiol. 2022 Nov 22;63(11):1641-1653. doi: 10.1093/pcp/pcac072. Plant Cell Physiol. 2022. PMID: 35639623 Review.
-
Australian Wild Rice Populations: A Key Resource for Global Food Security.Front Plant Sci. 2019 Oct 22;10:1354. doi: 10.3389/fpls.2019.01354. eCollection 2019. Front Plant Sci. 2019. PMID: 31695720 Free PMC article. Review.
Cited by
-
An Unexplored Diversity for Adaptation of Germination to High Temperatures in Brassica Species.Evol Appl. 2025 Mar 9;18(3):e70089. doi: 10.1111/eva.70089. eCollection 2025 Mar. Evol Appl. 2025. PMID: 40066327 Free PMC article.
-
The origins and spread of the opium poppy (Papaver somniferum L.) revealed by genomics and seed morphometrics.Philos Trans R Soc Lond B Biol Sci. 2025 May;380(1926):20240198. doi: 10.1098/rstb.2024.0198. Epub 2025 May 15. Philos Trans R Soc Lond B Biol Sci. 2025. PMID: 40370019 Free PMC article.
-
The Evolutionary History of Wild, Domesticated, and Feral Brassica oleracea (Brassicaceae).Mol Biol Evol. 2021 Sep 27;38(10):4419-4434. doi: 10.1093/molbev/msab183. Mol Biol Evol. 2021. PMID: 34157722 Free PMC article.
-
Extensive crop-wild hybridization during Brassica evolution and selection during the domestication and diversification of Brassica crops.Genetics. 2023 Apr 6;223(4):iyad027. doi: 10.1093/genetics/iyad027. Genetics. 2023. PMID: 36810660 Free PMC article.
References
-
- Allender, C. , Allainguillaume, J. , Lynn, J. , & King, G. J. (2007). Simple sequence repeats reveal uneven distribution of genetic diversity in chloroplast genomes of Brassica oleracea L. and (n= 9) wild relatives. Theoretical and Applied Genetics, 114(4), 609–618. - PubMed
-
- BGS (2018). British Geological Survey. http://www.bgs.ac.uk/. Accessed 26‐08‐2018.
-
- BSBI (2018). Botanical Society of Britain & Ireland. https://bsbi.org. Accessed 26‐08‐2018.
Grants and funding
LinkOut - more resources
Full Text Sources
