

Shifting workstyle to teleworking as a new normal in face of COVID-19: analysis with the model introducing intercity movement and behavioral pattern
- PMID: 33145275
- PMCID: PMC7576002
- DOI: 10.21037/atm-20-5334
Shifting workstyle to teleworking as a new normal in face of COVID-19: analysis with the model introducing intercity movement and behavioral pattern
Abstract
Background: Instead of the complete lockdown, since the outbreak of coronavirus disease 2019 (COVID-19), Japan has been trying to control the infection by self-restraint request policy. It seems that the number of infected people has subsided, however, the increasing human activities again in the resumption of economy may lead to the second wave of infections. Here, we analyzed the major factors behind the success control of the first outbreak in Japan and the potential risk of the second wave.
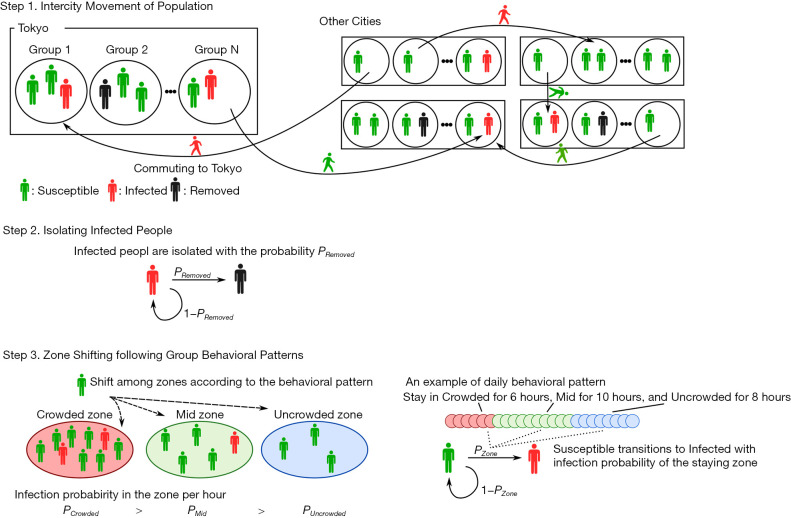
Methods: Employing a localized stochastic transition model, we analyze the real data and the results of simulation in Tokyo from March 1 to July 31. In the model, population is divided into three compartments: susceptible, infected, and removed; and area into three zones: crowded, mid and uncrowded. Different zones have different infection probabilities characterized by the number of people gathered there. The flow of the infection simulation in one day consists of three steps: (I) intercity movement of population, (II) isolating infected people, and (III) zone shifting following group behavioral patterns.
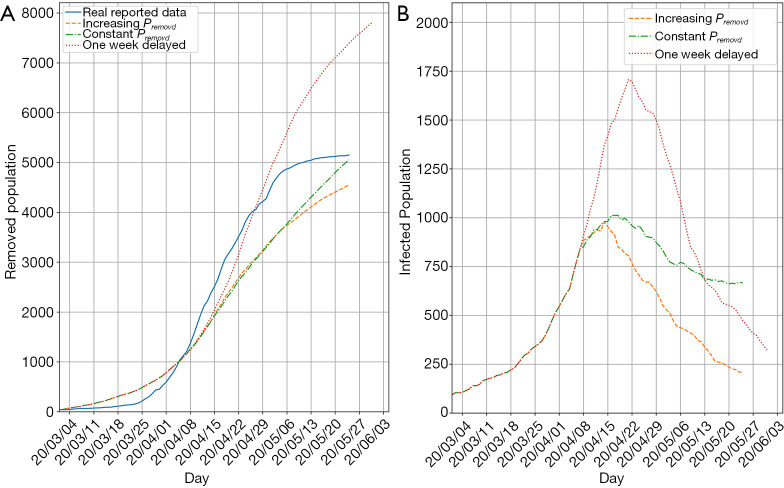
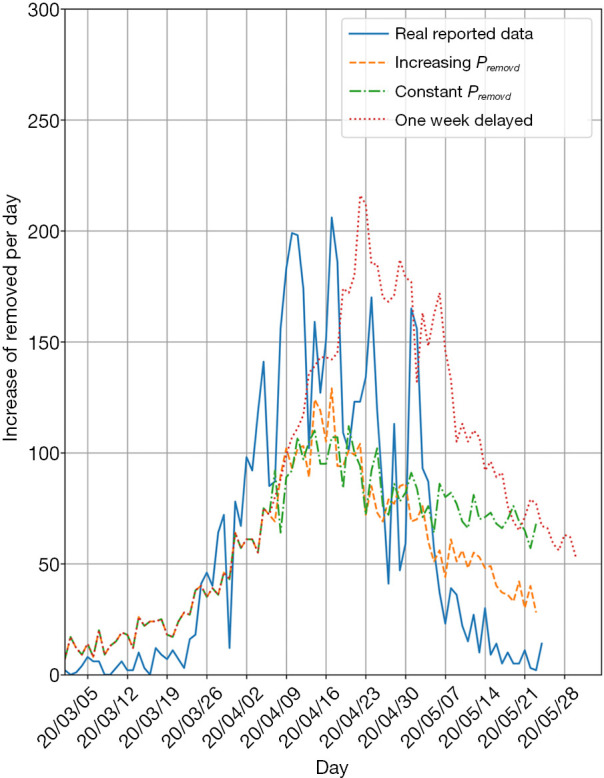
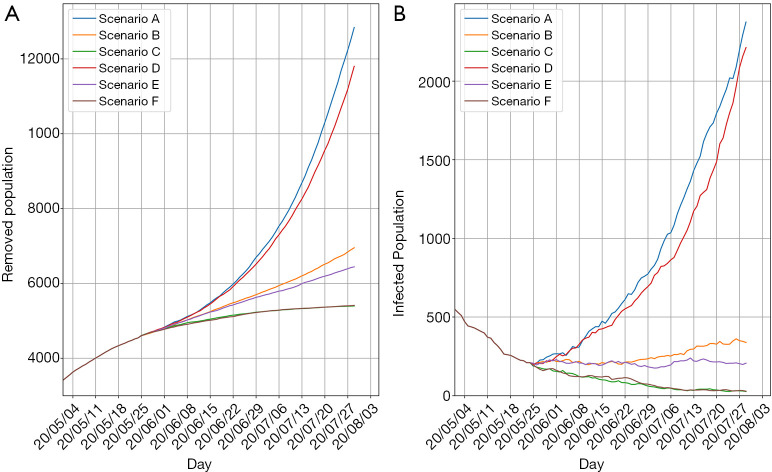
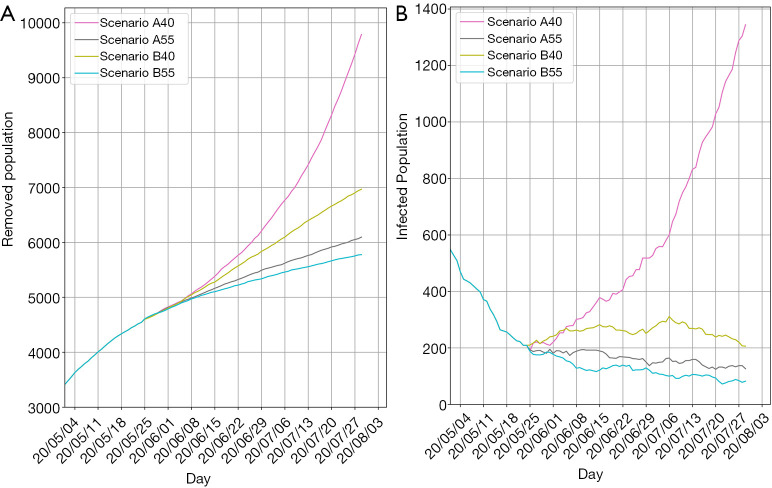
Results: The major cause for the success of controlling the first outbreak in Tokyo is demonstrated through our simulation to be the early request of self-restraint as well as the early detection of infected people. Meanwhile, the observation that the increasing human activities again in the resumption of economy will lead to the second wave of infections is also found in the simulation with an extended period. Based on the analysis of intercity movement and behavioral pattern on Tokyo where normally about 2.9 million people come from the surrounding cities to the central area by using the public railway system every day, results showed that turning the workstyle of 55% of working people ranging in age from 20 to 64 years old into teleworking (remote work) may control the spread of infection without significant economic damage. Meanwhile, to keep about 75% of the normal activity level and to advocate the shift to telework are indispensable because a sudden resumption of activity from the lockdown sate can rapidly spread infection.
Conclusions: As a new normal in face of COVID-19 for Tokyo and other cities that with a high population density, shifting the workstyle of 55% of working people to teleworking and to reduce 25% time staying in the high infection risk area could be an effective measure to control the spread of infection while maintaining a certain level of economic activity.
Keywords: Coronavirus disease 2019 (COVID-19); Japan; Tokyo; infection; modeling; susceptible-infected-removed (SIR); transmission.
2020 Annals of Translational Medicine. All rights reserved.
Conflict of interest statement
Conflicts of Interest: All authors have completed the ICMJE uniform disclosure form (available at http://dx.doi.org/10.21037/atm-20-5334). The authors have no conflicts of interest to declare.
Figures
Similar articles
-
Analysis of COVID-19 infection spread in Japan based on stochastic transition model.Biosci Trends. 2020 May 21;14(2):134-138. doi: 10.5582/bst.2020.01482. Epub 2020 Mar 19. Biosci Trends. 2020. PMID: 32188819
-
Workstyle change effects on physical activity and health consciousness in Japan: Results from COVID-19 lifestyle activity survey.Transp Res Interdiscip Perspect. 2022 Sep;15:100657. doi: 10.1016/j.trip.2022.100657. Epub 2022 Jul 21. Transp Res Interdiscip Perspect. 2022. PMID: 35959093 Free PMC article.
-
Could masks curtail the post-lockdown resurgence of COVID-19 in the US?Math Biosci. 2020 Nov;329:108452. doi: 10.1016/j.mbs.2020.108452. Epub 2020 Aug 18. Math Biosci. 2020. PMID: 32818515 Free PMC article.
-
Behavioral changes adopted to constrain COVID-19 in Japan: What are the implications for seasonal influenza prevention and control?Glob Health Med. 2021 Jun 30;3(3):125-128. doi: 10.35772/ghm.2021.01066. Glob Health Med. 2021. PMID: 34250286 Free PMC article. Review.
-
How did the Tokyo Metropolitan Government respond to COVID-19?Glob Health Med. 2022 Apr 30;4(2):67-70. doi: 10.35772/ghm.2022.01017. Glob Health Med. 2022. PMID: 35586763 Free PMC article. Review.
Cited by
-
Telecommuting, Off-Time Work, and Intrusive Leadership in Workers' Well-Being.Int J Environ Res Public Health. 2021 Mar 24;18(7):3330. doi: 10.3390/ijerph18073330. Int J Environ Res Public Health. 2021. PMID: 33804828 Free PMC article.
-
Psychological resilience of emergency nurses during COVID-19 epidemic in Shanghai: A qualitative study.Front Public Health. 2022 Sep 16;10:1001615. doi: 10.3389/fpubh.2022.1001615. eCollection 2022. Front Public Health. 2022. PMID: 36187606 Free PMC article.
-
Modelling long-term COVID-19 impacts on the U.S. workforce of 2029.PLoS One. 2021 Dec 1;16(12):e0260797. doi: 10.1371/journal.pone.0260797. eCollection 2021. PLoS One. 2021. PMID: 34852022 Free PMC article.
-
Dexamethasone to prednisolone rotation relieved hiccups in colorectal cancer patient continuing teleworking during anticancer therapy.Clin Case Rep. 2023 Jun 20;11(6):e7367. doi: 10.1002/ccr3.7367. eCollection 2023 Jun. Clin Case Rep. 2023. PMID: 37351354 Free PMC article.
-
Effect of commuting on the risk of COVID-19 and COVID-19-induced anxiety in Japan, December 2020.Arch Public Health. 2021 Dec 9;79(1):222. doi: 10.1186/s13690-021-00751-9. Arch Public Health. 2021. PMID: 34879866 Free PMC article.
References
LinkOut - more resources
Full Text Sources
Research Materials