. 2020 Oct 28;6(10):1800-1812.
doi: 10.1021/acscentsci.0c00732. Epub 2020 Sep 16.

Injectable Hydrogels for Sustained Codelivery of Subunit Vaccines Enhance Humoral Immunity

Affiliations

Injectable Hydrogels for Sustained Codelivery of Subunit Vaccines Enhance Humoral Immunity

Gillie A Roth et al. ACS Cent Sci. .

Abstract

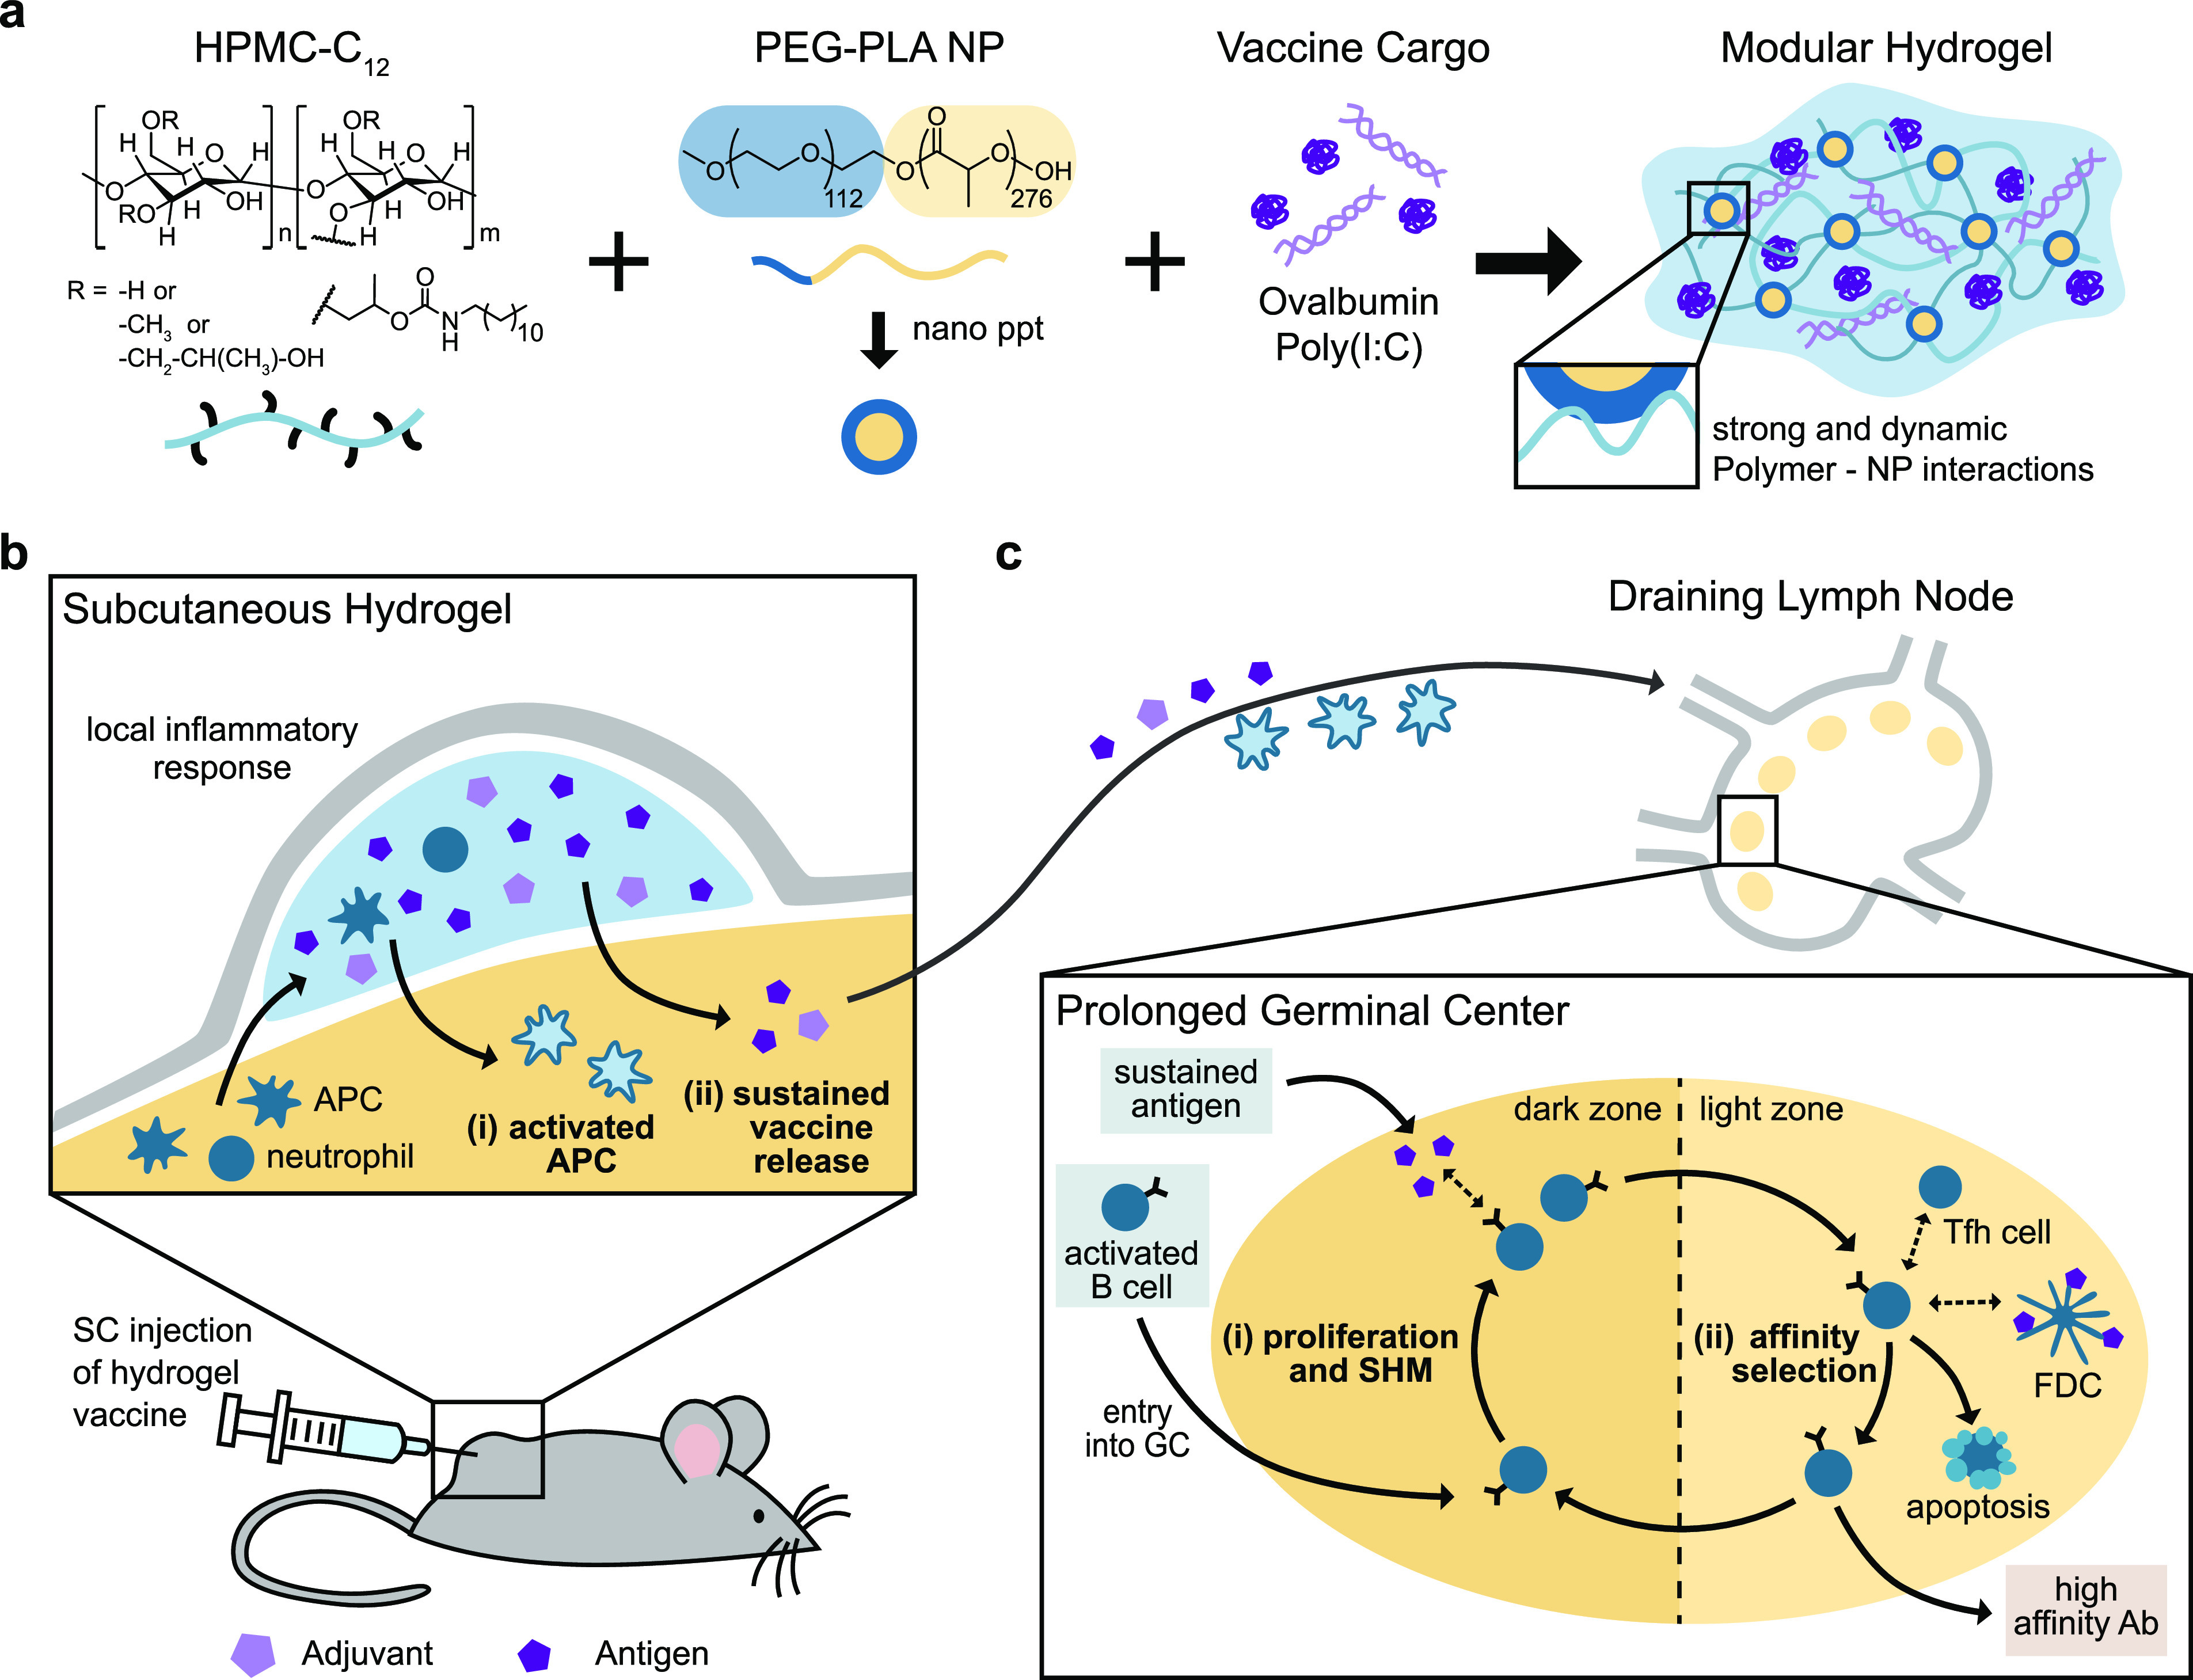
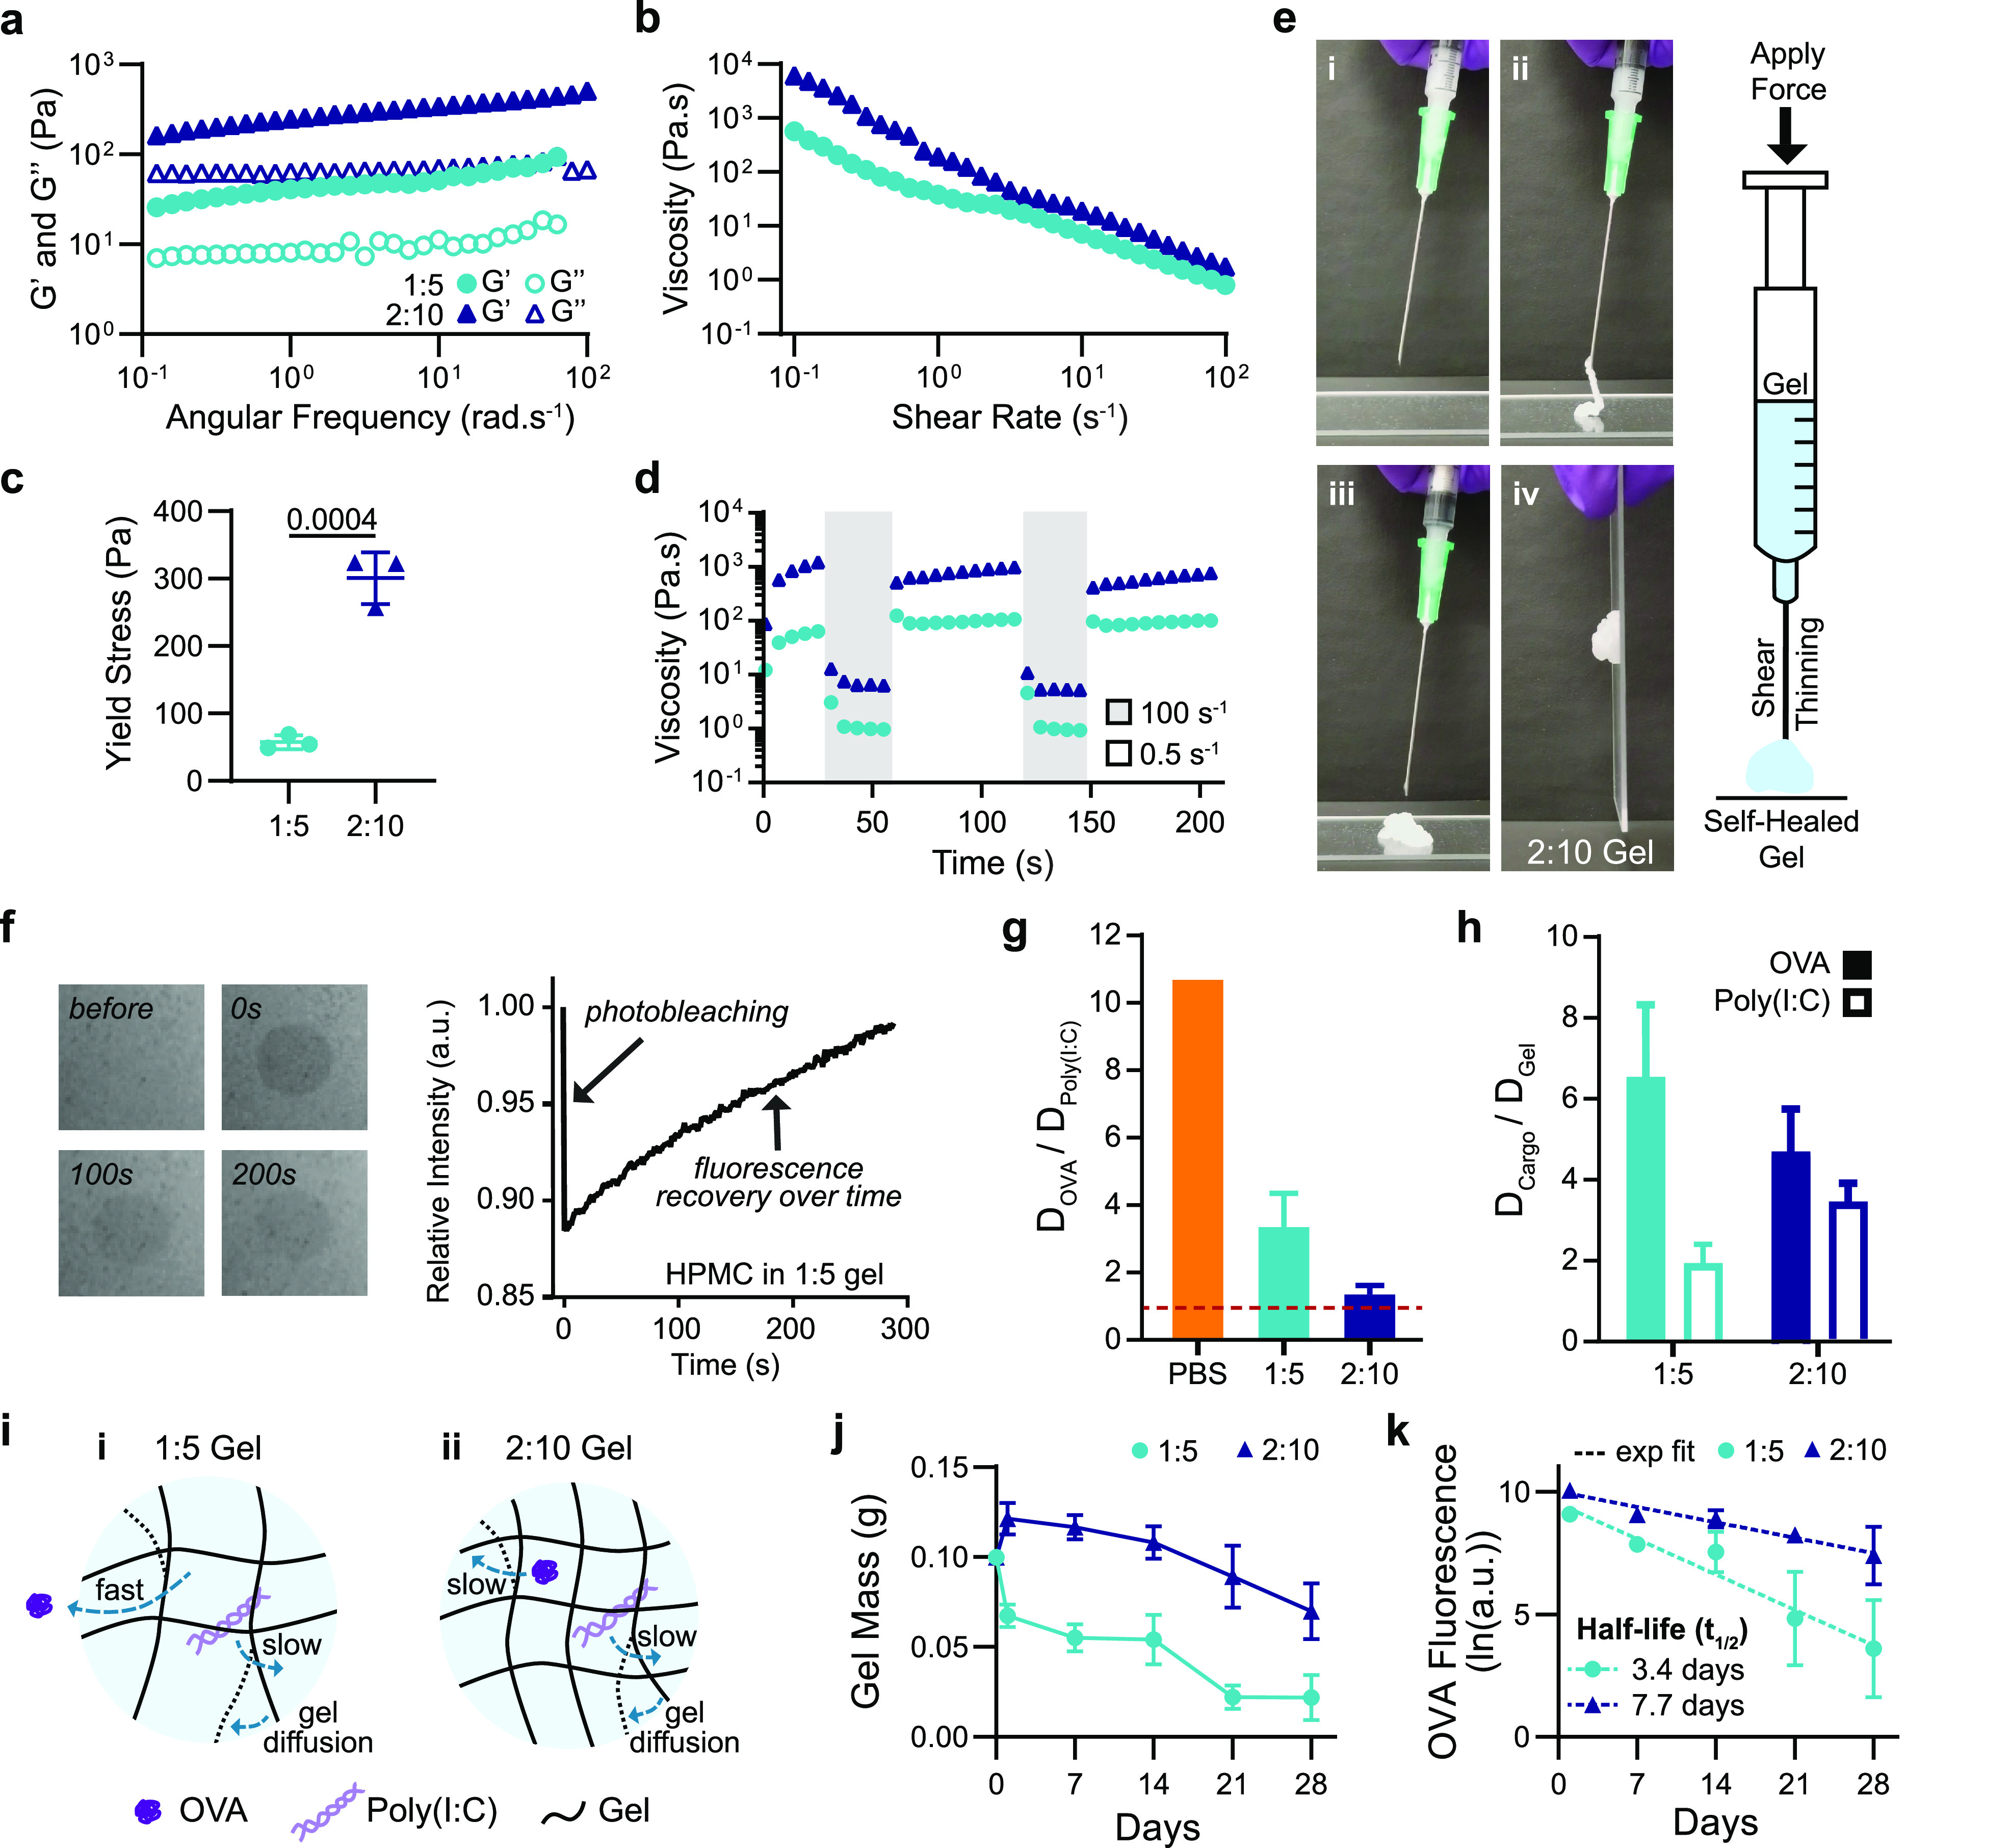
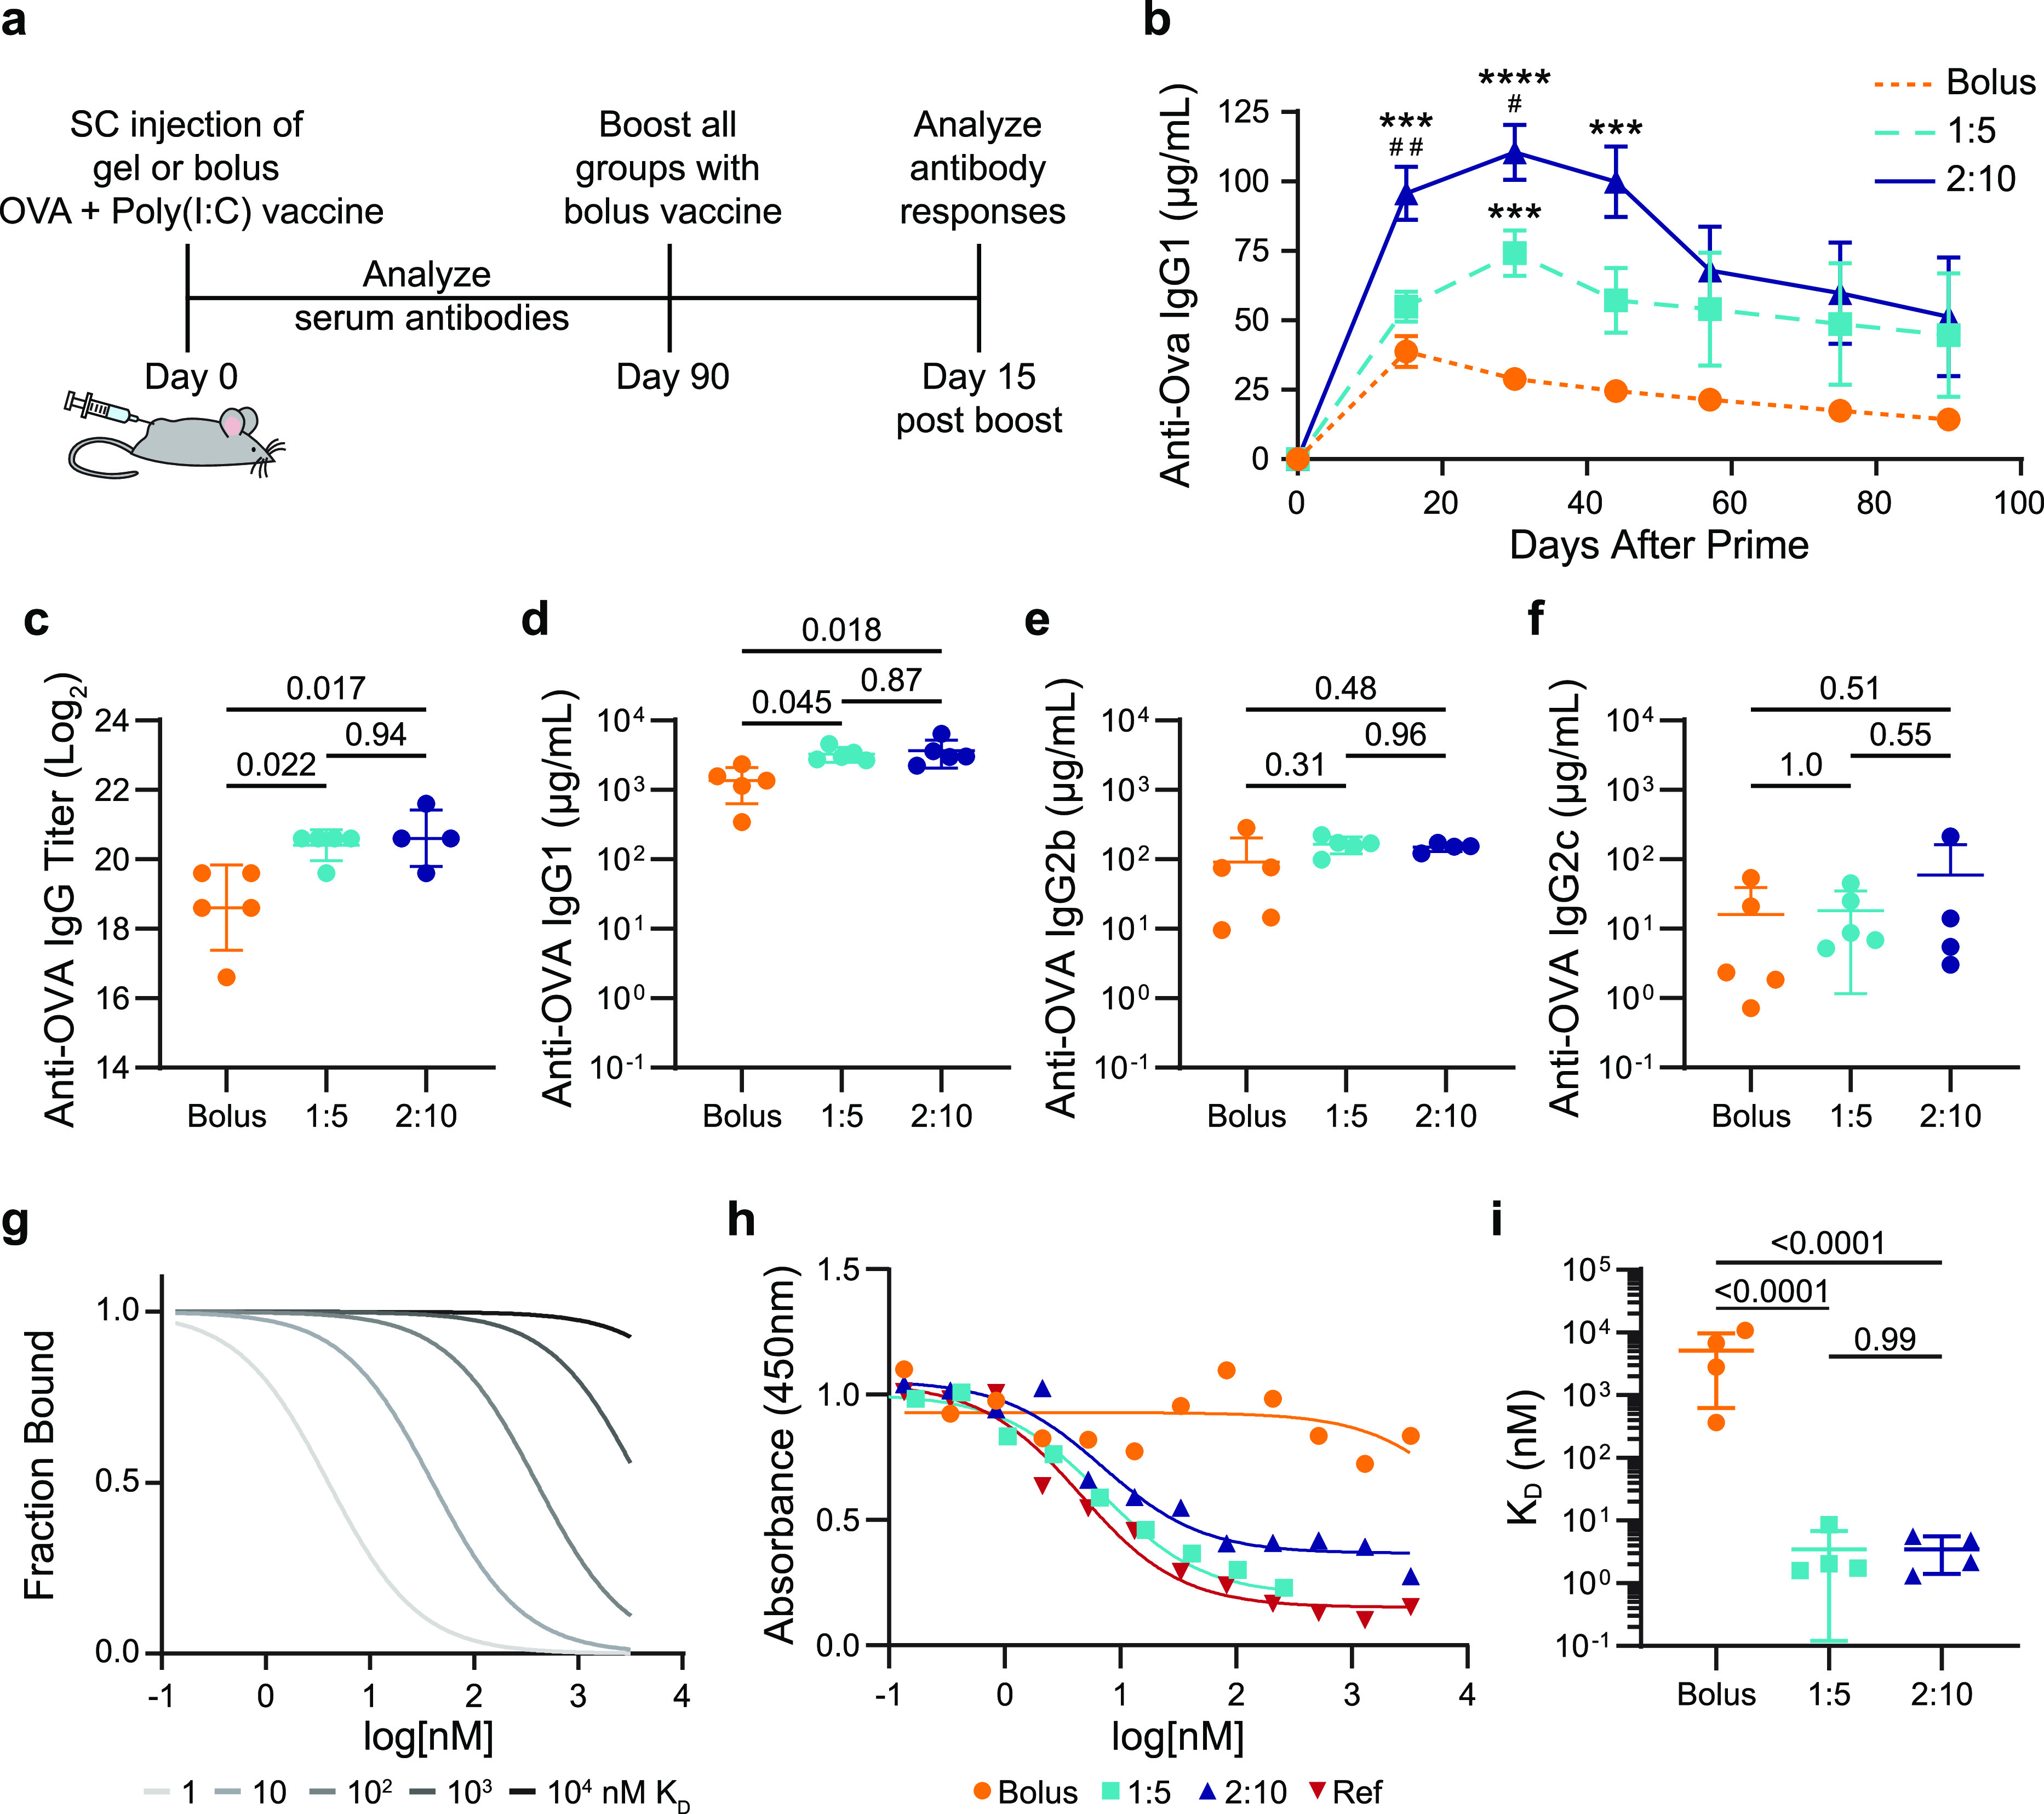
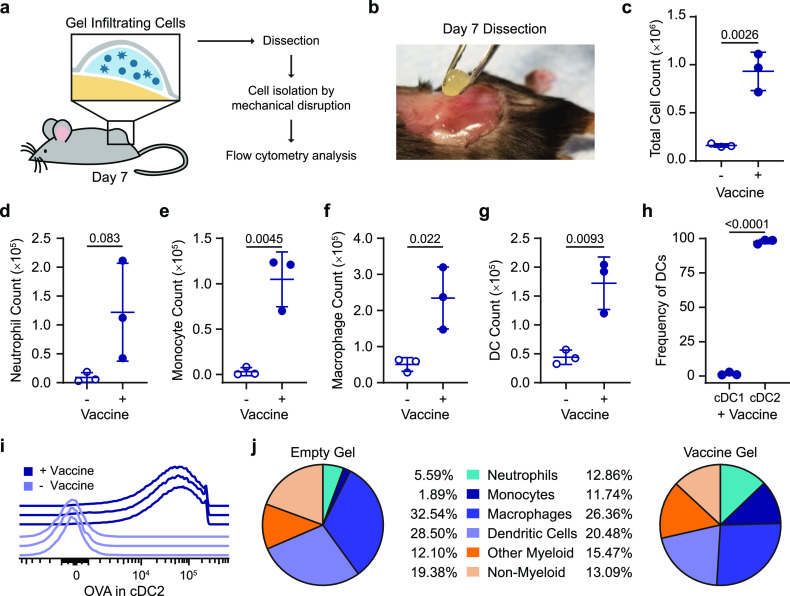
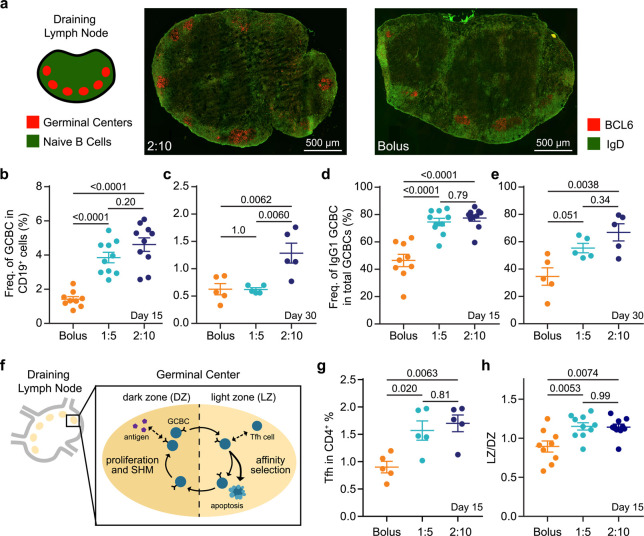
Vaccines aim to elicit a robust, yet targeted, immune response. Failure of a vaccine to elicit such a response arises in part from inappropriate temporal control over antigen and adjuvant presentation to the immune system. In this work, we sought to exploit the immune system's natural response to extended pathogen exposure during infection by designing an easily administered slow-delivery vaccine platform. We utilized an injectable and self-healing polymer-nanoparticle (PNP) hydrogel platform to prolong the codelivery of vaccine components to the immune system. We demonstrated that these hydrogels exhibit unique delivery characteristics, whereby physicochemically distinct compounds (such as antigen and adjuvant) could be codelivered over the course of weeks. When administered in mice, hydrogel-based sustained vaccine exposure enhanced the magnitude, duration, and quality of the humoral immune response compared to standard PBS bolus administration of the same model vaccine. We report that the creation of a local inflammatory niche within the hydrogel, coupled with sustained exposure of vaccine cargo, enhanced the magnitude and duration of germinal center responses in the lymph nodes. This strengthened germinal center response promoted greater antibody affinity maturation, resulting in a more than 1000-fold increase in antigen-specific antibody affinity in comparison to bolus immunization. In summary, this work introduces a simple and effective vaccine delivery platform that increases the potency and durability of subunit vaccines.


Conflict of interest statement

The authors declare the following competing financial interest(s): G.A.R., E.C.G., M.M.D., and E.A.A. are inventors on a patent describing the technology reported in this manuscript.

Figures

Figure 1
Figure 1
Schematic representation of the PNP hydrogel and proposed in vivo response to prolonged hydrogel-based vaccine delivery. (a) Vaccine-loaded PNP hydrogels are formed when dodecyl-modified hydroxypropylmethylcellulose (HPMC–C12) is combined with poly(ethylene glycol)–b-poly(lactic acid) (PEG–PLA) nanoparticles (NPs) and vaccine cargo, including ovalbumin (OVA) and Poly(I:C). Multivalent and dynamic noncovalent interactions between the polymer and NPs constitute physical cross-links within the hydrogel structure. (b) After subcutaneous (SC) injection of the hydrogel vaccine, local and migratory immune cells such as neutrophils and antigen presenting cells (APCs) infiltrate the gel, become activated, and then, (i) activated APCs may migrate to the draining lymph nodes. The gel provides (ii) sustained release of the vaccine cargo to the draining lymph nodes, prolonging the germinal center response. (c) The extended antigen availability in the germinal centers leads to increased (i) somatic hypermutation (SHM) and (ii) affinity selection, ultimately promoting higher affinity antibodies and a strong humoral immune response.
Figure 2
Figure 2
Material characterization and dynamics of entrapped molecular cargo. (a) Frequency-dependent (σ = 1.8 Pa, 25 °C) oscillatory shear rheology and (b) steady shear rheology of two PNP hydrogel formulations designated “1:5” and “2:10”. (c) Yield stress values from stress ramp measurements (n = 3). (d) Step-shear measurements of 1:5 and 2:10 gels over two cycles with alternating high shear (100 s–1) and low shear (0.05 s–1) rates. (e) Images of 2:10 gel injection through a 21-gauge needle showing (i) before injection, (ii) during injection, (iii,iv) and after injection (screenshots from Video S1). (f) FRAP experiment showing photobleaching of a select area at 0 s, and the fluorescence recovering as fluorescent molecules diffuse back into the select area. (g) Ratio of the diffusivity of OVA to the diffusivity of Poly(I:C) calculated from RH values for PBS or using FRAP for the 1:5 and 2:10 gels. Values closer to one indicate more similar diffusivities of the OVA and Poly(I:C) (n = 3). (h) Ratio of the diffusivity of the cargo (OVA or Poly(I:C)) to the self-diffusivity of the hydrogel network. Values closer to one indicate that cargo diffusivity is limited by self-diffusion of the hydrogel (n = 3). (i) Representative schematic of (i) the 1:5 gel with OVA moving quickly and Poly(I:C) and the hydrogel matrix diffusing slower as well as (ii) the 2:10 gel with the OVA, Poly(I:C), and hydrogel matrix all diffusing slowly. (j) Gel mass over time following SC implantation measured from in vivo explants (n = 5). (k) Fluorescence of Alexa-647–OVA retained in explanted gels fit with an exponential decay to calculate t1/2 (n = 5). All error bars are mean ± s.d., and p values are determined by a two-tailed t test.
Figure 3
Figure 3
Antibody concentration and affinity following immunization. (a) Timeline of the experimental setup shows subcutaneous (SC) injection of a model vaccine containing OVA and Poly(I:C) in a gel or bolus formulation at day 0, antibody analysis over time following a single administration, boost with a bolus vaccine formulation at day 90, and analysis of the immune response 15 days after the boost. (b) Serum anti-OVA IgG1 concentrations from day 0 to day 90 after a single injection of vaccines (n = 5 to 19; one to four independent experiments; mean ± s.e.m.). ***p < 0.001 and ****p < 0.0001 compared to bolus, #p < 0.05, ##p < 0.005 compared to 1:5, determined by mixed-effects analysis with Tukey’s post hoc test. Serum anti-OVA (c) IgG end point titer, (d) IgG1 concentration, (e) IgG2b concentration, and (f) IgG2c concentration 15 days after bolus boost on day 90 for animals receiving either bolus, 1:5 gel, or 2:10 gel vaccines (n = 4 to 5; mean ± s.d.). Reported p values determined by one-way ANOVA with Tukey’s post hoc test. (g) Model comparing competitive binding data with KD ranging from 1 to 104 nM. (h) Representative competitive binding curves for bolus, 1:5 gel, and 2:10 gel vaccine groups after the day 90 boost compared to an mAb reference competing with the same mAb. (i) Calculated KD values from fitted binding curves for bolus, 1:5 gel, and 2:10 gel vaccine groups (n = 4; mean ± s.d.). p values determined by one-way ANOVA with Tukey’s post hoc test.
Figure 4
Figure 4
Characterization of the local inflammatory niche. (a) Schematic of the inflammatory niche within the gel depot and an experimental flowchart. (b) Picture of surgical removal of 2:10 gel after 7 days in vivo. (c) Total cells in 2:10 gel with or without vaccine (OVA + Poly(I:C)) were quantified using flow cytometry. (d–g) Total count of neutrophils (d), monocytes (e), macrophages (f), and dendritic cells (DCs) (g) found in the empty and vaccine-loaded 2:10 gels. (h) The frequency of cDC1 (XCR1hiCD11blo) and cDC2 (XCR1loCD11bhi) of the total DCs in the vaccine-loaded 2:10 gel. (i) Histogram of the Alexa-647–OVA signal in cDC2s from individual mice with and without the vaccine. (j) The frequency of neutrophils, monocytes, macrophages, DCs, other myeloid cells, and nonmyeloid cells within the CD45+ cell populations found in the empty and vaccine-loaded 2:10 gels. For (c–j), n = 3 mice. All error bars are mean ± s.d.; p values are determined by a two-tailed t test.
Figure 5
Figure 5
Germinal center response to single vaccine administration. (a) Immunohistochemistry (IHC) of explanted inguinal lymph node 15 days after OVA + Poly(I:C) vaccine administration in 2:10 and bolus groups to visualize germinal centers (GC) (red) and naïve B cells (green). (b,c) The frequency of germinal center B cells (GCBCs) within total B cells at day 15 (b) and day 30 (c) after prime and (d,e) frequency of IgG1 + GCBCs within total GCBCs at day 15 (d) and day 30 (e) after prime in the inguinal lymph nodes were measured by flow cytometry (n = 5 to 10). (f) Schematic of the GC response. (g) The percent of T follicular helper cells (Tfh) out of the CD4+ cell population and (h) and the ratio of lights zone (LZ) to dark zone (DZ) GCBCs in the inguinal lymph nodes at day 15 after vaccinatation (n = 5 to 10). For (b,d,h), data come from two independent experiments, and all other graphs represent one independent experiment. All error bars are mean ± s.d.; p values are determined by one-way ANOVA with Tukey’s post hoc test.

References

    1. Hsu D. C.; O’Connell R. J. Progress in HIV vaccine development. Hum. Vaccines Immunother. 2017, 13, 1018–1030. 10.1080/21645515.2016.1276138. - DOI - PMC - PubMed
    1. Estrada L. D.; Schultz-Cherry S. Development of a Universal Influenza Vaccine. J. Immunol. 2019, 202, 392–398. 10.4049/jimmunol.1801054. - DOI - PMC - PubMed
    1. Kumar A.; Meldgaard T. S.; Bertholet S. Novel Platforms for the Development of a Universal Influenza Vaccine. Front. Immunol. 2018, 9, 600.10.3389/fimmu.2018.00600. - DOI - PMC - PubMed
    1. Frimpong A.; Kusi K. A.; Ofori M. F.; Ndifon W. Novel Strategies for Malaria Vaccine Design. Front. Immunol. 2018, 9, 2769.10.3389/fimmu.2018.02769. - DOI - PMC - PubMed
    1. Irvine D. J.; Swartz M. A.; Szeto G. L. Engineering synthetic vaccines using cues from natural immunity. Nat. Mater. 2013, 12, 978–990. 10.1038/nmat3775. - DOI - PMC - PubMed