. 2021 Apr;238(4):970-985.
doi: 10.1111/joa.13352. Epub 2020 Nov 3.

The spatial distribution of focal stacks within the inner enamel layer of mandibular mouse incisors

Affiliations

The spatial distribution of focal stacks within the inner enamel layer of mandibular mouse incisors

Charles E Smith et al. J Anat. 2021 Apr.

Abstract

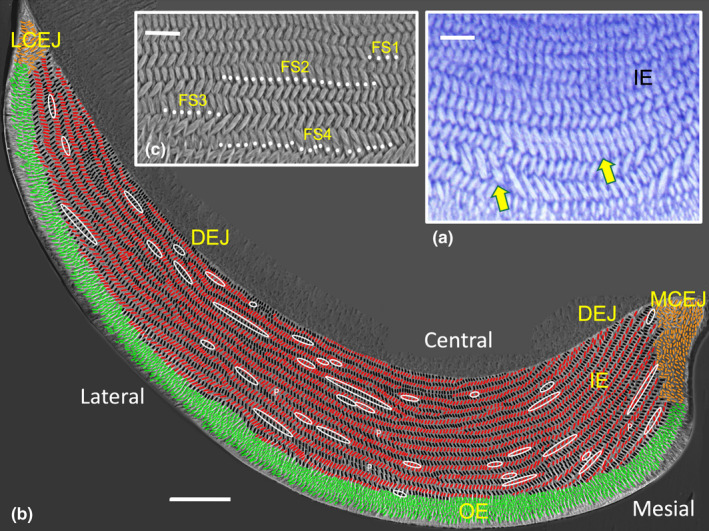
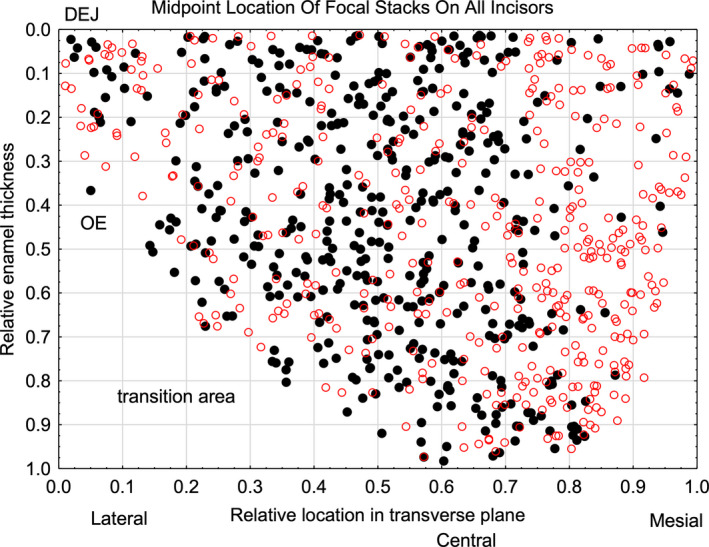
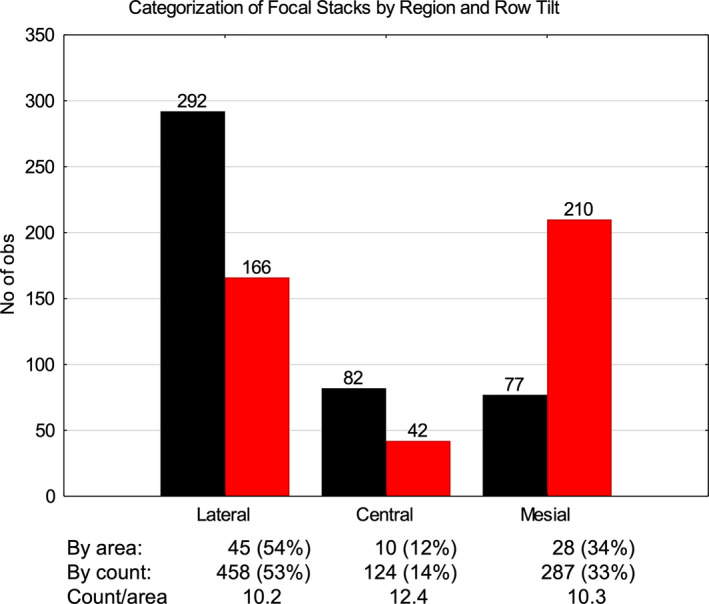
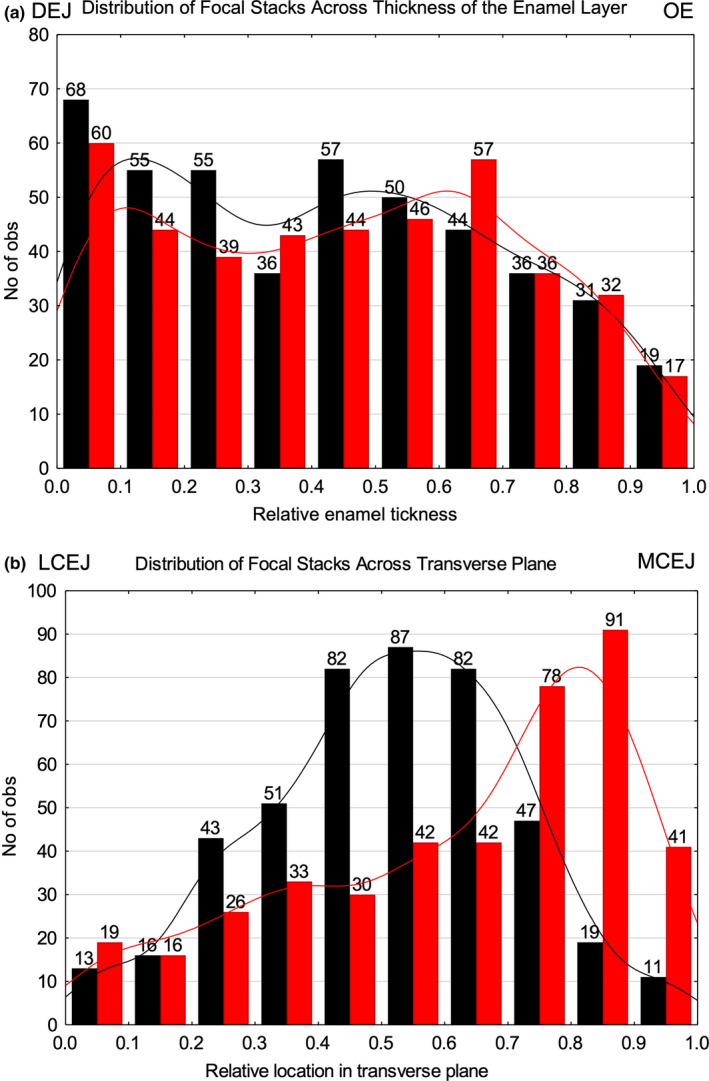
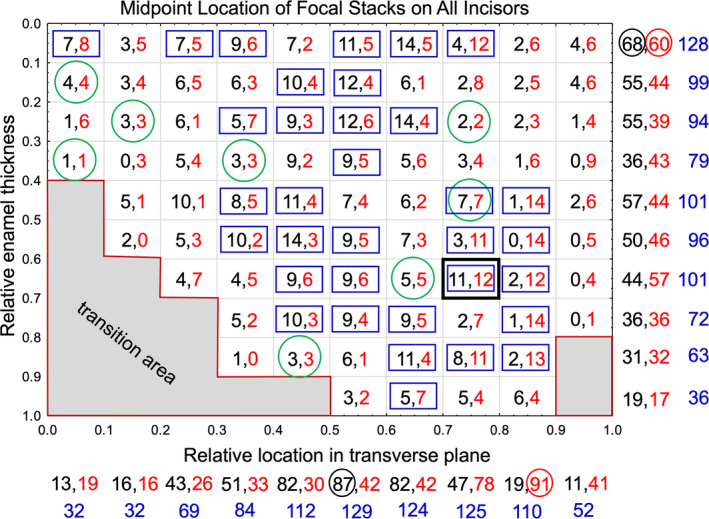
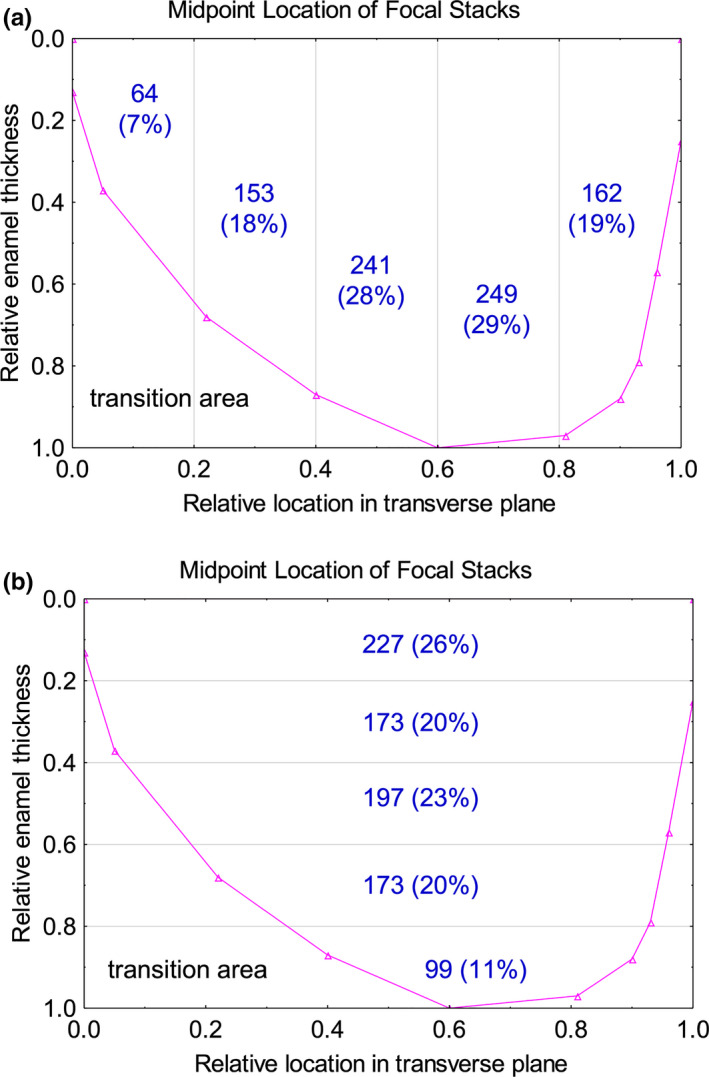
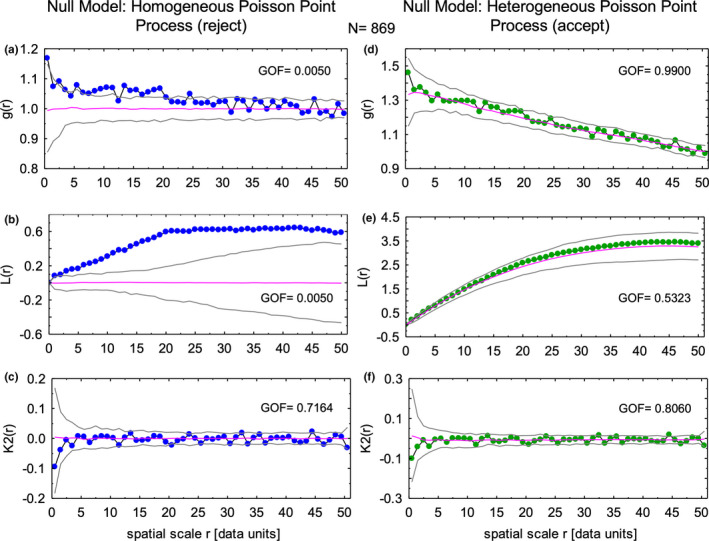
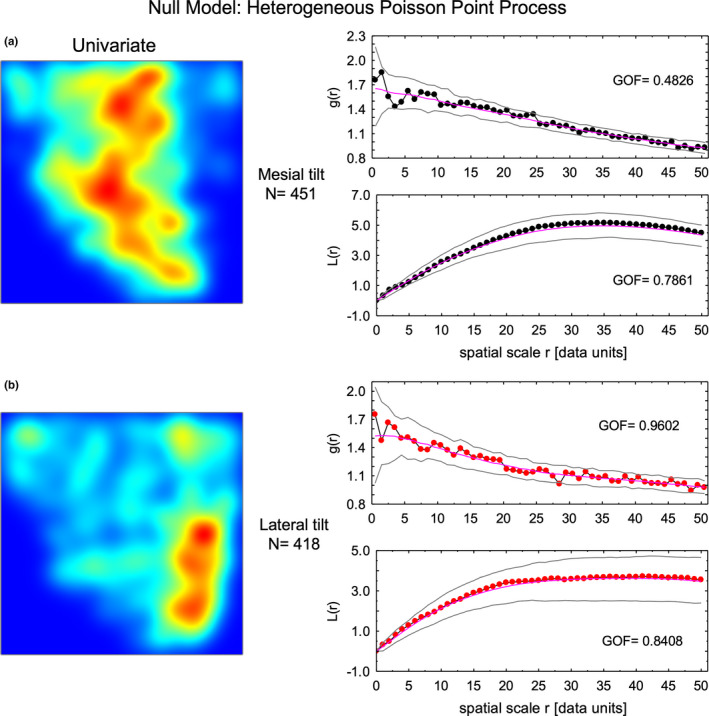
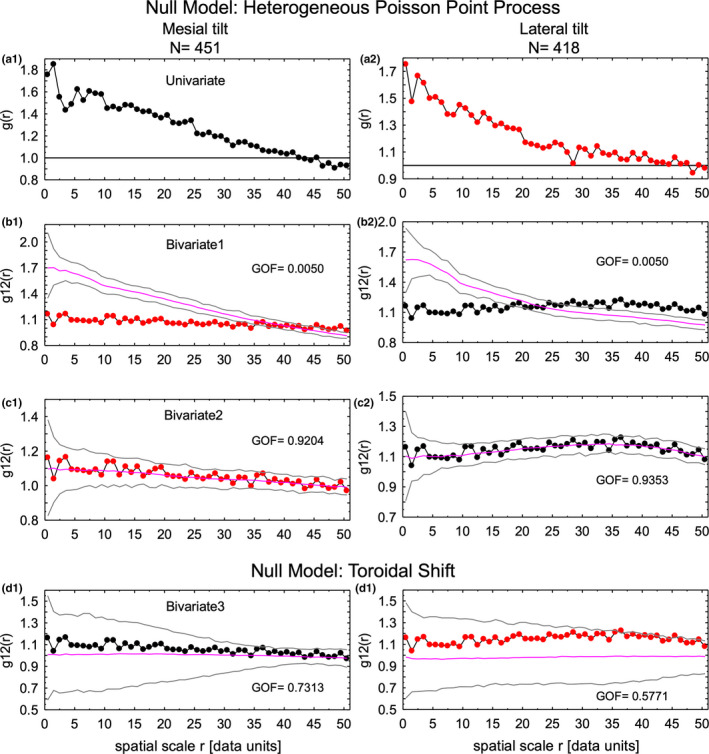
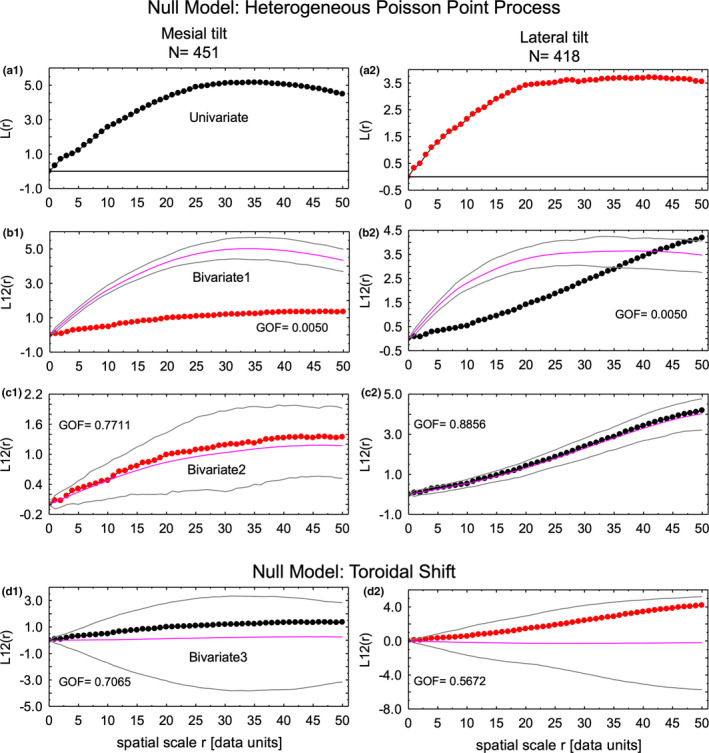
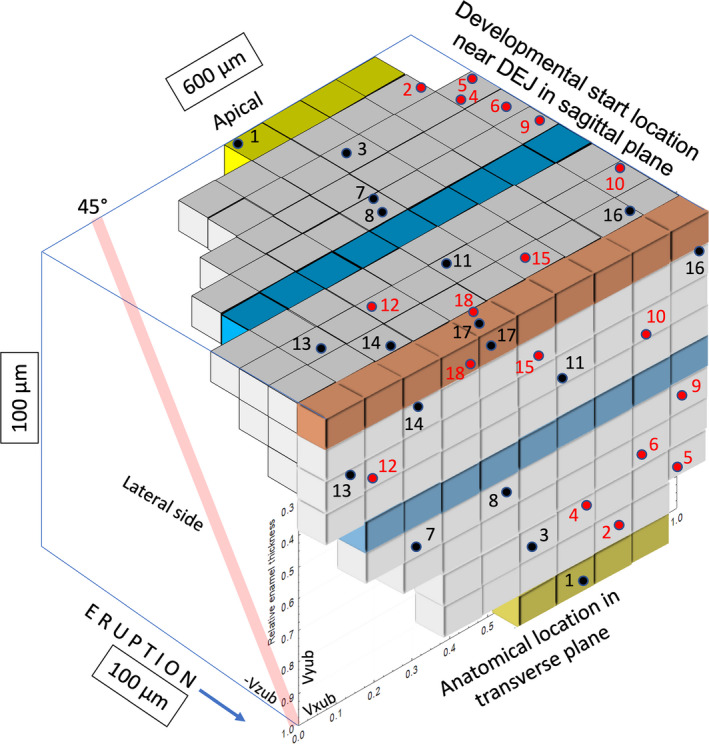
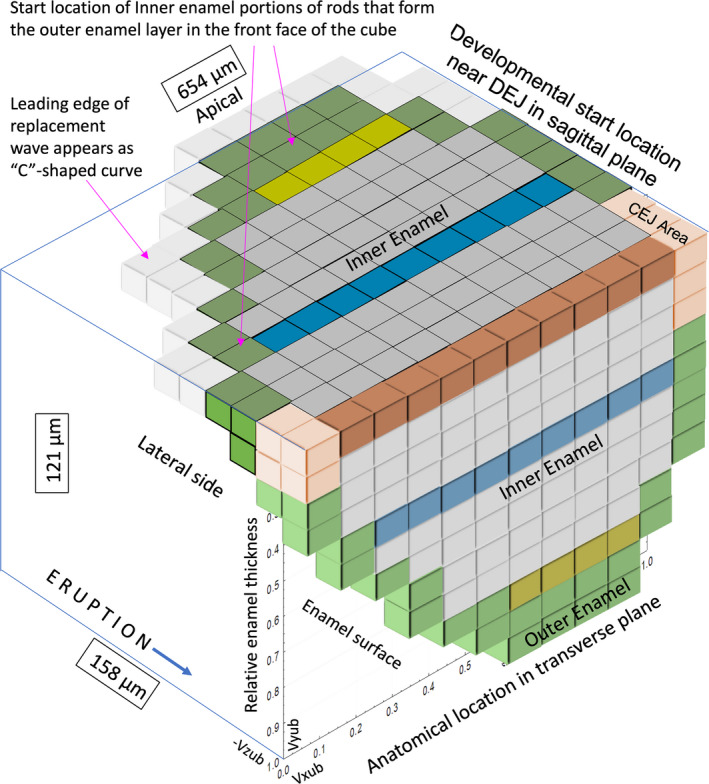
Focal stacks are an alternative spatial arrangement of enamel rods within the inner enamel of mandibular mouse incisors where short rows comprised of 2-45 enamel rods are nestled at the side of much longer rows, both sharing the same rod tilt directed mesially or laterally. The significance of focal stacks to enamel function is unknown, but their high frequency in transverse sections (30% of all rows) suggests that they serve some purpose beyond representing an oddity of enamel development. In this study, we characterized the spatial distribution of focal stacks in random transverse sections relative to different regions of the inner enamel and to different locations across enamel thickness. The curving dentinoenamel junction (DEJ) in transverse sections complicated spatial distribution analyses, and a technique was developed to "unbend" the curving DEJ allowing for more linear quantitative analyses to be carried out. The data indicated that on average there were 36 ± 7 focal stacks located variably within the inner enamel in any given transverse section. Consistent with area distributions, focal stacks were four times more frequent in the lateral region (53%) and twice as frequent in the mesial region (33%) compared to the central region (14%). Focal stacks were equally split by tilt (52% mesial vs. 48% lateral, not significant), but those having a mesial tilt were more frequently encountered in the lateral and central regions (2:1) and those having a lateral tilt were more numerous in the mesial region (1:3). Focal stacks having a mesial tilt were longer on average compared to those having a lateral tilt (7.5 ± 5.6 vs. 5.9 ± 4.0 rods per row, p < 0.01). There was no relationship between the length of a focal stack and its location within the inner enamel. All results were consistent with the notion that focal stacks travel from the DEJ to the outer enamel the same as the longer and decussating companion rows to which they are paired. The spatial distribution of focal stacks within the inner enamel was not spatially random but best fit a null model based on a heterogenous Poisson point process dependent on regional location within the transverse plane of the enamel layer.

Keywords: enamel rods; focal stacks; mouse incisor; quantification; row organization; spatial distribution.


Conflict of interest statement

The authors declare no conflict of interest.

Figures

FIGURE 1
FIGURE 1
Transverse sections of mandibular mouse incisor enamel. (a) Light microscope image of decalcified enamel from the central region stained with toluidine blue showing a portion of inner enamel (IE) near its transition into outer enamel (OE, panel b). Two focal stacks, one short and another longer row nestled at the sides of longer rows having the same tilt, are indicated by the yellow arrows. (b) Backscatter electron microscope image of the whole enamel layer. Rows of sliced open rods in the IE layer having a mesial tilt are drawn in black and rows having a lateral tilt are drawn in red. Cut open rods forming the OE layer are drawn in green and the poorly organized and short enamel rods near the mesial and lateral cementoenamel junctions (MCEJ, LCEJ) are drawn in tan (see also Figure S5). The 38 focal stacks present in this section are circled in white (see also Figure S3). Focal stacks are sometimes difficult to distinguish from instances of row pairing (P), sites where two usually long rows having the same tilt lie adjacent to each other over short distances. (c) High power image from the lateral enamel region showing 4 focal stacks of various lengths in association with rows to which they are nestled. Bars in a and c = 10 µm; Bar in b = 50 µm. DEJ, dentinoenamel junction
FIGURE 2
FIGURE 2
Scatter plot in unbent virtual coordinates of the midpoint locations of focal stacks found within inner enamel of 24 incisors (N = 869 total as 451 with mesial tilt [black] and 418 with lateral tilt [red]). The dentinoenamel junction (DEJ) is at top of the y‐axis and the transition area into outer enamel and then enamel surface is at the bottom of the y‐axis (see also Figure 1). There are some locations within the inner enamel layer where focal stacks having a mesial tilt (black) are frequently present (e.g., 0.4–0.5 on x‐axis) and other sites where focal stacks having a lateral tilt (red) predominate (e.g., 0.8–0.9 on x‐axis)
FIGURE 3
FIGURE 3
Histogram comparing the frequency of focal stacks by row tilt within the lateral, central, and mesial regions of the inner enamel (unbent virtual x‐axis coordinates 0.0 to <0.6, 0.6 to <0.7, 0.7–1.0 respectively). Focal stacks having a mesial tilt (black) are more frequently present in the central and lateral regions (x2) and those having a lateral tilt (red) predominate in the mesial region (x3). The total number of focal stacks in each region, however, correlates closely with the proportion of area each region occupies (count/area). Differences between regions for either tilt and differences by tilt within a given region are significant (p < 0.01). Differences for count/area are not significant
FIGURE 4
FIGURE 4
Histograms showing a breakdown in the frequency of focal stacks having a mesial (black) or lateral (red) tilt present in 10 subdivisions into which the inner enamel was divided across its the thickness (a) and width (b). Gaussian kernel density functions are fitted by row tilt in each histogram. On a uniform random basis, we would expect to observe about 44 focal stacks per tilt within each of 10 unit subdivisions of space. (a) The frequency of focal stacks pooled from 24 transverse sections varies across enamel thickness with maximum counts near the dentinoenamel junction (DEJ; subdivision 0.0–0.1) and minimum counts at the transition between inner enamel (IE) and outer enamel (OE; subdivision 0.9–1.0). Counts by tilt within each subdivision are not significantly different, whereas total counts per subdivision are significantly different comparing subdivisions 0.0–0.1 to 0.1–0.2, 0.6–0.7 to 0.7–0.8, and 0.8–0.9 to 0.9–1.0 (p < 0.05). (b) Extreme differences in focal stack counts by row tilt are evident across the transverse plane of inner enamel. The lowest counts are seen for both row tilts in two subdivisions near the lateral cementoenamel junction (LCEJ; 0.0–0.2) and for focal stacks having a mesial tilt in two subdivisions near the mesial cementoenamel junction (MCEJ; 0.8–1.0). Counts for focal stacks having a mesial tilt are significantly higher than those having a lateral tilt within subdivisions 0.3–0.7 and counts for focal stacks having a lateral tilt are significantly higher than those having a mesial tilt in subdivisions 0.7–1.0 (p < 0.05). Note in a and b that many of the total counts for a given tilt are in the expected range of 44 focal stacks per tilt but in b the peak counts are almost double the expected amounts from mid‐lateral to mesial side of the IE layer (0.4–1.0)
FIGURE 5
FIGURE 5
Graphic representation of results from counts of focal stack frequencies for each of the 83 unbent virtual coordinate subdivisions into which the inner enamel was partitioned. We would expect around five focal stacks of either tilt in each of the 83 subdivisions on a random uniform basis. While presented as squares for graphic purposes, each subdivision in the real world represents a rectangle 10 μm in height by 60 μm in width (see Figure 11). Each subdivision shows counts by tilt (mesial tilt in black and lateral tilt in red). The green circles indicate a few instances where counts for each tilt were equal while the blue squares indicate cases where the sum of counts was equal to or greater than half the total number of incisors examined (12–24 summed counts total). The numbers below the x‐axis and to the right side of the y‐axis show the summed counts for each tilt (summarized in Figure 4) followed by the total counts for all tilts (blue). The circled numbers are the highest number of counts found for focal stacks having a mesial or lateral tilt in the horizontal and vertical directions. This figure illustrates the trend for highly variable counts per tilt in a given subdivision and for a consistently higher frequency of focal stacks associated with the mid‐lateral and central regions for focal stacks having a mesial tilt and in the mesial region for focal stacks having a lateral tilt
FIGURE 6
FIGURE 6
Graphic representation of summed counts for focal stacks in two subdivision steps across the transverse plane (a) and the thickness (b) of inner enamel. Pooled counts suggest a pattern in focal stack distributions not readily evident in histograms (Figure 4) or raw single subdivision counts (Figure 5). We would expect around 174 focal stacks on a random uniform basis in each of five subdivisions of inner enamel. (a) Within the transverse plane focal stacks are most often present in ±0.2 subdivisions of the central region (x‐axis, 0.4–0.6 and 0.6–0.8). A significantly lower (p < 0.05) but near random number of focal stacks are found in the next 0.2 subdivisions of the inner enamel (IE) layer in a lateral (0.2–0.4) and mesial (0.8–1.0) direction, and a 2.4‐fold and significantly lower number of focal stacks are found within the thinnest part of the IE at the lateral side (0.0–0.2; p < 0.05 compared to 0.2–0.4). (b) The frequency of focal stacks is similar and near random across most of the thickness of the inner enamel (y‐axis, 0.2–0.8) but their frequency is significantly higher near the dentinoenamel junction (0.0–0.2) and lowest approaching the outer enamel (0.8–1.0; p < 0.05 for both)
FIGURE 7
FIGURE 7
Spatial distribution of all focal stacks within inner enamel irrespective of row tilt. Spatial point distribution analyses of the locations of midpoints of focal stacks using the Programita software package indicates that the paired correlation function g(r) (a) and L functions (b) for focal stack distributions do not fit a null model based on a homogeneous Poisson point process (corrected for irregular shape area and edge effects), but they show a good fit to a null mode based on a heterogeneous Poisson point process (d,e). The K2 function for focal stacks fit well to both null models (c,f) suggestive that clustering of points indicated by experiment curves positioned above the magenta line at 1.0 and 0.0 for the g(r) function (a) and the L function (b) were caused by minor irregularities in the distribution of focal stacks rather than true clustering of focal stack locations
FIGURE 8
FIGURE 8
Spatial distribution of focal stacks by row tilt. The null model for a heterogeneous Poisson point process involves calculating a kernel density map (intensity function) for the point distributions which are very different for focal stacks having a mesial tilt (a, left side color map) versus those having a lateral tilt (b, left side color map). In both cases, the resultant g(r) and L function calculations show an acceptable univariate goodness of fit for focal stacks having a mesial tilt (a, graphs at right side) and especially for those having a lateral tilt (b, graphs at right side)
FIGURE 9
FIGURE 9
Spatial distribution of focal stacks having a mesial tilt as compared to those having a lateral tilt (bivariate distributions) using the paired correlation function (g(r), g12(r)). In a1 and a2, the univariate g(r) function generated for the raw point distributions for focal stacks having a mesial (black) and lateral (red) tilt (Figure 2) are presented for reference (see Figure 8). When the point distribution in unbent virtual coordinate space for one tilt was kept fixed and the same number of points from the opposite tilt were randomly plotted around the fixed point using a heterogeneous Poisson point process null model with intensity function dictated by the fixed points, no bivariate fit was obtained for the moved points (b1, lateral tilt move around fixed mesial tilt locations with mesial intensity function; b2, mesial tilt moved around fixed lateral tilt locations with lateral intensity function). However, if the intensity function for the points being moved was substituted in the calculation then a good bivariate fit was obtained (c1, lateral tilt move around fixed mesial tilt locations with lateral intensity function; c2, mesial tilt moved around fixed lateral tilt locations with mesial intensity function). These results suggest that focal stacks having a mesial tilt are independently distributed from those having a lateral tilt and vice versa. This was supported by running null models based on toroidal shift of points (Wiegand & Moloney, 2014) for each tilt type which showed acceptable bivariate fit (d1, mesial tilt; d2, lateral tilt). The results in d1 and d2 illustrate well that the distribution of focal stacks having a mesial tilt (d1) are different from focal stacks having a lateral tilt (d2)
FIGURE 10
FIGURE 10
Spatial distribution of focal stacks having a mesial tilt as compared to those having a lateral tilt (bivariate distributions) using the L function [L(r), L12(r)]. The same results were obtaining as in Figure 9 with the exception that the L12 curves better revealed differences in spatial distribution of focal stacks having a mesial tilt versus those having a lateral tilt (b1, b2); a1, a2, univariate curves for reference to the tilt having fixed points; b1, b2, the intensity function for the fixed points is used for the calculations; c1, c2, the intensity function for the points being moved are used in the calculations; d1, d2, results from the toroidal shift null model indicating that focal stacks having a mesial tilt are distributed independently of focal stacks having a lateral tilt
FIGURE 11
FIGURE 11
3D extrapolation into unbent virtual coordinate space putting in perspective how enamel rods forming the inner enamel seen in any single transverse section of mouse incisor enamel (front plane of cube) might reflect more apically into the sagittal eruptive plane. The inner enamel is shown in 3 arbitrary color strips to aid visualization (brown, adjacent to dentinoenamel junction [DEJ]; blue, halfway across inner enamel; yellow, thickest part of the inner enamel before outer enamel begins). The black and red circles indicate the midpoints of 18 arbitrarily selected focal stacks shown in Figure S3. These are reflected apically into the sagittal plane to show their presumed starting location near the DEJ based on their measured sectional tilt angle and the general assumption that all enamel rods passing through the inner enamel are angled incisally at about 45° to the DEJ (Moinichen et al., 1996) in transit to outer enamel (illustrated by the red cylinder at the lateral side). Note that the 3D tilt direction for some focal stacks seen in the transverse plane of the cube having a mesial tilt (black dots) when reflected in an apical direction sometimes run counter to their observed 2D tilt direction (e.g., focal stacks 7 and 13). Unbent virtual coordinates are shown in lower left front face of the cube. Subdivisions forming the cube represent 60 µm width (Vxub) by 10 µm height (Vyub) by −10 µm depth (−Vzub)
FIGURE 12
FIGURE 12
3D extrapolation into unbent virtual coordinate space putting in perspective all enamel rods seen in a single transverse section (front plane of cube; see Figure 1; Figure S5) and how they may reflect apically into the sagittal eruptive plane. The inner enamel is duplicated in the same color scheme from Figure 11, the outer enamel is illustrated in green, and the peculiar enamel rods near the mesial and lateral cementoenamel junction areas are shown in tan as in Figure 1b. The top of the cube shows the developmental relationships for the enamel rods seen at the front of the cube keeping in mind that when the outer enamel portions of rods shown in green reflect apically they become part of posteriorly positioned inner enamel (all bins near the dentinoenamel junction [DEJ] in the sagittal plane would be the start position of enamel rods forming first the inner enamel (IE) followed by the outer enamel (OE). Taking into account the “extra” bins related to the OE in a typical transverse section, this figure predicts that there are probably a total of 45 focal stacks per renewal block during enamel development (36 on average for IE layer seen a transverse section plus 8 more for the enamel rods seen as the OE layer in the same section when reflected apically). This figure also illustrates the origin of the “C”‐shaped curve along which development occurs during the secretory stage when the enamel rods are formed (Smith & Warshawsky, 1976). The enamel rods illustrated in the tan bins do not form rows and are poorly defined. Unbent virtual coordinates are shown in lower left front face of the cube. Subdivisions forming the cube represent 55 µm width (Vxub) by 10 µm height (Vyub) by −13 µm depth (−Vzub)

Similar articles

References

    1. Boyde, A. (1989) Enamel. In: Oksche, A. & Vollrath, L. (Eds.) Handbook of microscopic anatomy: teeth. Berlin, Heidelberg: Springer‐Verlag, pp. 309–473.
    1. Burn‐Murdoch, R.A. (1993) The effect of the consistency of the diet on eruption rates and lengths of incisor teeth in rats. Archives of Oral Biology, 38, 699–706. - PubMed
    1. Cartwright, A. , Moss, J. & Cartwright, J. (2011) New statistical methods for investigating submarine pockmarks. Computers & Geosciences, 37, 1595–1601.
    1. Colomb, W. , Osmond, M. , Durfee, C. , Krebs, M.D. & Sarkar, S.K. (2019) Quantification of cellular distribution as Poisson process in 3D matrix using a multiview light‐sheet microscope. Microscopy and Microanalysis, 25, 753–761. - PubMed
    1. Dixon, P.M. (2013) Ripley's K function. Encyclopedia of Environmetrics, 3, 1796–1803.

Publication types