Review
. 2021 Jan;30(1):62-82.
doi: 10.1111/mec.15720. Epub 2020 Nov 18.

Population genomics for wildlife conservation and management

Affiliations
Review

Population genomics for wildlife conservation and management

Paul A Hohenlohe et al. Mol Ecol. 2021 Jan.

Abstract

Biodiversity is under threat worldwide. Over the past decade, the field of population genomics has developed across nonmodel organisms, and the results of this research have begun to be applied in conservation and management of wildlife species. Genomics tools can provide precise estimates of basic features of wildlife populations, such as effective population size, inbreeding, demographic history and population structure, that are critical for conservation efforts. Moreover, population genomics studies can identify particular genetic loci and variants responsible for inbreeding depression or adaptation to changing environments, allowing for conservation efforts to estimate the capacity of populations to evolve and adapt in response to environmental change and to manage for adaptive variation. While connections from basic research to applied wildlife conservation have been slow to develop, these connections are increasingly strengthening. Here we review the primary areas in which population genomics approaches can be applied to wildlife conservation and management, highlight examples of how they have been used, and provide recommendations for building on the progress that has been made in this field.

Keywords: adaptive capacity; conservation units; effective population size; genetic rescue; inbreeding depression; population connectivity.


Figures

Figure 1
Figure 1
Two types of genomic data have been used to estimate population size and demographic history in Alpine ibex (Capra ibex). Several reintroduced populations in Switzerland were derived from the same Italian source population, Gran Paradiso (GP). Other populations are Albris (al), Brienzer (br), Pleureur (pl), Aletsch Bietschhorn (ab), Schwarz Mönch (sm), Cape au Moine (cm), Graue Hörner (gh), Rheinwald (rh), Weisshorn (wh), Sierra Nevada (SN), Maestrazgo (M), Zoo Interlaken Harder (ih), Bire Öschinen (bo), Oberbauenstock (ob), Pilatus (pi), Wildpark Peter and Paul (pp). (a) Contemporary estimates of Ne across multiple populations of Alpine ibex and a related species based on RADseq‐derived SNP loci and analysis of linkage disequilibrium. Note that confidence limits, particularly the upper limit, can be large or even infinite. Reproduced from Grossen et al. (2018). (b) WGS data can provide estimates of current Ne (shown as numbers in bold) as well as reconstruction of demographic history. Here time goes from top to bottom, and the width of the green bars corresponds to N e within a time period. Generation 3,023 represents current populations. Reproduced from Grossen et al. (2020)
Figure 2
Figure 2
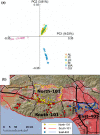
Inferring population structure in wildlife species. (a) Principal Components Analysis based on WGS reveals genetically differentiated populations of sage‐grouse. The Gunnison sage‐grouse (GU; Centrocercus minimus) had previously been recognized as a separate species, while the genetic distinctiveness of the Washington population (WA) of greater sage‐grouse (C. urophasianus) from all other populations of this species was revealed by this study. Reproduced from Oh et al. (2019). (b) Genomic analysis of bobcat (Lynx rufus) populations in southern California showing the effect of major highway corridors on gene flow. Coloured points represent individuals assigned to genetic population groups, and red and black lines represent major highways. Reproduced from Kozakiewicz et al. (2019)
Figure 3
Figure 3
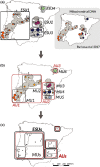
Designation of conservation units in Cabrera voles (Microtus cabrerae) across the Iberian Peninsula. Genome‐wide variation estimated from reduced representation sequencing provides greater resolution of evolutionarily significant units (ESUs) than previous microsatellite results. Neutral and adaptive variation facilitated delineation of management units (MUs) and adaptive units (AUs), respectively. Reproduced from Barbosa et al. (2018)

References

    1. Allendorf, F. W. (2017). Genetics and the conservation of natural populations: Allozymes to genomes. Molecular Ecology, 26, 420–430. 10.1111/mec.13948 - DOI - PubMed
    1. Allendorf, F. W. , Hohenlohe, P. A. , & Luikart, G. (2010). Genomics and the future of conservation genetics. Nature Reviews Genetics, 11, 697–709. 10.1038/nrg2844 - DOI - PubMed
    1. Allendorf, F. W. , Leary, R. F. , Spruell, P. , & Wenburg, J. K. (2001). The problems with hybrids: Setting conservation guidelines. Trends in Ecology and Evolution, 16, 613–622. 10.1016/S0169-5347(01)02290-X - DOI
    1. Andrews, K. R. , deBarba, M. , Russello, M. A. , & Waits, L. P. (2018). Advances in using non‐invasive, archival, and environmental samples for population genomic studies In Rajora O. P. (Ed.), Population Genomics: Wildlife. Springer Nature Switzerland AG.
    1. Andrews, K. R. , Good, J. M. , Miller, M. R. , Luikart, G. , & Hohenlohe, P. A. (2016). Harnessing the power of RADseq for ecological and evolutionary genomics. Nature Reviews Genetics, 17, 81 10.1038/nrg.2015.28 - DOI - PMC - PubMed

Publication types

LinkOut - more resources