

Blood donor obesity is associated with changes in red blood cell metabolism and susceptibility to hemolysis in cold storage and in response to osmotic and oxidative stress
- PMID: 33146433
- PMCID: PMC7902376
- DOI: 10.1111/trf.16168
Blood donor obesity is associated with changes in red blood cell metabolism and susceptibility to hemolysis in cold storage and in response to osmotic and oxidative stress
Abstract
Background: Obesity is a global pandemic characterized by multiple comorbidities, including cardiovascular and metabolic diseases. The aim of this study was to define the associations between blood donor body mass index (BMI) and RBC measurements of metabolic stress and hemolysis.
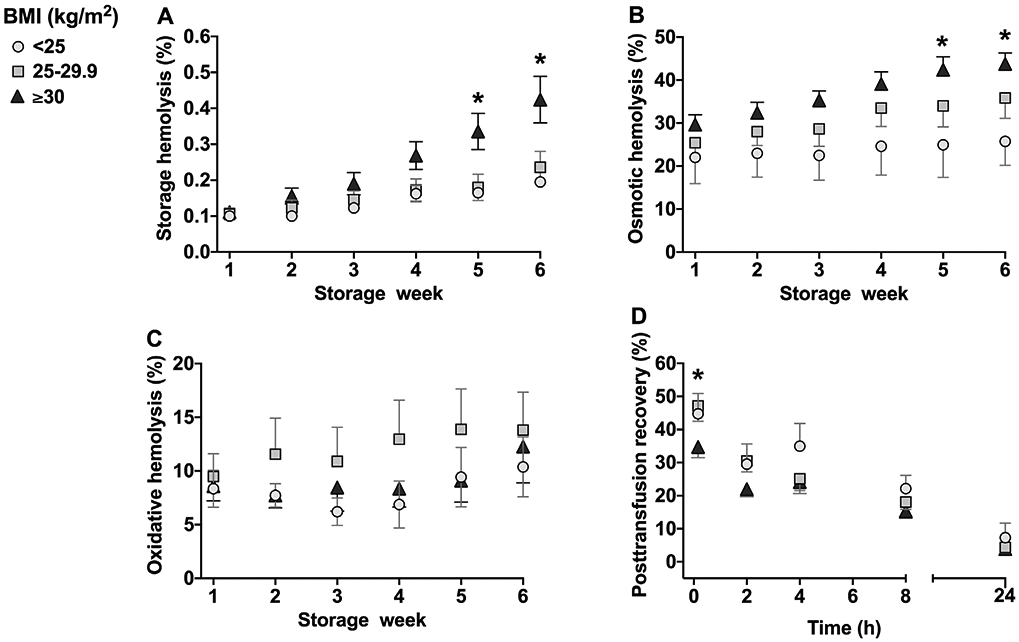
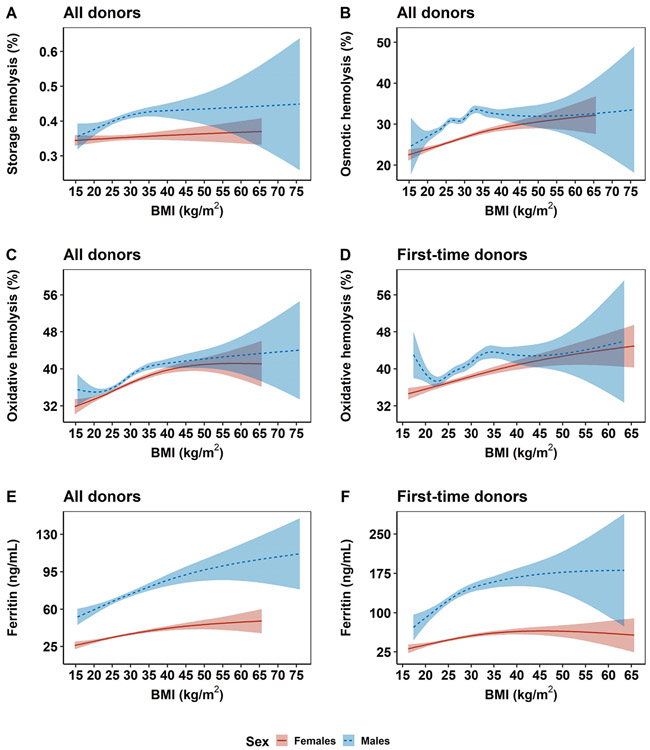
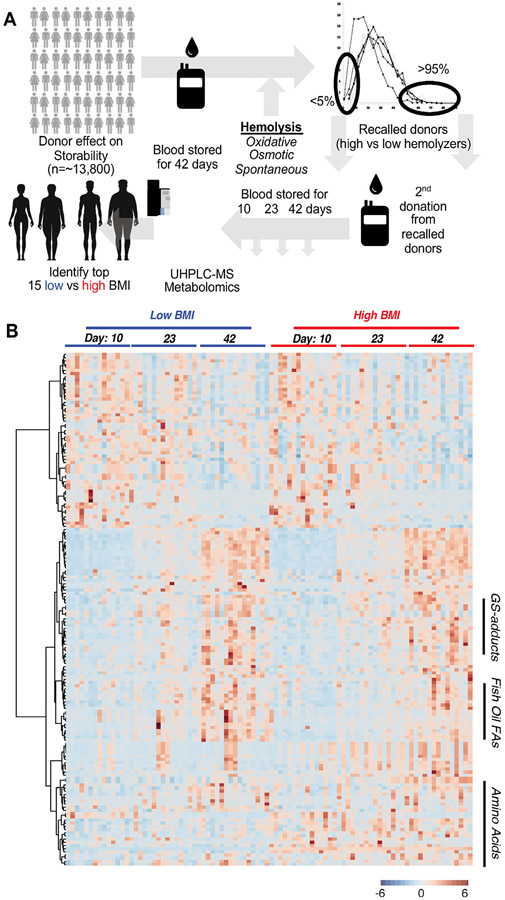
Study design and methods: The associations between donor BMI (<25 kg/m2 , normal weight; 25-29.9 kg/m2 , overweight; and ≥30 kg/m2 , obese) and hemolysis (storage, osmotic, and oxidative; n = 18 donors) or posttransfusion recovery (n = 14 donors) in immunodeficient mice were determined in stored leukocyte-reduced RBC units. Further evaluations were conducted using the National Heart, Lung, and Blood Institute RBC-Omics blood donor databases of hemolysis (n = 13 317) and metabolomics (n = 203).
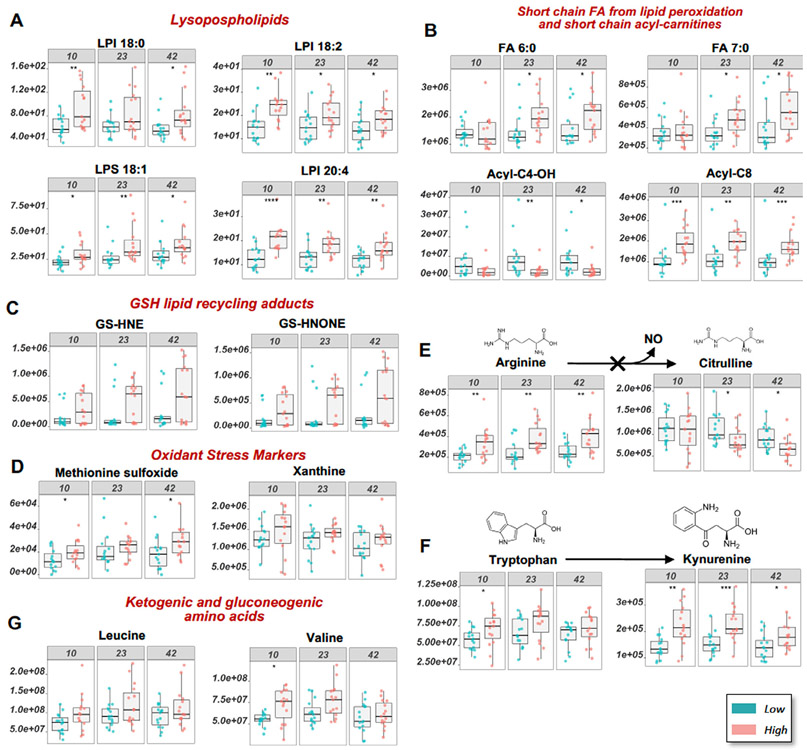
Results: Evaluations in 18 donors revealed that BMI was significantly (P < 0.05) and positively associated with storage and osmotic hemolysis. A BMI of 30 kg/m2 or greater was also associated with lower posttransfusion recovery in mice 10 minutes after transfusion (P = 0.026). Multivariable linear regression analyses in RBC-Omics revealed that BMI was a significant modifier for all hemolysis measurements, explaining 4.5%, 4.2%, and 0.2% of the variance in osmotic, oxidative, and storage hemolysis, respectively. In this cohort, obesity was positively associated (P < 0.001) with plasma ferritin (inflammation marker). Metabolomic analyses on RBCs from obese donors (44.1 ± 5.1 kg/m2 ) had altered membrane lipid composition, dysregulation of antioxidant pathways (eg, increased oxidized lipids, methionine sulfoxide, and xanthine), and dysregulation of nitric oxide metabolism, as compared to RBCs from nonobese (20.5 ± 1.0 kg/m2 ) donors.
Conclusions: Obesity is associated with significant changes in RBC metabolism and increased susceptibility to hemolysis under routine storage of RBC units. The impact on transfusion efficacy warrants further evaluation.
Keywords: BMI; blood donors; hemolysis; obesity; red blood cells.
© 2020 AABB.
Conflict of interest statement
CONFLICT OF INTEREST
Though unrelated to the contents of the manuscript, A.D.A. is a founder of Omix Technologies Inc and Altis LLC, and a consultant for Hemanext Inc. All the other authors declare no conflicts of interest.
Figures
Comment in
-
How red blood cell quality is starting to carry its weight.Transfusion. 2021 Feb;61(2):336-339. doi: 10.1111/trf.16264. Transfusion. 2021. PMID: 33616923 No abstract available.
References
-
- Kyrou I, Randeva HS, Tsigos C, Kaltsas G, Weickert MO. Clinical problems caused by obesity In: Feingold KR, Anawalt B, Boyce A, et al. , editors. Endotext. South Dartmouth, MA: MDText.com, Inc, 2000.
-
- Apovian CM. Obesity: Definition, comorbidities, causes, and burden. Am J Manag Care. 2016;22:s176–s185. - PubMed
-
- Hales CM, Carroll MD, Fryar CD, Ogden CL. Prevalence of obesity and severe obesity among adults: United States, 2017–2018 NCHS Data Brief, no 360. Hyattsville, MD: National Center for Health Statistics, 2020. - PubMed
Publication types
MeSH terms
Substances
Grants and funding
- R01 HL146442/HL/NHLBI NIH HHS/United States
- HHSN268201100008C/HL/NHLBI NIH HHS/United States
- R56 HL134653/HL/NHLBI NIH HHS/United States
- HHSN268201100005I/HL/NHLBI NIH HHS/United States
- HHSN268201100002C/WH/WHI NIH HHS/United States
- R01 HL148151/HL/NHLBI NIH HHS/United States
- HHSN268201100002I/HL/NHLBI NIH HHS/United States
- HHSN268201100001C/WH/WHI NIH HHS/United States
- HHSN268201100004C/WH/WHI NIH HHS/United States
- HHSN268201100001I/HL/NHLBI NIH HHS/United States
- HHSN268201100009I/HL/NHLBI NIH HHS/United States
- HHSN268201100005G/HL/NHLBI NIH HHS/United States
- HHSN268201100004I/HL/NHLBI NIH HHS/United States
- HHSN268201100008I/HL/NHLBI NIH HHS/United States
- R01 HL134653/HL/NHLBI NIH HHS/United States
- HHSN268201100003C/WH/WHI NIH HHS/United States
- HHSN268201100006C/HL/NHLBI NIH HHS/United States
- R01 HL098032/HL/NHLBI NIH HHS/United States
- HHSN268201100009C/HL/NHLBI NIH HHS/United States
- R21 HL150032/HL/NHLBI NIH HHS/United States
- HHSN268201100005C/HL/NHLBI NIH HHS/United States
- R01 HL149714/HL/NHLBI NIH HHS/United States
- HHSN268201100003I/HL/NHLBI NIH HHS/United States
