

Preclinical Models to Study Obesity and Breast Cancer in Females: Considerations, Caveats, and Tools
- PMID: 33146844
- PMCID: PMC8197449
- DOI: 10.1007/s10911-020-09463-2
Preclinical Models to Study Obesity and Breast Cancer in Females: Considerations, Caveats, and Tools
Abstract
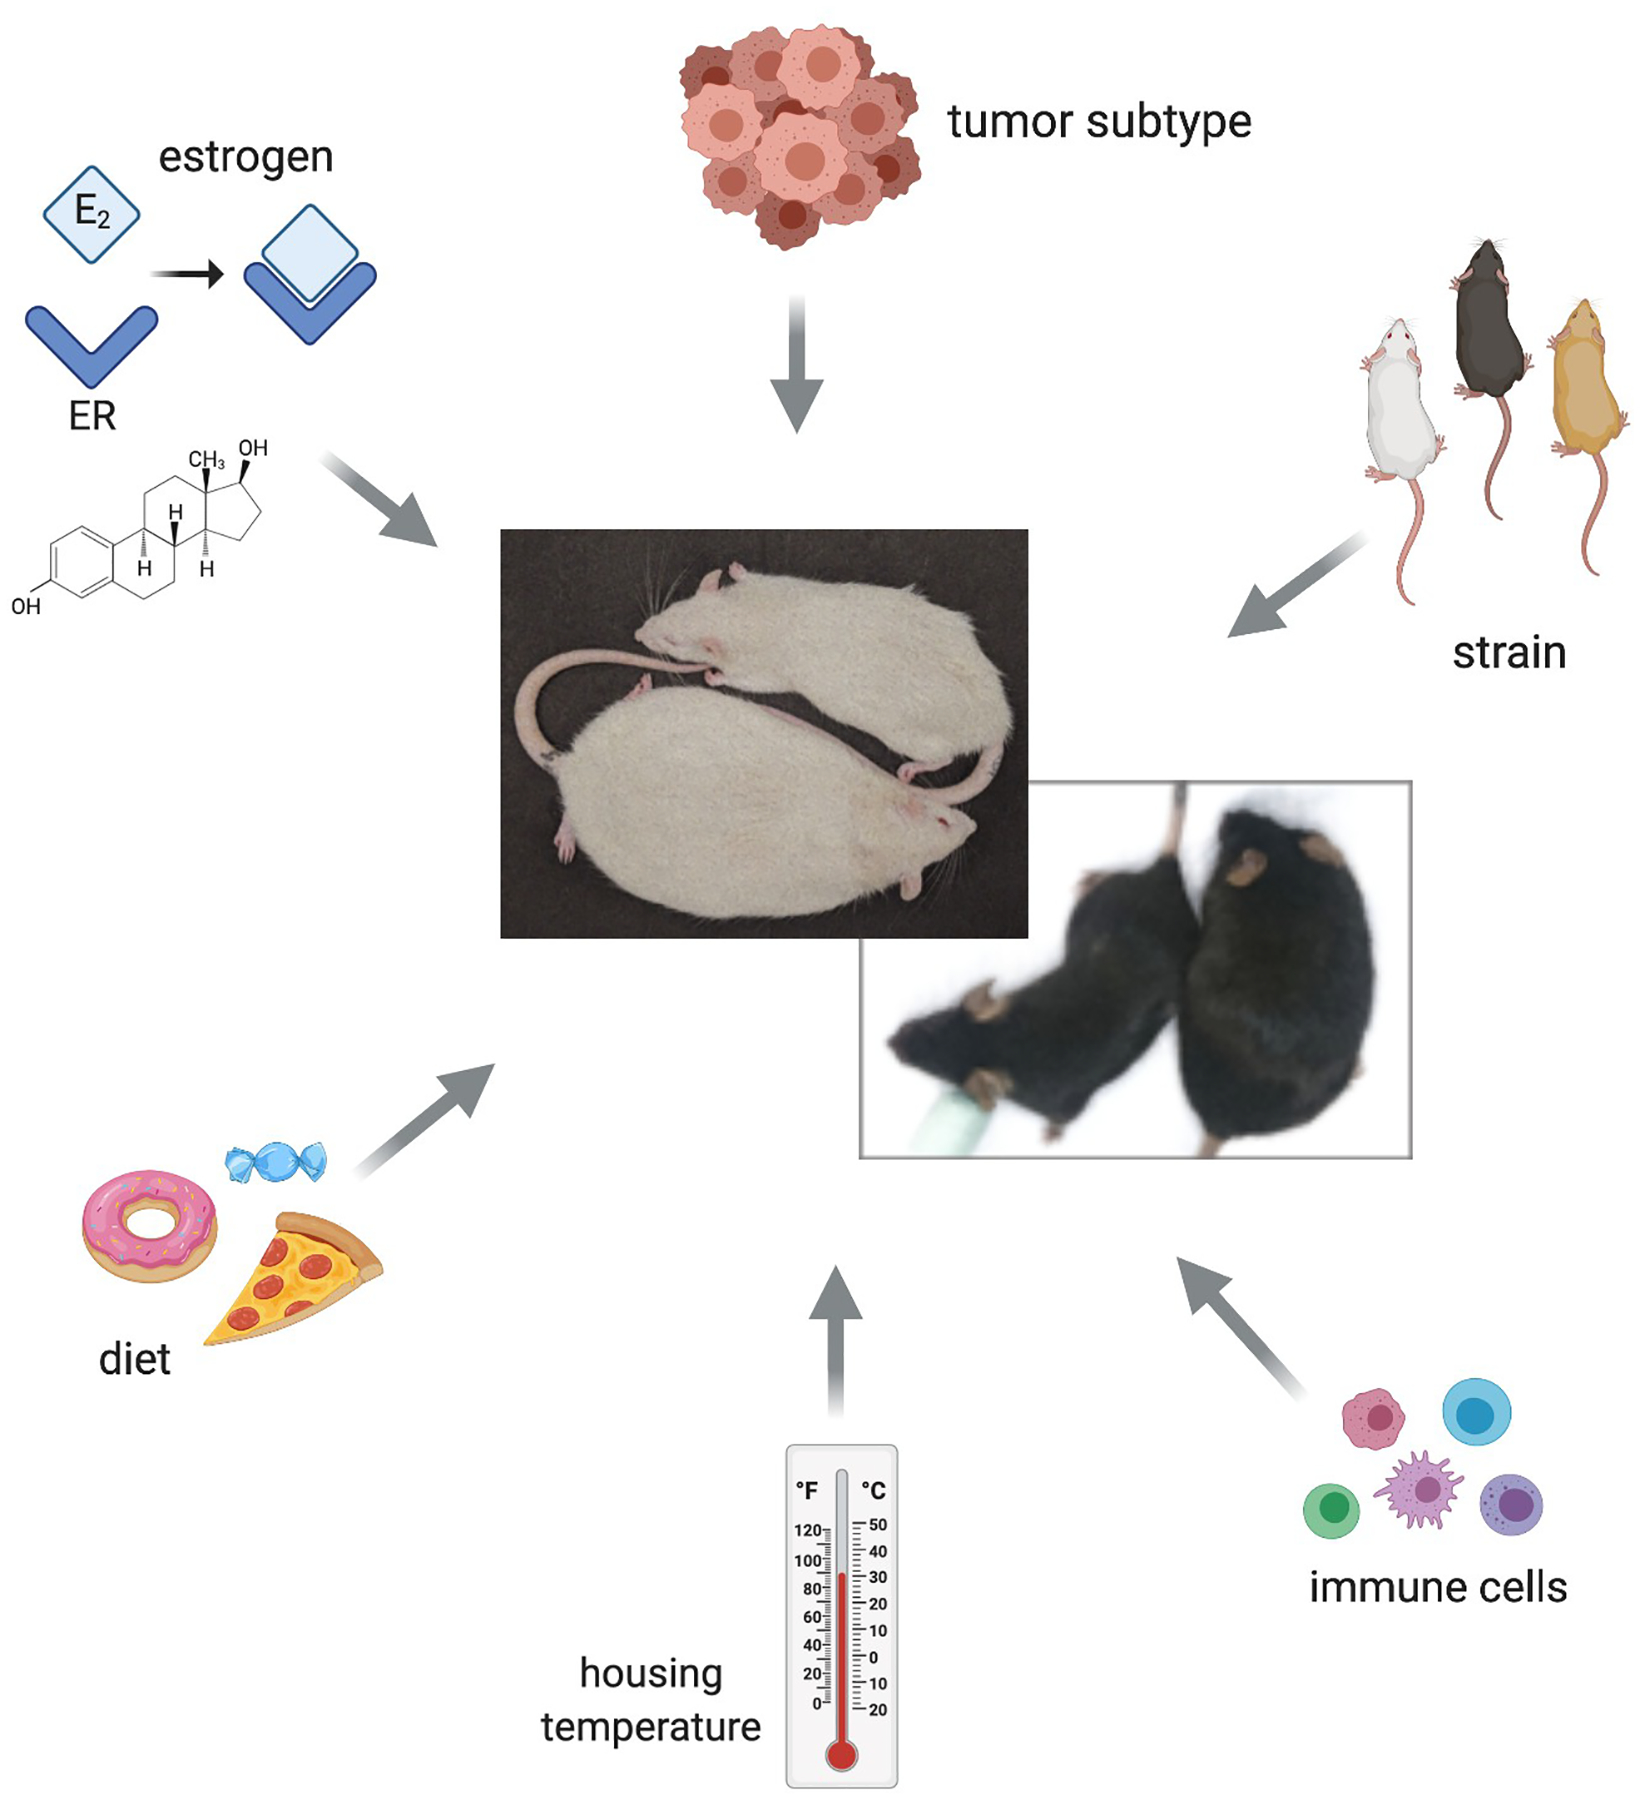
Obesity increases the risk for breast cancer and is associated with poor outcomes for cancer patients. A variety of rodent models have been used to investigate these relationships; however, key differences in experimental approaches, as well as unique aspects of rodent physiology lead to variability in how these valuable models are implemented. We combine expertise in the development and implementation of preclinical models of obesity and breast cancer to disseminate effective practices for studies that integrate these fields. In this review, we share, based on our experience, key considerations for model selection, highlighting important technical nuances and tips for use of preclinical models in studies that integrate obesity with breast cancer risk and progression. We describe relevant mouse and rat paradigms, specifically highlighting differences in breast tumor subtypes, estrogen production, and strategies to manipulate hormone levels. We also outline options for diet composition and housing environments to promote obesity in female rodents. While we have applied our experience to understanding obesity-associated breast cancer, the experimental variables we incorporate have relevance to multiple fields that investigate women's health.
Keywords: Adipose tissue; Breast cancer; Carcinogen; Diet; Menopause; Obesity; Ovariectomy; Preclinical model; Thermoneutrality; Tumor subtype.
Conflict of interest statement
Figures
Similar articles
-
Effects of high fat diet-induced obesity on mammary tumorigenesis in the PyMT/MMTV murine model.Cancer Biol Ther. 2019;20(4):487-496. doi: 10.1080/15384047.2018.1537574. Epub 2018 Nov 2. Cancer Biol Ther. 2019. PMID: 30388923 Free PMC article.
-
Early Exposure to a High Fat/High Sugar Diet Increases the Mammary Stem Cell Compartment and Mammary Tumor Risk in Female Mice.Cancer Prev Res (Phila). 2017 Oct;10(10):553-562. doi: 10.1158/1940-6207.CAPR-17-0131. Epub 2017 Sep 13. Cancer Prev Res (Phila). 2017. PMID: 28904060
-
Diet and breast cancer: a review.Am J Clin Nutr. 1978 Nov;31(11):2005-16. doi: 10.1093/ajcn/31.11.2005. Am J Clin Nutr. 1978. PMID: 362882 Review.
-
Vitamin D mitigates the adverse effects of obesity on breast cancer in mice.Endocr Relat Cancer. 2016 Apr;23(4):251-64. doi: 10.1530/ERC-15-0557. Epub 2016 Jan 27. Endocr Relat Cancer. 2016. PMID: 26817629 Free PMC article.
-
Mammary gland neoplasia in long-term rodent studies.Environ Health Perspect. 1996 Sep;104(9):938-67. doi: 10.1289/ehp.96104938. Environ Health Perspect. 1996. PMID: 8899375 Free PMC article. Review.
Cited by
-
Unlocking Translational Potential: Conditionally Reprogrammed Cells in Advancing Breast Cancer Research.Cells. 2023 Sep 30;12(19):2388. doi: 10.3390/cells12192388. Cells. 2023. PMID: 37830602 Free PMC article. Review.
-
Breast Cancer Endocrine Therapy Promotes Weight Gain With Distinct Adipose Tissue Effects in Lean and Obese Female Mice.Endocrinology. 2021 Nov 1;162(11):bqab174. doi: 10.1210/endocr/bqab174. Endocrinology. 2021. PMID: 34410380 Free PMC article.
-
Diabetes mellitus in breast cancer survivors: metabolic effects of endocrine therapy.Nat Rev Endocrinol. 2024 Jan;20(1):16-26. doi: 10.1038/s41574-023-00899-0. Epub 2023 Oct 2. Nat Rev Endocrinol. 2024. PMID: 37783846 Free PMC article. Review.
-
Short-term consumption of the modified standard American diet perturbed the metabolic balance and altered DNA damage in MMTV-PyMT transgenic mice.Breast Cancer Res. 2025 Jul 25;27(1):138. doi: 10.1186/s13058-025-02075-w. Breast Cancer Res. 2025. PMID: 40713647 Free PMC article.
-
Bioinformatics Analysis Reveals the Related Role of miR-511-5p in the Progression of Breast Cancer.J Healthc Eng. 2022 Feb 10;2022:7146338. doi: 10.1155/2022/7146338. eCollection 2022. J Healthc Eng. 2022. PMID: 35186236 Free PMC article.
References
-
- Hales CM, Carroll MD, Fryar CD, Ogden CL. Prevalence of Obesity Among Adults and Youth: United States, 2015–2016. NCHS Data Brief. 2017(288):1–8. - PubMed
Publication types
MeSH terms
Substances
Grants and funding
- CA169430/CA/NCI NIH HHS/United States
- P30 DK048520/DK/NIDDK NIH HHS/United States
- CCR17483321/KOMEN/Susan G. Komen/United States
- CA241156/CA/NCI NIH HHS/United States
- R00 CA169430/CA/NCI NIH HHS/United States
- DK48520/DK/NIDDK NIH HHS/United States
- CA164166/CA/NCI NIH HHS/United States
- R25 CA203650/CA/NCI NIH HHS/United States
- R01 CA164166/CA/NCI NIH HHS/United States
- K99 CA169430/CA/NCI NIH HHS/United States
- R01 CA241156/CA/NCI NIH HHS/United States
- CA203650/CA/NCI NIH HHS/United States
- KL2 TR002534/TR/NCATS NIH HHS/United States
LinkOut - more resources
Full Text Sources
Medical
