The Human Protein Atlas-Spatial localization of the human proteome in health and disease
- PMID: 33146890
- PMCID: PMC7737765
- DOI: 10.1002/pro.3987
The Human Protein Atlas-Spatial localization of the human proteome in health and disease
Abstract
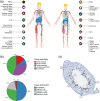
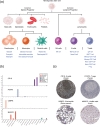
For a complete understanding of a system's processes and each protein's role in health and disease, it is essential to study protein expression with a spatial resolution, as the exact location of proteins at tissue, cellular, or subcellular levels is tightly linked to protein function. The Human Protein Atlas (HPA) project is a large-scale initiative aiming at mapping the entire human proteome using antibody-based proteomics and integration of various other omics technologies. The publicly available knowledge resource www.proteinatlas.org is one of the world's most visited biological databases and has been extensively updated during the last few years. The current version is divided into six main sections, each focusing on particular aspects of the human proteome: (a) the Tissue Atlas showing the distribution of proteins across all major tissues and organs in the human body; (b) the Cell Atlas showing the subcellular localization of proteins in single cells; (c) the Pathology Atlas showing the impact of protein levels on survival of patients with cancer; (d) the Blood Atlas showing the expression profiles of blood cells and actively secreted proteins; (e) the Brain Atlas showing the distribution of proteins in human, mouse, and pig brain; and (f) the Metabolic Atlas showing the involvement of proteins in human metabolism. The HPA constitutes an important resource for further understanding of human biology, and the publicly available datasets hold much promise for integration with other emerging efforts focusing on single cell analyses, both at transcriptomic and proteomic level.
Keywords: Human Protein Atlas; antibodies; cells; proteomics; single-cell; tissues; transcriptomics.
© 2020 The Protein Society.
Figures


Similar articles
-
The human protein atlas: A spatial map of the human proteome.Protein Sci. 2018 Jan;27(1):233-244. doi: 10.1002/pro.3307. Epub 2017 Oct 10. Protein Sci. 2018. PMID: 28940711 Free PMC article.
-
The human protein atlas-Integrated omics for single cell mapping of the human proteome.Protein Sci. 2023 Feb;32(2):e4562. doi: 10.1002/pro.4562. Protein Sci. 2023. PMID: 36604173 Free PMC article.
-
The human secretome.Sci Signal. 2019 Nov 26;12(609):eaaz0274. doi: 10.1126/scisignal.aaz0274. Sci Signal. 2019. PMID: 31772123
-
Manual evaluation of tissue microarrays in a high-throughput research project: The contribution of Indian surgical pathology to the Human Protein Atlas (HPA) project.Proteomics. 2016 Apr;16(8):1266-70. doi: 10.1002/pmic.201500409. Epub 2016 Mar 29. Proteomics. 2016. PMID: 26748468 Review.
-
The Human Protein Atlas as a proteomic resource for biomarker discovery.J Intern Med. 2011 Nov;270(5):428-46. doi: 10.1111/j.1365-2796.2011.02427.x. Epub 2011 Aug 3. J Intern Med. 2011. PMID: 21752111 Review.
Cited by
-
Knockdown of DJ-1 Resulted in a Coordinated Activation of the Innate Immune Antiviral Response in HEK293 Cell Line.Int J Mol Sci. 2024 Jul 10;25(14):7550. doi: 10.3390/ijms25147550. Int J Mol Sci. 2024. PMID: 39062793 Free PMC article.
-
Mechanisms of action of Sappan lignum for prostate cancer treatment: network pharmacology, molecular docking and experimental validation.Front Pharmacol. 2024 Sep 10;15:1407525. doi: 10.3389/fphar.2024.1407525. eCollection 2024. Front Pharmacol. 2024. PMID: 39318781 Free PMC article.
-
Integrated multiplex network based approach reveled CC and CXC chemokines associated key biomarkers in colon adenocarcinoma patients.Am J Cancer Res. 2023 Nov 15;13(11):5531-5548. eCollection 2023. Am J Cancer Res. 2023. PMID: 38058831 Free PMC article.
-
Potential Role of Seven Proteomics Tissue Biomarkers for Diagnosis and Prognosis of Prostate Cancer in Urine.Diagnostics (Basel). 2022 Dec 16;12(12):3184. doi: 10.3390/diagnostics12123184. Diagnostics (Basel). 2022. PMID: 36553191 Free PMC article.
-
Exploring the diagnostic value, prognostic value, and biological functions of NPC gene family members in hepatocellular carcinoma based on a multi-omics analysis.Funct Integr Genomics. 2023 Aug 4;23(3):264. doi: 10.1007/s10142-023-01195-w. Funct Integr Genomics. 2023. PMID: 37541978
References
-
- Uhlen M, Fagerberg L, Hallstrom BM, et al. Proteomics. Tissue‐based map of the human proteome. Science. 2015;347:1260419. - PubMed
-
- Thul PJ, Akesson L, Wiking M, et al. A subcellular map of the human proteome. Science. 2017;356:eaal3321. - PubMed
-
- Uhlen M, Zhang C, Lee S, et al. A pathology atlas of the human cancer transcriptome. Science. 2017;357:eaan2507. - PubMed
-
- Uhlen M, Karlsson MJ, Zhong W, et al. A genome‐wide transcriptomic analysis of protein‐coding genes in human blood cells. Science. 2019;366:eaax9198. - PubMed
Publication types
MeSH terms
Substances
LinkOut - more resources
Full Text Sources
Medical

