. 2021 Feb;599(4):1199-1224.
doi: 10.1113/JP280684. Epub 2020 Nov 22.

Oxygen transport kinetics underpin rapid and robust diaphragm recovery following chronic spinal cord injury

Affiliations

Oxygen transport kinetics underpin rapid and robust diaphragm recovery following chronic spinal cord injury

Philippa M Warren et al. J Physiol. 2021 Feb.

Abstract

Key points: Spinal treatment can restore diaphragm function in all animals 1 month following C2 hemisection induced paralysis. Greater recovery occurs the longer after injury the treatment is applied. Through advanced assessment of muscle mechanics, innovative histology and oxygen tension modelling, we have comprehensively characterized in vivo diaphragm function and phenotype. Muscle work loops reveal a significant deficit in diaphragm functional properties following chronic injury and paralysis, which are normalized following restored muscle activity caused by plasticity-induced spinal reconnection. Injury causes global and local alterations in diaphragm muscle vascular supply, limiting oxygen diffusion and disturbing function. Restoration of muscle activity reverses these alterations, restoring oxygen supply to the tissue and enabling recovery of muscle functional properties. There remain metabolic deficits following restoration of diaphragm activity, probably explaining only partial functional recovery. We hypothesize that these deficits need to be resolved to restore complete respiratory motor function.

Abstract: Months after spinal cord injury (SCI), respiratory deficits remain the primary cause of morbidity and mortality for patients. It is possible to induce partial respiratory motor functional recovery in chronic SCI following 2 weeks of spinal neuroplasticity. However, the peripheral mechanisms underpinning this recovery are largely unknown, limiting development of new clinical treatments with potential for complete functional restoration. Utilizing a rat hemisection model, diaphragm function and paralysis was assessed and recovered at chronic time points following trauma through chondroitinase ABC induced neuroplasticity. We simulated the diaphragm's in vivo cyclical length change and activity patterns using the work loop technique at the same time as assessing global and local measures of the muscles histology to quantify changes in muscle phenotype, microvascular composition, and oxidative capacity following injury and recovery. These data were fed into a physiologically informed model of tissue oxygen transport. We demonstrate that hemidiaphragm paralysis causes muscle fibre hypertrophy, maintaining global oxygen supply, although it alters isolated muscle kinetics, limiting respiratory function. Treatment induced recovery of respiratory activity normalized these effects, increasing oxygen supply, restoring optimal diaphragm functional properties. However, metabolic demands of the diaphragm were significantly reduced following both injury and recovery, potentially limiting restoration of normal muscle performance. The mechanism of rapid respiratory muscle recovery following spinal trauma occurs through oxygen transport, metabolic demand and functional dynamics of striated muscle. Overall, these data support a systems-wide approach to the treatment of SCI, and identify new targets to mediate complete respiratory recovery.

Keywords: angiogenesis; capillary domain area; diaphragm; mechanical properties; spinal cord injury.


Figures

Figure 1
Figure 1. Induction of spinal plasticity restores ipsilateral hemidiaphragm function after cervical injury
Data are shown from control (red; group 1), injury (blue; groups 2&3) and ChABC (green; group 4) animals. AC, representative diaEMG recordings for control (red), injury (blue) and ChABC groups (green; both pre‐ (BL) or post‐treatment) (n = 5–12). All data presented are from the same animal. D, average amplitude of ipsilateral and contralateral diaEMG. E–G, ventilatory parameters showing (E) breath length, (F) cycle length and (G) breath frequency for whole diaphragm. For all graphs, triangle data points represent group 3 animals. For (A) to (G), pre‐treatment (BL) recordings of ChABC animals were conducted 2 weeks prior to the other recordings shown. H, representative diaEMG recordings of SCI animals treated with ChABC at varying time points from the time of injury (n = 3–9). Data obtained from groups 1, 3, 4 and independently treated animals. Ipsilateral and contralateral recordings are from the same animal at each time point. Data assessed via one‐ or two‐way ANOVA with the following sample sizes: control = 12, injury = 7, ChABC = 5. * P < 0.05, ** P < 0.01 and **** P < 0.0001. If no post hoc result is shown, the comparison was not significant. Values represent the mean ± SD. Abbreviations: Ipsi, ipsilateral; contra, contralateral hemidiaphragm recordings. [Color figure can be viewed at wileyonlinelibrary.com]
Figure 2
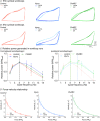
Figure 2. Injury alters optimal diaphragm functional parameters, which are shifted back towards normal following ChABC treatment
A and B, representative work loops at 5 Hz (A) and 8 Hz (B). In all muscles there is little change in re‐lengthening. C, relative net power–frequency relationship (normalized to the maximum net power) for the contralateral and ipsilateral hemidiaphragms. Vertical dashed lines indicate the cycle frequency at which maximum relative power is generated from the different experimental groups. Data assessed via Kruskal–Wallis with the following sample sizes: control ipsi = 14; control contra = 10; injury ipsi = 7; injury contra = 6; ChABC ipsi = 5; ChABC contra = 5. D, force–velocity relationship for all groups. All data are from control (red; group 1), injury (blue; groups 2&3) and ChABC (green; group 4) animals. * P < 0.05 and ** P < 0.01. If no post hoc result is shown, the comparison was not significant. Values represent the mean ± SD. Abbreviations: Ipsi, ipsilateral; contra, contralateral hemidiaphragm recordings. [Color figure can be viewed at wileyonlinelibrary.com]
Figure 3
Figure 3. Injury causes hypertrophy of ipsilateral muscle fibres, which is resolved following ChABC treatment and recovery of EMG function
AF, immunohistochemistry of diaphragm muscle for Type I (BA‐D5; red), Type IIa (SC‐71; green) and laminin (blue). G, fibre type specific changes for average fibre area. The global angiogenic response to injury and ChABC treatment shown through (H) fibre cross‐sectional area (FCSA), (I) capillary density (CD) and (J) the capillary to fibre ratio (C:F). K, fibre type specific changes for relative numerical density. All graphs show control (red; group 1), injury (blue; groups 2&3) and ChABC (green; group 4) animals. The data presented are normalized (ipsilateral/contralateral results from the same animal) to control for variance of all extenuating factors. Raw data are presented in the Appendix (Fig. A3). All assessed via ANOVA with all groups of sample size = 5. * P < 0.05, ** P < 0.01 and *** P < 0.001. If no post hoc result is shown, the comparison was not significant. Scale bar = 20 μm. Values represent the mean ± SD. Triangle data points represent group 3 animals. [Color figure can be viewed at wileyonlinelibrary.com]
Figure 4
Figure 4. Local changes in microvascular composition facilitate supply for oxygen in diaphragm tissue after spinal injury
Capillary domain area (A), capillary heterogeneity presented as LogSD (B) and frequency distribution for the capillary domain areas (C). The data presented are normalized (ipsilateral/contralateral results from the same animal) to control for variance of all extenuating factors. Local capillary supply shown for the whole hemidiaphragm through (D) local capillary density and (E) local capillary to fibre ratio shown correlated for fibre size. All graphs show control (red; group 1), injury (blue; groups 2&3) and ChABC (green; group 4) animals. Additional normalized and raw data shown in the Appendix (Fig. A4). All assessed via ANOVA with all groups of sample size = 5. * P < 0.05, ** P < 0.01 and *** P < 0.001. Values represent the mean ± SD. Triangle data points represent group 3 animals. Abbreviations: Ipsi, ipsilateral; contra, contralateral hemidiaphragm recordings. [Color figure can be viewed at wileyonlinelibrary.com]
Figure 5
Figure 5. Demand for oxygen deficient the diaphragm following both spinal injury and neurological recovery
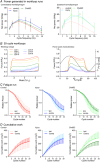
A, amounts of citrate synthase activity in hemidiaphragm muscle tissue. Sample sizes: control ipsi = 5; control contra = 5; injury ipsi = 7; injury contra = 7; ChABC ipsi = 5; ChABC contra = 5. B, oxygen transport models for moderate muscle activity showing Po2 of diaphragm tissue with alterations for mitochondrial content (CS). CH, representative images of oxygen transport modelling showing a Po2 of 15 mmHg (blue) to 30 mmHg (red). I, Oxygen transport models for moderate muscle activity showing MO2 of diaphragm tissue with CS alterations. The data presented are normalized (ipsilateral/contralateral results from the same animal) to control for variance of all extenuating factors. All graphs show control (red; group 1), injury (blue; groups 2&3) and ChABC (green; group 4) animals. Additional normalized and raw data shown in the Appendix (Fig. A5). Data assessed via ANOVA. B and I, normalized sample size of groups = 5. Sample sizes raw data: control ipsi = 5; control contra = 5; injury ipsi = 6; injury contra = 6; ChABC ipsi = 5; ChABC contra = 5. * P < 0.05, ** P < 0.01 and *** P < 0.001. If no post hoc result is shown, the comparison was not significant. Scale bar = 20 μm. Values represent the mean ± SD. Triangle data points represent group 3 animals. Abbreviations: Ipsi, ipsilateral; contra, contralateral hemidiaphragm recordings. [Color figure can be viewed at wileyonlinelibrary.com]
Figure A1
Figure A1. Injury model and experimental paradigm
A, experimental protocol. B, schematic of inspiratory respiratory motor inputs to the diaphragm after a lateral C2 hemisection and image of a hemidiaphragm showing rostral section taken for muscle analysis (blue). C, representative trace of twitch and tetanus protocol. In a twitch, the stimulation is brief meaning that the muscle starts to relax before reaching peak force. If multiple contractions occur before complete relaxation of the muscle, the twitch summates. With a stimulus train the muscle reaches peak force and plateaus, causing tetanic contraction. D, representative figure showing heterogeneous fibre type distribution in the hemidiaphragm. Scale bar = 10 μm. [Color figure can be viewed at wileyonlinelibrary.com]
Figure A2
Figure A2. Effect of numerous fatigue cycles on the work produced by the diaphragm
A, power–frequency relationship for the contralateral and ipsilateral hemidiaphragms. Vertical dashed lines represent optimal frequency from different experimental groups. Data assessed via Kruskal‐Wallis with the following sample sizes: control ipsi = 12; control contra = 10; injury ipsi = 6; injury contra = 6; ChABC ipsi = 6; ChABC contra = 5. B, representative examples of 30 continuous 2 Hz fatigue cycles on work‐loop shape and force–cycle characteristics (from ipsilateral control tissue) demonstrating how the run reduces the net power output of the muscle. C, relative net power output during a 2 Hz fatigue run with power relative to the initial cycle. All graphs show control (red), injury (blue) and ChABC (green) groups. Data assessed via two‐way ANOVA with the following sample sizes: control ipsi = 12; control contra = 10; injury ipsi = 7; injury contra = 6; ChABC ipsi = 5; ChABC contra = 5. D, cumulative work produced during a 2 Hz fatigue run. Data assessed via two‐way ANOVA with the following sample sizes: control ipsi = 12; control contra = 10; injury ipsi = 7; injury contra = 6; ChABC ipsi = 5; ChABC contra = 5. Graphs show control (red; group 1), injury (blue; groups 2&3) and ChABC (green; group 4) animals. * P < 0.05 and *** P < 0.001. If no post hoc result is shown, the comparison was not significant. Values represent the mean ± SD. Abbreviations: Ipsi, ipsilateral; contra, contralateral hemidiaphragm recordings. [Color figure can be viewed at wileyonlinelibrary.com]
Figure A3
Figure A3. Raw data from experimental groups showing the hypertrophy of muscle fibres caused by the injury and subsequent rarefaction generated by ChABC mediated recovery of function
A, fibre type specific changes for average fibre area. The global angiogenic response to injury and ChABC treatment shown through (B) fibre cross‐sectional area (FCSA), (C) capillary density (CD) and (D) the capillary to fibre ratio (Capillary:Fibre). E, fibre type specific changes for relative numerical density. All graphs show control (red; group 1), injury (blue; groups 2&3) and ChABC (green; group 4) animals. Normalized data shown in Figure 3. Data assessed via ANOVA with sample sizes: control ipsi = 5; control contra = 6; injury ipsi = 6; injury contra = 6; ChABC ipsi = 5; ChABC contra = 5. * P < 0.05, ** P < 0.01 and *** P < 0.001. If no post hoc result is shown, the comparison was not significant. Values represent the mean ± SD, n = 5–7 per group. Triangle data points represent group 3 animals. Abbreviations: Ipsi, ipsilateral; contra, contralateral hemidiaphragm recordings. [Color figure can be viewed at wileyonlinelibrary.com]
Figure A4
Figure A4. Raw and normalized data from experimental groups showing the local changes in angiogenesis caused by the injury
Capillary domain area (A) and capillary heterogeneity (B) presented as LogSD. Normalized (C) and raw (D) local capillary supply density shown for each fibre type. E, local capillary supply density correlated for fibre size for control tissue. Normalized (F) and (G) raw local capillary to fibre ratio shown for each fibre type and whole diaphragm. All graphs show control (red; group 1), injury (blue; groups 2&3) and ChABC (green; group 4) animals. Additional and normalized data shown in Fig. 4. Data presented in (C) and (F) are normalized (ipsilateral/contralateral results from the same animal) to control for variance of all extenuating factors. Data assessed via ANOVA with normalized sample size of groups = 5. Sample sizes raw data: control ipsi = 5; control contra = 6; injury ipsi = 6; injury contra = 6; ChABC ipsi = 5; ChABC contra = 5. * P < 0.05, ** P < 0.01 and *** P < 0.001. If no post hoc result is shown, the comparison was not significant. Values represent the mean ± SD. Triangle data points represent group 3 animals. Abbreviations: Ipsi, ipsilateral; contra, contralateral hemidiaphragm recordings. [Color figure can be viewed at wileyonlinelibrary.com]
Figure A5
Figure A5. Raw and normalized data for PO2 and MO2 following diaphragm oxygen transport modelling
Oxygen transport models for moderate muscle activity showing (A and B) raw and normalized PO2 and (C) raw MO2 for all fibre types and the whole hemidiaphragm. Modelling occurred following adjusting tissue MO2. values according to mitochondrial content (CS). All graphs show control (red; group 1), injury (blue; groups 2&3) and ChABC (green; group 4) animals. Additional and normalizedata shown in Fig. 5. Data presented in (B) are normalized (ipsilateral/contralateral results from the same animal) to control for variance of all extenuating factors. Data assessed via ANOVA with normalized sample size of groups = 5. Sample sizes raw data: control ipsi = 5; control contra = 5; injury ipsi = 6; injury contra = 6; ChABC ipsi = 5; ChABC contra = 5. * P < 0.05, ** P < 0.01 and *** P < 0.001. If no post hoc result is shown, the comparison was not significant. Values represent the mean ± SD. Triangle data points represent group 3 animals. Abbreviations: Ipsi, ipsilateral; contra, contralateral hemidiaphragm recordings. [Color figure can be viewed at wileyonlinelibrary.com]

Comment in

Similar articles

Cited by

References

    1. Al‐Shammari AA, Kissane RWP, Holbek S, Mackey AL, Andersen TR, Gaffney EA, Kjaer M & Egginton S (2019). Integrated method for quantitative morphometry and oxygen transport modeling in striated muscle. J Appl Physiol 126, 544–557. - PubMed
    1. Alilain WJ & Goshgarian HG (2008). Glutamate receptor plasticity and activity‐regulated cytoskeletal associated protein regulation in the phrenic motor nucleus may mediate spontaneous recovery of the hemidiaphragm following chronic cervical spinal cord injury. Exp Neurol 212, 348–357. - PMC - PubMed
    1. Altringham JD & Young IS (1991). Power output and the frequency of oscillatory work in mammalian diaphragm muscle: the effects of animal size. J Exp Biol 157, 381–389. - PubMed
    1. Ameredes BT, Zhan WZ, Prakash YS, Vandenboom R & Sieck GC (2000). Power fatigue of the rat diaphragm muscle. J Appl Physiol 89, 2215–2219. - PubMed
    1. Askew GN & Marsh RL (1997). The effects of length trajectory on the mechanical power output of mouse skeletal muscles. J Exp Biol 200, 3119–3131. - PubMed

Publication types