. 2020 Nov;19(11):e13257.
doi: 10.1111/acel.13257. Epub 2020 Nov 4.

Autophagic receptor p62 protects against glycation-derived toxicity and enhances viability

Affiliations

Autophagic receptor p62 protects against glycation-derived toxicity and enhances viability

Gemma Aragonès et al. Aging Cell. 2020 Nov.

Abstract

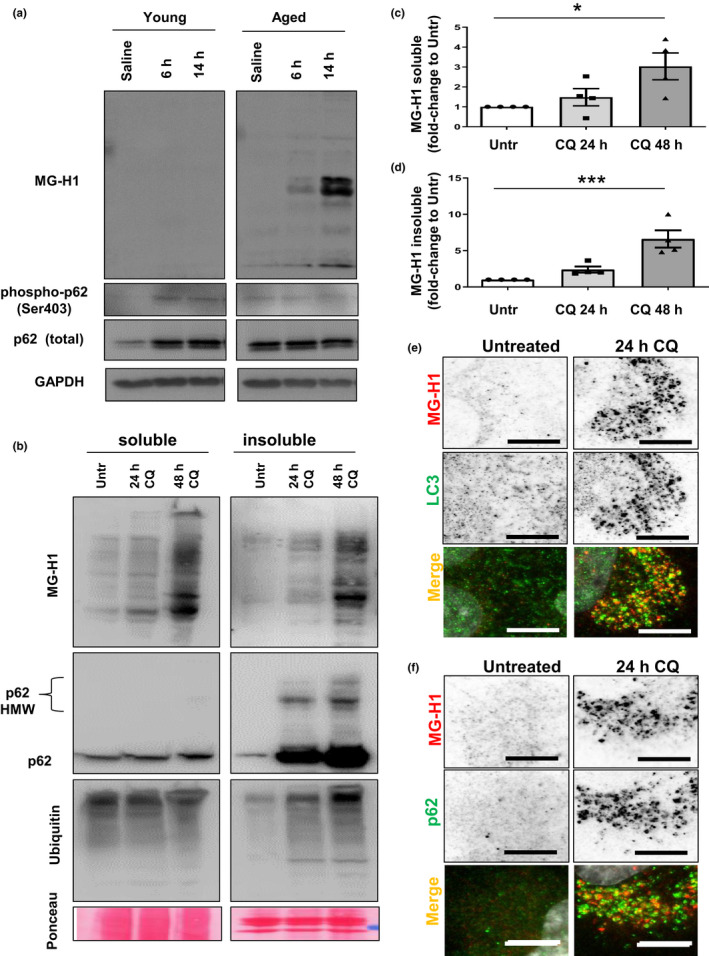
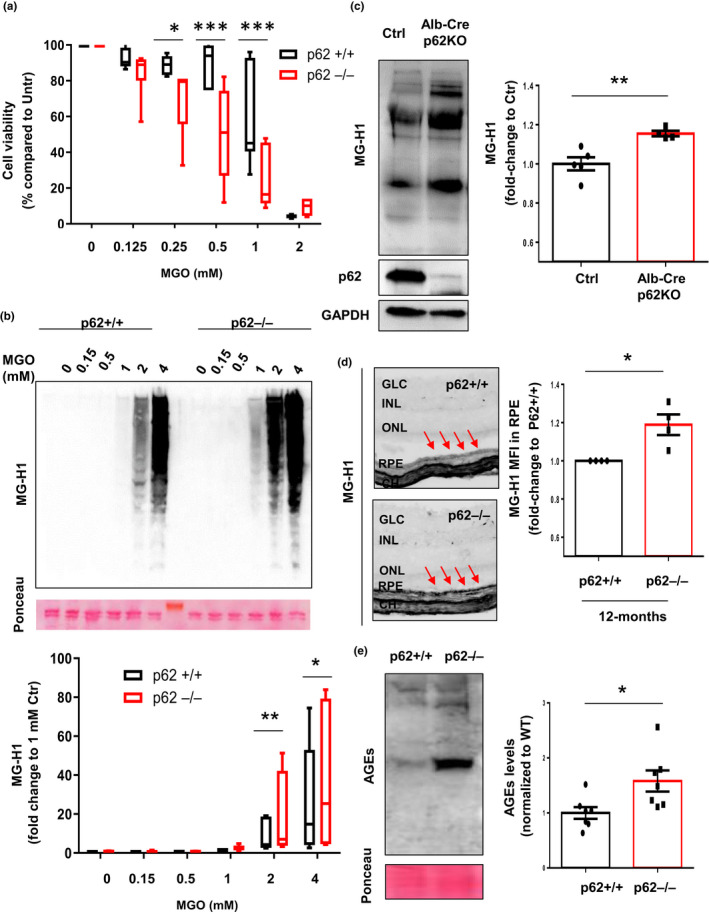
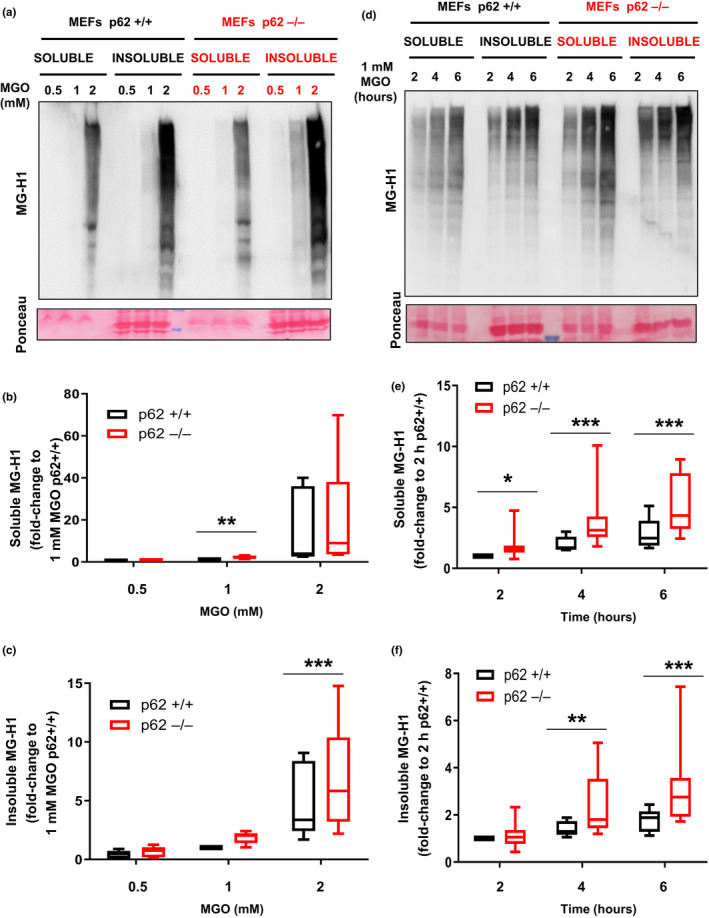
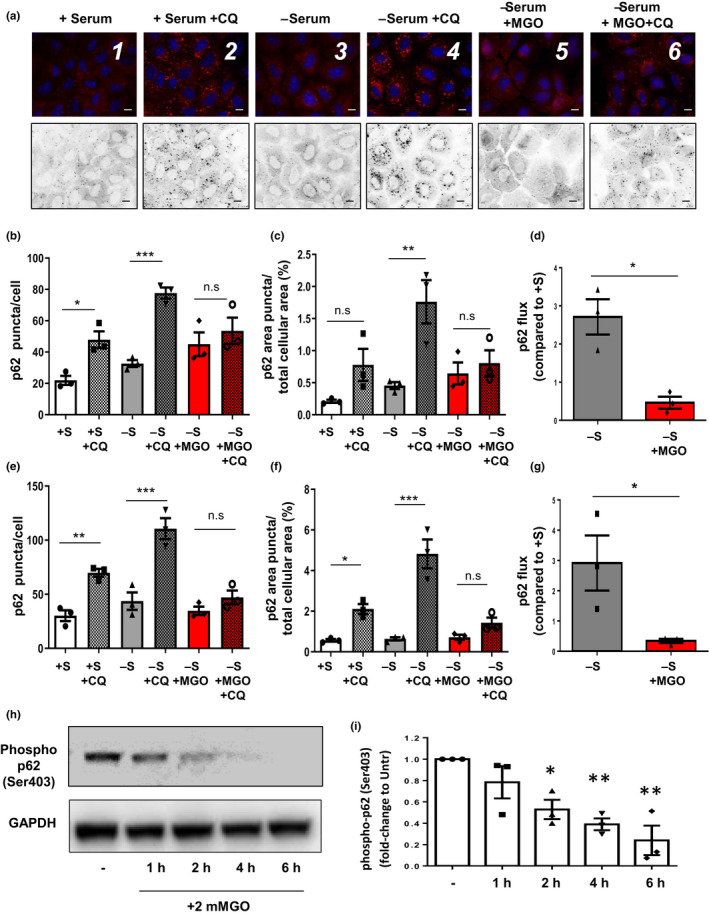
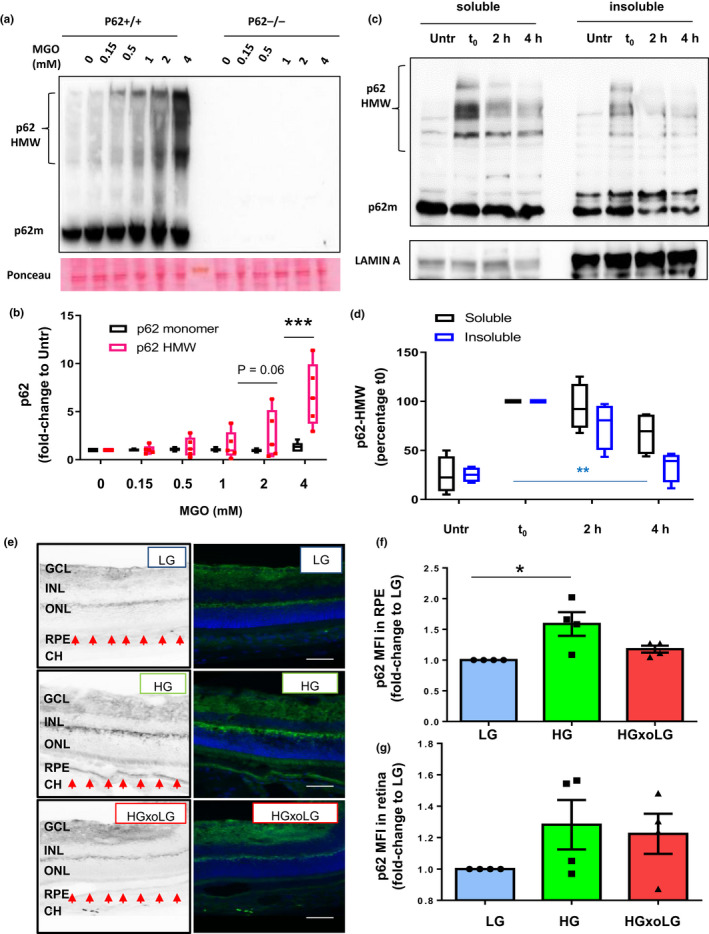
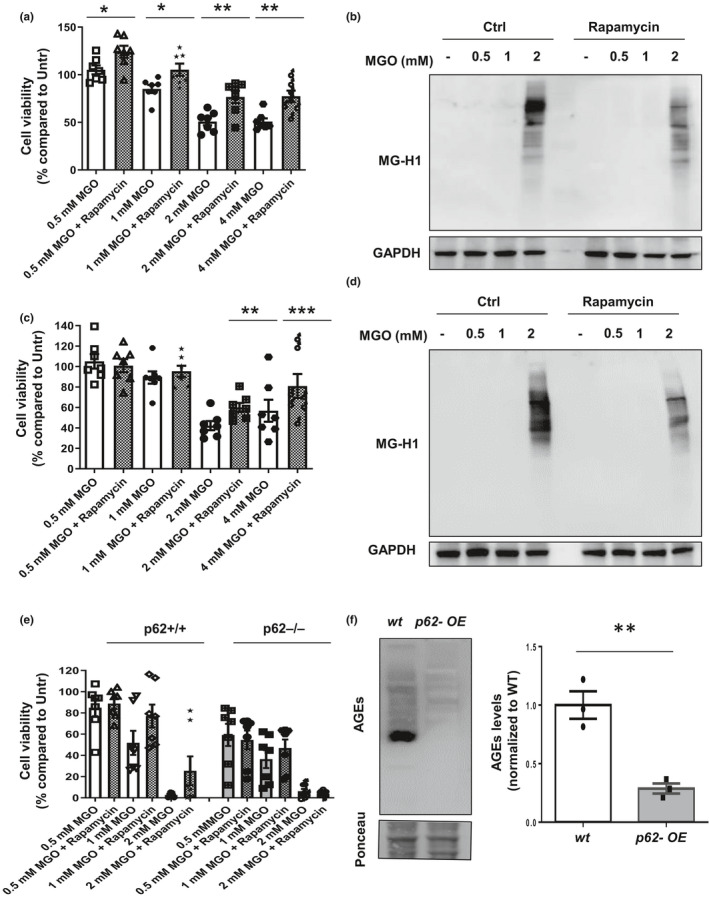
Diabetes and metabolic syndrome are associated with the typical American high glycemia diet and result in accumulation of high levels of advanced glycation end products (AGEs), particularly upon aging. AGEs form when sugars or their metabolites react with proteins. Associated with a myriad of age-related diseases, AGEs accumulate in many tissues and are cytotoxic. To date, efforts to limit glycation pharmacologically have failed in human trials. Thus, it is crucial to identify systems that remove AGEs, but such research is scanty. Here, we determined if and how AGEs might be cleared by autophagy. Our in vivo mouse and C. elegans models, in which we altered proteolysis or glycative burden, as well as experiments in five types of cells, revealed more than six criteria indicating that p62-dependent autophagy is a conserved pathway that plays a critical role in the removal of AGEs. Activation of autophagic removal of AGEs requires p62, and blocking this pathway results in accumulation of AGEs and compromised viability. Deficiency of p62 accelerates accumulation of AGEs in soluble and insoluble fractions. p62 itself is subject to glycative inactivation and accumulates as high mass species. Accumulation of p62 in retinal pigment epithelium is reversed by switching to a lower glycemia diet. Since diminution of glycative damage is associated with reduced risk for age-related diseases, including age-related macular degeneration, cardiovascular disease, diabetes, Alzheimer's, and Parkinson's, discovery of methods to limit AGEs or enhance p62-dependent autophagy offers novel potential therapeutic targets to treat AGEs-related pathologies.

Keywords: aging; autophagy; glycative stress; p62; proteotoxicity.


Conflict of interest statement

The authors declare no conflict of interest.

Figures

Figure 1
Figure 1
Suppression of lysosomal degradation leads to accumulation of endogenous AGEs in autophagosomes. (a) Representative Western blots for MG‐H1 in young (3‐4 months old) and aged (24‐26 months old) rat hippocampus after proteasome inhibition. Note the increased amount of MG‐H1 in the aged group at 6 h and 14 h after lactacystin‐injection. p62 and phospho‐p62 are shown as autophagic markers and GAPDH as loading control. (b) ARPE‐19 maintained in the presence or absence of CQ for either 24 or 48 h were subjected to extraction with 1% Triton X‐100. Soluble (left) and insoluble (right) fractions were immunoblotted for the indicated proteins. (C,D) Quantification of total soluble (c) and insoluble (d) MG‐H1 relative to values in untreated cells. Values are mean ±SEM (n = 4). *p < 0.05 and ***p < 0.001 in one‐way ANOVA followed by Dunnett's multiple comparison test. (e,f) Accumulation of MG‐H1 in autophagosomes. HLECs were maintained in the presence or absence of CQ for 24 h, fixed in cold methanol. (e) anti‐LC3 (green) or (f) anti‐p62 (green) was used to stain autophagosomes along with anti MG‐H1 (red) to detect endogenous AGEs. Red and green channels are shown in black and white in the upper panels for a better visualization. Full fields for panel e and f are shown in SI Appendix Figure S1c (for LC3) and S2A (for p62). Scale bar: 10 μm
Figure 2
Figure 2
Lack of p62 leads to accumulation of AGEs in vitro and in vivo. (a) Viability of p62+/+ and p62−/− MEFs treated with the indicated concentrations of MGO for 24 h was measured by Cell‐Titer assay. Values are mean ±SEM (n = 6). We observed an interaction (p < 0.0001) between the MGO concentration and the genotype using two‐way ANOVA analysis. The differences between p62+/+ and p62−/− after the Sidak's multiple comparison test were significant for the 0.25, 0.5, and 1 mM doses of MGO (*p < 0.05 and ***p < 0.001). (b) Immunoblot for MG‐H1 in whole cellular extracts from WT MEFs (p62+/+) and MEFs lacking p62 (p62−/−). Representative immunoblot (top) and quantification of total levels of MG‐H1 relative to values in treated cells with 1 mM MGO (bottom). Values are mean ±SEM (n = 10). We observed an interaction (p = 0.03) between the MGO concentration and the genotype using two‐way ANOVA analysis. The differences between p62+/+ and p62−/− after the Sidak's multiple comparison test were significant for the 2 and 4 mM doses of MGO (*p < 0.05, **p < 0.01). (c) Immunoblot for MG‐H1 in liver tissues from WT and Alb‐Cre p62−/− mice. Representative immunoblot (left) and quantification of total levels of MG‐H1 relative to values in WT (right). Values are mean ±SEM (n = 5). (d) Representative immunohistochemistry for MG‐H1 in retinal tissues from 12‐month‐old p62+/+ and p62−/− mice (left) and quantification of MFI relative to values in p62+/+ (right). Arrows indicate the retinal pigment epithelial layer. Values are mean ±SEM (n = 5). Abbreviations: CH, choroid; RPE, retinal pigment epithelium; INL, inner nuclear layer; IPL, inner plexiform layer; ONL, outer nuclear layer; GCL, ganglion cell layer. (e) Immunoblot for AGEs in WT and p62−/− C. elegans. Representative immunoblot (left) and quantification of total levels of AGEs relative to values in WT (right). Values are mean ±SEM (n = 7). *p < 0.05, **p < 0.01 and ***p < 0.001
Figure 3
Figure 3
Absence of p62 leads to higher sensitivity against glycation‐derived burden. (a‐c) WT MEFs (p62+/+) and MEFs lacking p62 (p62−/−) were incubated with the indicated concentration of MGO for 2 hours, and lysates were separated into 1% Triton X‐100 soluble and insoluble fractions. (a) Soluble and insoluble fractions were immunoblotted for AGEs. Quantification of (b) soluble and (c) insoluble MG‐H1 in p62−/− MEF relative to values in 1 mM MGO treated p62+/+ cells. Values are mean ±SEM (n = 7). We observed an interaction (p < 0.01) between the MGO concentration and the genotype using two‐way ANOVA analysis only for the insoluble fraction (c). The differences between p62+/+ and p62−/− after the Sidak's multiple comparison test were significant for the 2 mM doses of MGO in the insoluble and 1 mM in the soluble fraction (**p < 0.01 and ***p < 0.001). (d‐f) Same cells were incubated with 1 mM of MGO for indicated times. (d) Representative immunoblot and quantification of (e) soluble and (f) insoluble MG‐H1 relative to values in 2 h treated p62+/+ cells. Values are mean ±SEM (n = 8). We observed an interaction (p < 0.01) between the time of MGO treatment and the genotype using two‐way ANOVA analysis for the soluble and insoluble fraction. *p < 0.05, **p < 0.01 and ***p < 0.001. The differences between p62+/+ and p62−/− after the Sidak's multiple comparison test were significant for the 2, 4, and 6 h of MGO in the soluble fraction and for 4 and 6 h of MGO in the insoluble fraction
Figure 4
Figure 4
Glycative stress compromises p62 lysosomal targeting and Ser403 phosphorylation of p62. (a‐c) NRK cells were maintained for 2 h in complete medium (+S) or serum‐free medium (‐S) in the presence or absence of 2 mM MGO, 30 μM chloroquine (CQ) or both, fixed, and immunostained for endogenous p62. (a) Representative pictures are shown and quantifications of (b) average number of p62‐positive puncta per cell, (c) percentage of area occupied by p62‐positive puncta per total cellular area and (d) p62‐autophagic flux are shown. All values are mean ±SEM (n = 3, >30 cells per condition); * = p < 0.05; ** = p < 0.01; *** = p < 0.001. (e‐g) Similar parameters are shown from the analysis in HLECs incubated under the same conditions. Representative figures are showed in SI Appendix Figure S4. (h,i) U937 cells were incubated with 2 mM MGO for indicated times and phosphorylation of p62 at serine 403 was evaluated. (h) Representative immunoblot and (i) quantification of Ser403 phosphorylation of p62 relative to values in untreated cells. Values are mean ±SEM (n = 3). *p < 0.05 and **p < 0.01. For panels b, c, e, and f, one‐way ANOVA plus Sidak's multiple comparisons test were performed. For panel D and g, Student's t tests were performed. For panel i, one‐way ANOVA plus Dunnett's test was used to compare to control
Figure 5
Figure 5
Accumulation of high molecular weight p62 upon glycative stress is reversible. (a,b) WT MEFs (p62+/+) and MEFs lacking p62 (p62−/−) were incubated with the indicated concentration of MGO for 2 hours, and whole cellular extracts were immunoblotted against p62. (a) Representative immunoblot and (b) quantification of p62 monomer and high molecular weight p62 (HMW‐p62) values relative to untreated cells are shown. Values are mean ±SEM (n = 5). We observed an interaction (p < 0.0001) between the MGO concentration and the HMW‐p62 using two‐way ANOVA analysis. The differences between HMW‐p62 and monomeric p62 after the Sidak's multiple comparison test were significant for the 4 mM doses of MGO (***p < 0.001). (c,d) ARPE‐19 cells were treated with 2 mM MGO for 2 hours followed by incubation in complete medium (no MGO) for either 2 or 4 hours. Cellular lysates were subjected to extraction with 1% Triton X‐100 and soluble and insoluble fractions were immunoblotted for the indicated proteins. (c) Representative immunoblot and (d) quantification of HMW‐p62 values relative to untreated cells are shown. Values are mean ±SEM (n = 5). Differences between t0 and insoluble p62 were significant for the 4 mM doses of MGO using one‐way ANOVA followed by Dunnett's multiple comparison test (**p < 0.01). (e,f) Retinal tissue sections from low‐glycemic (LG), high glycemic (HG), and crossover diet (HGxoLG) were analyzed immunohistochemically for p62. (e) Representative images of p62 immunostaining and mean intensity fluorescence in (f) the retinal pigment epithelial layer and (g) neuroretina relative to values in LG‐diet are shown. Values are mean ±SEM (n = 4). Abbreviations: CH, choroid; RPE, retinal pigment epithelium; INL, inner nuclear layer; IPL, inner plexiform layer; ONL, outer nuclear layer; GCL, ganglion cell layer. p < 0.05 in one‐way ANOVA followed by Dunnett's multiple comparison test
Figure 6
Figure 6
Enhanced autophagy protects against glycative damage by reducing AGEs accumulation. (a, b) ARPE‐19 cells were treated with the indicated concentrations of MGO in the absence or presence of 1 µM rapamycin. (a) Cell viability was measured by Cell‐Titer assay. Values are mean ±SEM (n = 7). We observed significant effects of both the MGO concentration and the rapamycin using two‐way ANOVA analysis (p < .00001). The differences after rapamycin treatment were significant for all the doses of MGO after the Sidak's multiple comparison test (*p < 0.05, **p < 0.01). (b) Immunoblot against MG‐H1 is shown. (c, d) HLECs cells were treated under the same conditions. (c) Cell viability, and (d) immunoblot against MG‐H1 are shown. Values are mean ±SEM (n = 7). We observed interaction between the MGO concentration and rapamycin using two‐way ANOVA analysis (p = 0.0035). The protective effect of rapamycin treatment on cell survival was significant for the 2 and 4 mM doses of MGO after the Sidak's multiple comparison test (**p < 0.01 and ***p < 0.001). (e) WT MEFs (p62+/+) and MEFs lacking p62 (p62−/−) were incubated with the indicated concentrations of MGO in the absence or presence of 1 µM rapamycin and cell viability was analyzed. Values are mean ±SEM (n = 7). We analyzed the effects of p62 genotype, MGO dose, and rapamycin using 3‐way ANOVA matching by MGO dose and rapamycin. The three factors have significant effect: p62 genotype (*p < 0.05), MGO dose (***p < 0.001), and rapamycin (**p < 0.01). The only significant interaction was between rapamycin and p62 genotype (p = 0.0077), because it has protective effect only in p62+/+ MEFs. (F) Immunoblot against AGEs in WT and p62‐overexpressing C. elegans. Representative immunoblot (left) and quantification of total levels of MG‐H1 relative to values in WT (right) Values are mean ±SEM (n = 3). *p < 0.05, **p < 0.01 and ***p < 0.001

Similar articles

Cited by

References

    1. Aki, T. , Unuma, K. , Noritake, K. , Hirayama, N. , Funakoshi, T. , & Uemura, K. (2019). Formation of high molecular weight p62 by CORM‐3. PLoS One, 14(1), e0210474 10.1371/journal.pone.0210474 - DOI - PMC - PubMed
    1. Aparicio, R. , Hansen, M. , Walker, D. W. , & Kumsta, C. (2020). The selective autophagy receptor SQSTM1/p62 improves lifespan and proteostasis in an evolutionarily conserved manner. Autophagy, 16(4), 772‐774. 10.1080/15548627.2020.1725404 - DOI - PMC - PubMed
    1. Bejarano, E. , Girao, H. , Yuste, A. , Patel, B. , Marques, C. , Spray, D. C. , Pereira, P. , & Cuervo, A. M. (2012). Autophagy modulates dynamics of connexins at the plasma membrane in a ubiquitin‐dependent manner. Molecular Biology of the Cell, 23(11), 2156‐2169. 10.1091/mbc.E11-10-0844 - DOI - PMC - PubMed
    1. Bejarano, E. , Murray, J. W. , Wang, X. , Pampliega, O. , Yin, D. , Patel, B. , Yuste, A. , Wolkoff, A. W. , & Cuervo, A. M. (2018). Defective recruitment of motor proteins to autophagic compartments contributes to autophagic failure in aging. Aging Cell, 17(4), e12777 10.1111/acel.12777 - DOI - PMC - PubMed
    1. Bejarano, E. , & Taylor, A. (2019). Too sweet: Problems of protein glycation in the eye. Experimental Eye Research, 178, 255‐262. 10.1016/j.exer.2018.08.017 - DOI - PMC - PubMed

Publication types

Substances