

Efficient Machine-Learning-Aided Screening of Hydrogen Adsorption on Bimetallic Nanoclusters
- PMID: 33147012
- PMCID: PMC7739401
- DOI: 10.1021/acscombsci.0c00102
Efficient Machine-Learning-Aided Screening of Hydrogen Adsorption on Bimetallic Nanoclusters
Abstract
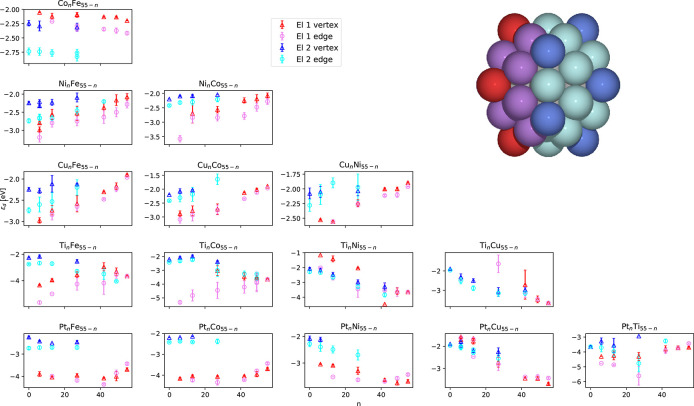
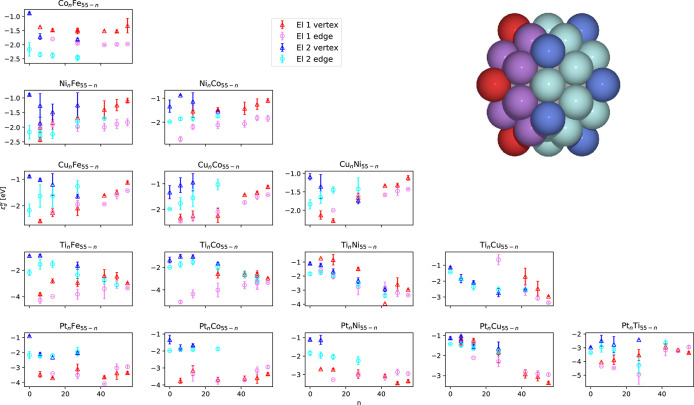
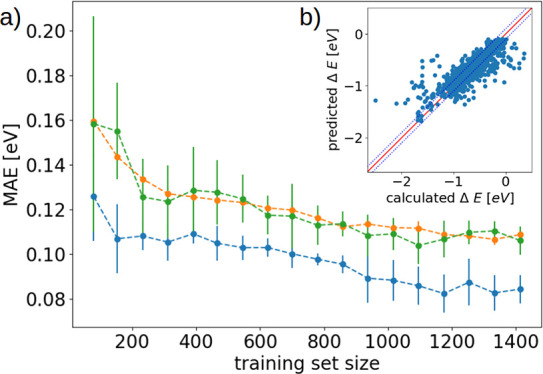
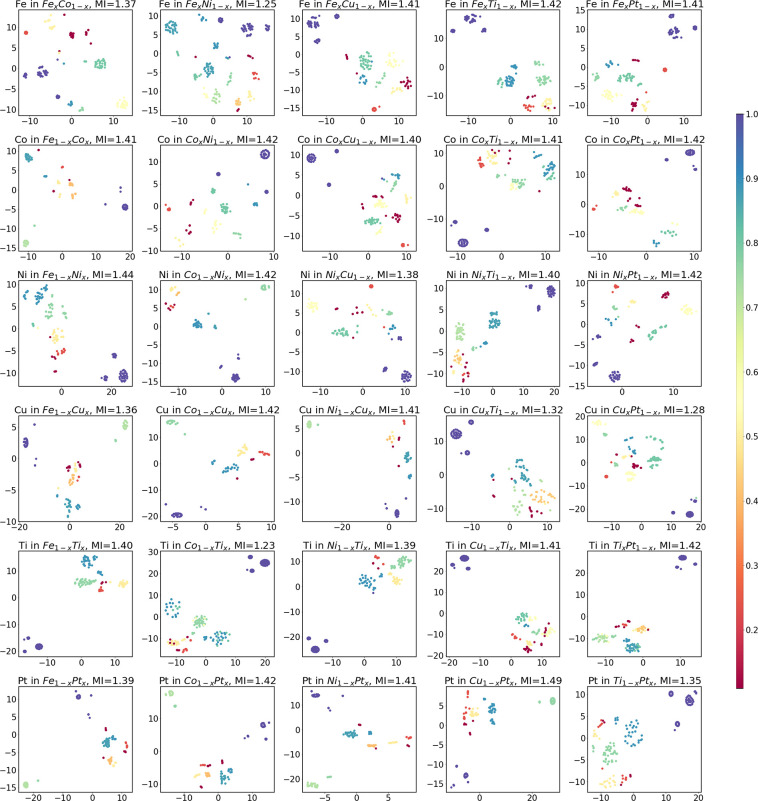
Nanoclusters add an additional dimension in which to look for promising catalyst candidates, since catalytic activity of materials often changes at the nanoscale. However, the large search space of relevant atomic sites exacerbates the challenge for computational screening methods and requires the development of new techniques for efficient exploration. We present an automated workflow that systematically manages simulations from the generation of nanoclusters through the submission of production jobs, to the prediction of adsorption energies. The presented workflow was designed to screen nanoclusters of arbitrary shapes and size, but in this work the search was restricted to bimetallic icosahedral clusters and the adsorption was exemplified on the hydrogen evolution reaction. We demonstrate the efficient exploration of nanocluster configurations and screening of adsorption energies with the aid of machine learning. The results show that the maximum of the d-band Hilbert-transform ϵu is correlated strongly with adsorption energies and could be a useful screening property accessible at the nanocluster level.
Keywords: adsorption; catalysis; computational screening; hydrogen evolution reaction; machine learning; nanoclusters; workflow automation.
Conflict of interest statement
The authors declare no competing financial interest.
Figures


Similar articles
-
Machine Learning Prediction of H Adsorption Energies on Ag Alloys.J Chem Inf Model. 2019 Apr 22;59(4):1357-1365. doi: 10.1021/acs.jcim.8b00657. Epub 2019 Apr 2. J Chem Inf Model. 2019. PMID: 30897905
-
Catalytic characteristics of AgCu bimetallic nanoparticles in the oxygen reduction reaction.ChemSusChem. 2013 Jun;6(6):1044-9. doi: 10.1002/cssc.201201001. Epub 2013 May 3. ChemSusChem. 2013. PMID: 23650210
-
Substituent effects on cobalt diglyoxime catalysts for hydrogen evolution.J Am Chem Soc. 2011 Nov 30;133(47):19036-9. doi: 10.1021/ja208091e. Epub 2011 Nov 3. J Am Chem Soc. 2011. PMID: 22032414
-
Adsorption of cobalt species on the interface, which is developed between aqueous solution and metal oxides used for the preparation of supported catalysts: a critical review.Adv Colloid Interface Sci. 2004 Aug 31;110(3):97-120. doi: 10.1016/j.cis.2004.04.001. Adv Colloid Interface Sci. 2004. PMID: 15328060 Review.
-
Platinum-based oxygen reduction electrocatalysts.Acc Chem Res. 2013 Aug 20;46(8):1848-57. doi: 10.1021/ar300359w. Epub 2013 Jun 28. Acc Chem Res. 2013. PMID: 23808919 Review.
Cited by
-
Machine Learning-Assisted High-Throughput Screening for Electrocatalytic Hydrogen Evolution Reaction.Molecules. 2025 Feb 7;30(4):759. doi: 10.3390/molecules30040759. Molecules. 2025. PMID: 40005070 Free PMC article. Review.
-
Guided electrocatalyst design through in-situ techniques and data mining approaches.Nano Converg. 2025 Apr 18;12(1):19. doi: 10.1186/s40580-025-00484-3. Nano Converg. 2025. PMID: 40249473 Free PMC article. Review.
-
Predicting hydration layers on surfaces using deep learning.Nanoscale Adv. 2021 May 6;3(12):3447-3453. doi: 10.1039/d1na00253h. eCollection 2021 Jun 15. Nanoscale Adv. 2021. PMID: 36133729 Free PMC article.
-
Computational Approaches to Alkaline Anion-Exchange Membranes for Fuel Cell Applications.Membranes (Basel). 2022 Oct 27;12(11):1051. doi: 10.3390/membranes12111051. Membranes (Basel). 2022. PMID: 36363606 Free PMC article. Review.
-
Machine Learning-Assisted Low-Dimensional Electrocatalysts Design for Hydrogen Evolution Reaction.Nanomicro Lett. 2023 Oct 13;15(1):227. doi: 10.1007/s40820-023-01192-5. Nanomicro Lett. 2023. PMID: 37831203 Free PMC article. Review.
References
-
- Gahleitner G. Hydrogen from renewable electricity: An international review of power-to-gas pilot plants for stationary applications. Int. J. Hydrogen Energy 2013, 38, 2039–2061. 10.1016/j.ijhydene.2012.12.010. - DOI
-
- Parra D.; Valverde L.; Pino F. J.; Patel M. K. A review on the role, cost and value of hydrogen energy systems for deep decarbonisation. Renewable Sustainable Energy Rev. 2019, 101, 279–294. 10.1016/j.rser.2018.11.010. - DOI
-
- Zhang Y.-h.; et al. Development and Application of Hydrogen Storage. J. Iron Steel Res. Int. 2015, 22, 757–770. 10.1016/S1006-706X(15)30069-8. - DOI
-
- Yu X.; Tang Z.; Sun D.; Ouyang L.; Zhu M. Recent advances and remaining challenges of nanostructured materials for hydrogen storage applications. Prog. Mater. Sci. 2017, 88, 1–48. 10.1016/j.pmatsci.2017.03.001. - DOI
-
- Bertuccioli L.et al.Development of Water Electrolysis in the European Union, Tech. Rep., Fuel Cells and Hydrogen Joint Undertaking, 2014.
Publication types
MeSH terms
Substances
LinkOut - more resources
Full Text Sources
