. 2021 Jan 1;32(1):74-89.
doi: 10.1091/mbc.E20-06-0379. Epub 2020 Nov 4.

R-loops at centromeric chromatin contribute to defects in kinetochore integrity and chromosomal instability in budding yeast

Affiliations

R-loops at centromeric chromatin contribute to defects in kinetochore integrity and chromosomal instability in budding yeast

Prashant K Mishra et al. Mol Biol Cell. .

Abstract

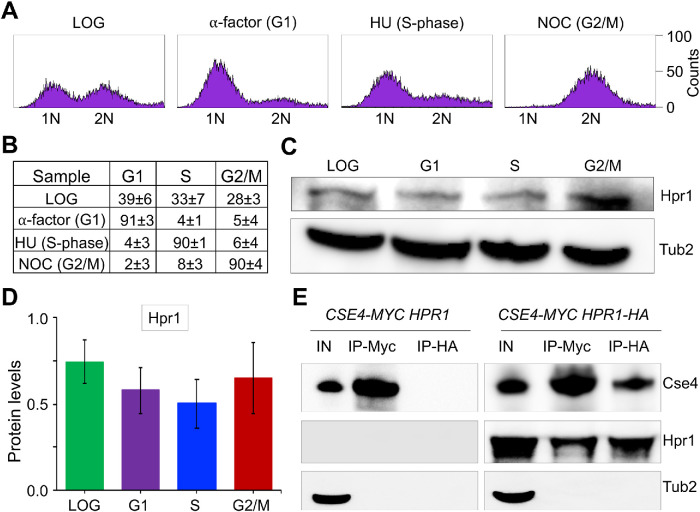
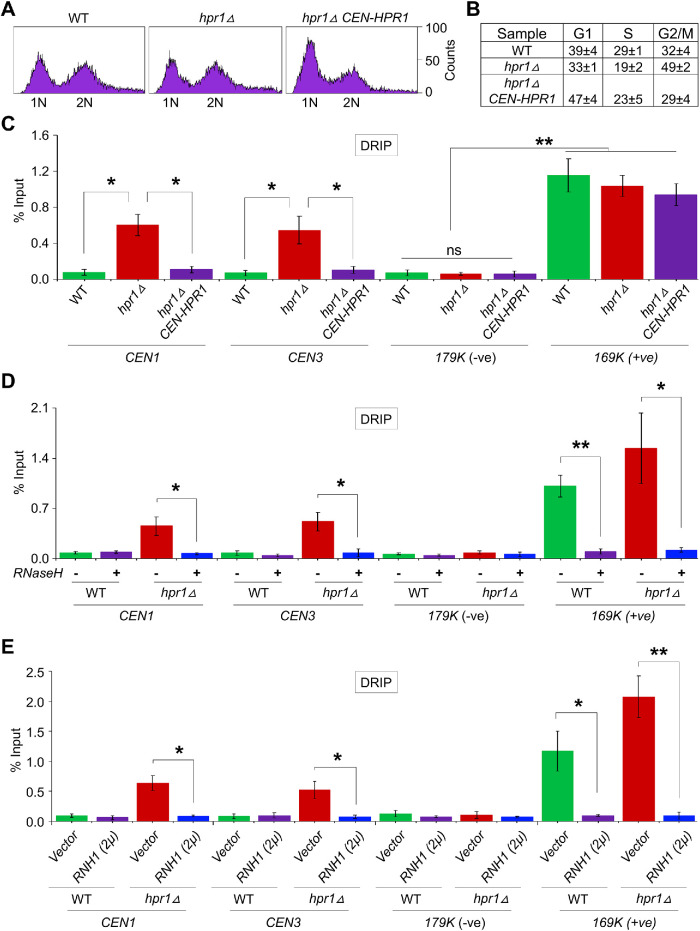
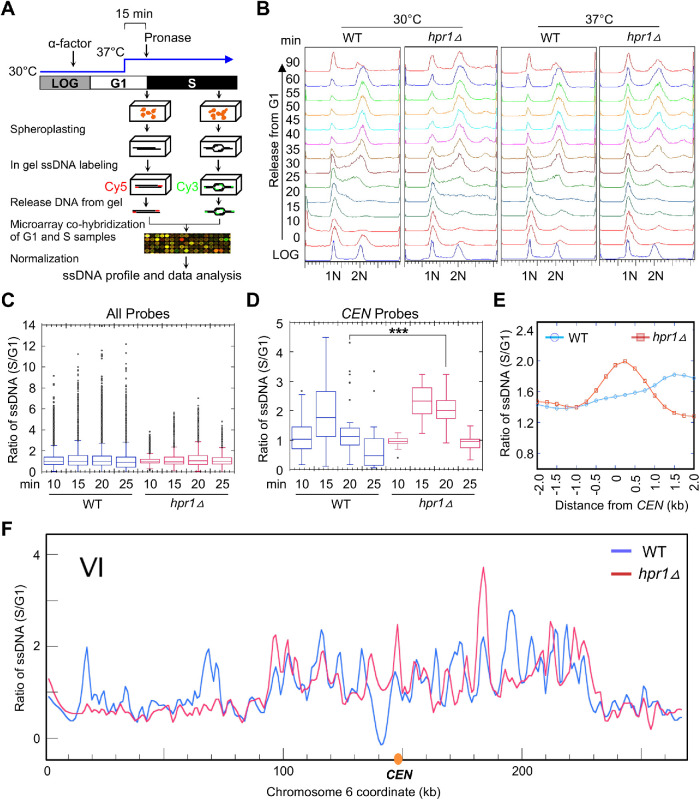
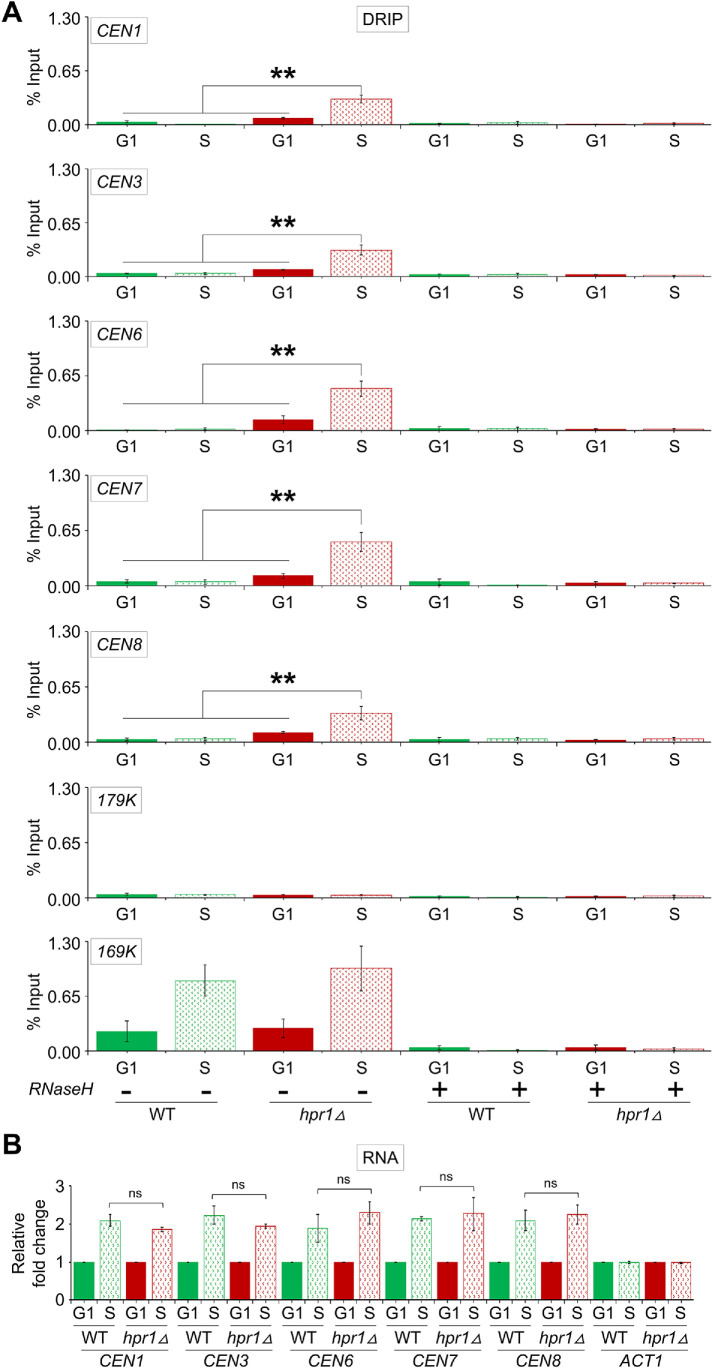
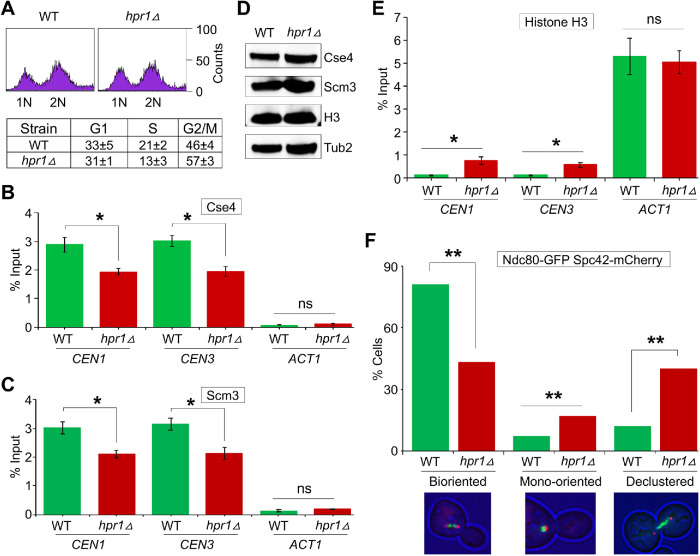
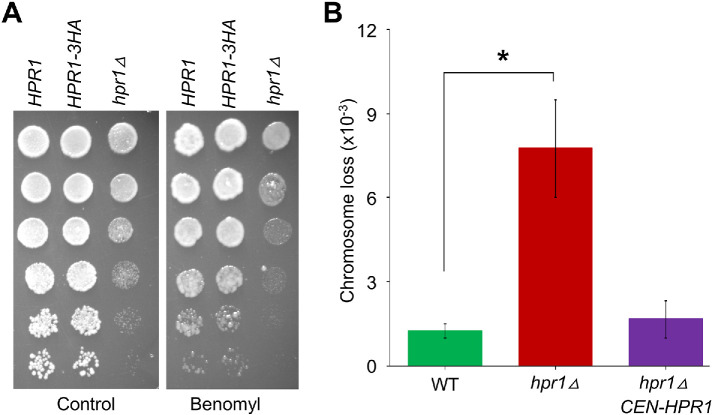
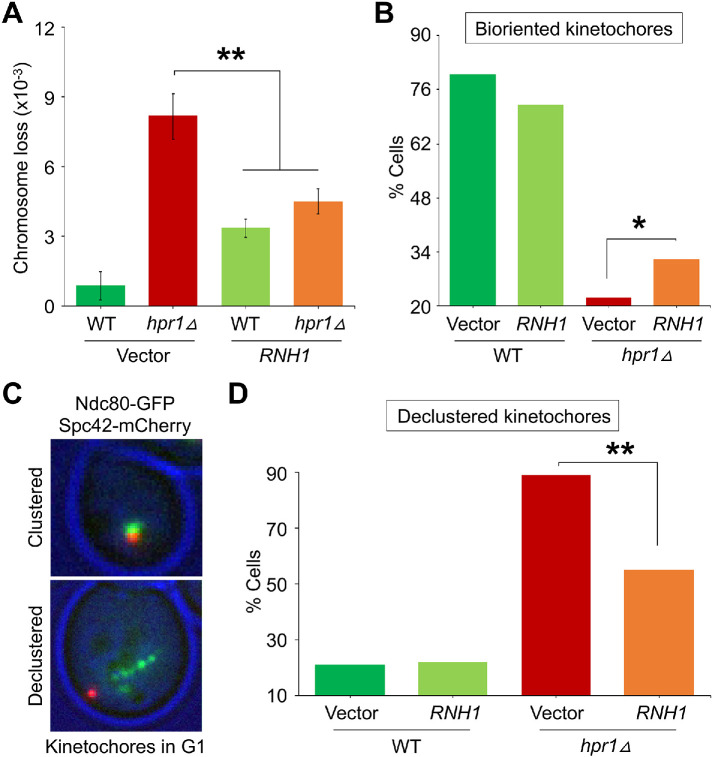
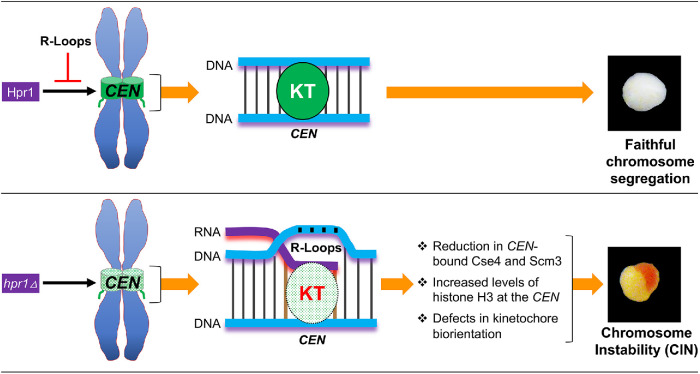
R-loops, the byproduct of DNA-RNA hybridization and the displaced single-stranded DNA (ssDNA), have been identified in bacteria, yeasts, and other eukaryotic organisms. The persistent presence of R-loops contributes to defects in DNA replication and repair, gene expression, and genomic integrity. R-loops have not been detected at centromeric (CEN) chromatin in wild-type budding yeast. Here we used an hpr1∆ strain that accumulates R-loops to investigate the consequences of R-loops at CEN chromatin and chromosome segregation. We show that Hpr1 interacts with the CEN-histone H3 variant, Cse4, and prevents the accumulation of R-loops at CEN chromatin for chromosomal stability. DNA-RNA immunoprecipitation (DRIP) analysis showed an accumulation of R-loops at CEN chromatin that was reduced by overexpression of RNH1 in hpr1∆ strains. Increased levels of ssDNA, reduced levels of Cse4 and its assembly factor Scm3, and mislocalization of histone H3 at CEN chromatin were observed in hpr1∆ strains. We determined that accumulation of R-loops at CEN chromatin contributes to defects in kinetochore biorientation and chromosomal instability (CIN) and these phenotypes are suppressed by RNH1 overexpression in hpr1∆ strains. In summary, our studies provide mechanistic insights into how accumulation of R-loops at CEN contributes to defects in kinetochore integrity and CIN.


Figures

FIGURE 1:
FIGURE 1:
Hpr1 is expressed throughout the cell cycle and interacts with Cse4 in vivo. (A) FACS profile of WT (YMB11085, CSE4-12MYC, HPR1-3HA) cells grown in YPD to logarithmic (LOG) phase at 30°C and synchronized in G1 with α-factor, S-phase with HU and G2/M with nocodazole. (B) Cell cycle categorization of samples from A representing the percentage of cells in G1, S, and G2/M. (C) Western blots showing expression of Hpr1 and Tub2 (loading control). (D) Hpr1 expressed throughout the cell cycle. Protein levels of Hpr1 in LOG-, G1-, S-, and G2/M-phases of the cell cycle. Values were normalized to Tub2. Average from three biological replicates ± SE. (E) Hpr1 interacts in vivo with Cse4. WT strains YMB11085 (CSE4-12MYC, HPR1-3HA) and JG595 (CSE4-12MYC, HPR1) were grown in YPD at 30°C to the logarithmic phase. Cell extracts were prepared, and IPs were performed using anti-HA (A2095; Sigma-Aldrich) and anti-Myc (A7470; Sigma Aldrich) agarose beads. Eluted proteins were analyzed by Western blotting with anti-Myc (Cse4; a-14, sc-789; Santa Cruz Biotechnology), anti-HA (Hpr1; H6908; Sigma Aldrich), and anti-Tub2 (loading control) antibodies. IN = input, and IP = immunoprecipitated samples.
FIGURE 2:
FIGURE 2:
Hpr1 prevents the accumulation of R-loops at the CEN chromatin. (A) FACS profile of logarithmically growing cultures of WT (YMB11246), hpr1Δ (YMB11247), and hpr1Δ CEN-HPR1 (YMB11248) cells used for DRIP experiments. (B) Cell cycle categorization of strains from A representing the percentage of cells in G1, S, and G2/M. (C) Accumulation of R-loops at CEN chromatin in hpr1Δ and its suppression by CEN-HPR1. DRIP analysis of yeast strains from A using the S9.6 (anti–DNA-RNA hybrid) antibody. Levels of R-loops (% input) at CENs (CEN1 and CEN3), a negative control (179K), and a positive control (169K) were determined by DRIP-qPCR. Average from three biological replicates ± SE. **p value < 0.01, *p value < 0.05, ns = statistically not significant, Student’s t test. (D) Accumulation of R-loops at CEN chromatin in hpr1Δ cells with (+) or without (–) treatment with RNase H. DRIP analysis of WT (JG595) and hpr1Δ (YMB11097) using the S9.6 (anti–DNA-RNA hybrid) antibody. Levels of R-loops and statistical significance were determined as described in C. (E) Accumulation of R-loops at CEN chromatin in hpr1Δ cells with or without RNH1 overexpression. DRIP analysis using the S9.6 (anti–DNA-RNA hybrid) antibody was performed for a WT strain with vector (YMB11210) or 2μ-RNH1 (YMB11211) and an hpr1Δ strain with vector (YMB11212) or 2μ-RNH1 (YMB11213). Levels of R-loops and statistical significance as described in C.
FIGURE 3:
FIGURE 3:
Genome-wide ssDNA mapping shows accumulation of ssDNA at CENs in the hpr1Δ strain at the restrictive temperature (37°C). (A) Schematic presentation of genomic ssDNA mapping. Details of cell culture conditions, ssDNA labeling, and quantification are described in Materials and Methods. Briefly, cells synchronized in G1 by α-factor at 30°C were acclimatized to 37°C for 15 min before the release into S-phase by Pronase treatment. S-phase samples were collected every 5 min starting at 10 min postrelease, as shown in B. Select S-phase samples (10, 15, 20, and 25 min post–G1 release) were subject to ssDNA labeling, and each was cohybridized with a ssDNA labeled G1 control sample onto the microarray. (B) FACS profile of WT (BY4741) and hpr1Δ (BY4741 hpr1Δ) strains. Cells were collected as described in A. The positions of G1 and G2 cells are indicated by “1N” and “2N”, respectively. (C, D) Box plots for quantification of ssDNA from cells sampled at the indicated time points post–release from G1- into S-phase for all probes on the microarray (C) and for probes overlapping only with the CEN (D). Statistical analysis was performed by analysis of variance followed by Tukey’s multiple comparison. ***p value < 0.001. (E) Meta-analysis of ssDNA in a 4 kb window centering on the CEN for cells sampled at 20 min post–release from G1- into S-phase. (F) Example of a chromosomal plot of ssDNA on chromosome VI from cells sampled at 20 min at 37°C. For all chromosome plots, see Supplemental Figure S2.
FIGURE 4:
FIGURE 4:
Accumulation of R-loops contributes to the enrichment of ssDNA at the CEN chromatin. (A) Accumulation of R-loops at CEN coincides with the enrichment of CEN-derived ssDNA in an hpr1Δ strain. DRIP-qPCR analysis of WT (BY4741) and hpr1Δ (BY4741 hpr1Δ) strains was performed using the S9.6 (anti–DNA-RNA hybrid) antibodies. Average from three biological replicates ± SE. **p value < 0.01, Student’s t test. (B) Expression of CEN lncRNA in S-phase is largely similar between WT and hpr1Δ strains. Total RNA was used in RT-qPCR to determine the expression level of CEN lncRNA (CEN1, CEN3, CEN6, CEN7, and CEN8) and ACT1 lncRNA (control). Average from three biological replicates ± SE. ns = statistically not significant, Student’s t test.
FIGURE 5:
FIGURE 5:
Accumulation of R-loops at CEN chromatin affects kinetochore integrity and biorientation. (A) FACS profile and cell cycle categorization of logarithmically growing cultures of WT (JG595) and hpr1Δ (YMB11097) strains. (B) CEN-associated Cse4 is reduced in an hpr1Δ strain. ChIP for Cse4 was performed using anti-Myc agarose beads (A7470; Sigma Aldrich). Cse4 enrichment at CEN1, CEN3, and a negative control (ACT1) was determined by qPCR and is presented as % input. Average from three biological replicates ± SE. *p value < 0.05, ns = statistically not significant, Student’s t test. (C) CEN-associated Scm3 is reduced in an hpr1Δ strain. ChIP for Scm3 was performed using anti-Flag agarose beads (A2220; Sigma Aldrich). Scm3 enrichment at CEN1, CEN3, and a negative control (ACT1) was determined by qPCR and is presented as % input. Average from three biological replicates ± SE. *p value < 0.05, ns = statistically not significant, Student’s t test. (D) Protein levels of Cse4 and Scm3 are not reduced in an hpr1Δ strain. Western blotting was done using the whole cell extracts from strains described in A. (E) Histone H3 associates with CEN chromatin in the hpr1Δ strain. ChIP for histone H3 was done using anti-H3 antibodies (Cat# ab176842; Abcam). Histone H3 enrichment at CEN1, CEN3, and ACT1 was determined by qPCR and is presented as % input. Average from three biological replicates ± SE. *p value < 0.05, ns = statistically not significant, Student’s t test. (F) Deletion of HPR1 causes defects in kinetochore biorientation. WT (KBY6380) and hpr1∆ (KBY6432) strains containing Ndc80-GFP and Spc42-mCherry were grown at room temperature (25°C). The cutoff for metaphase spindle length was 1.7 μm. Spc42-mCherry was used as a spindle pole marker. Representative images showing the position of Ndc80-GFP (green) and Spc42-mCherry (red) are shown. Percentage of cells showing bioriented, mono-oriented (large budded cell with unseparated SPBs), and declustered kinetochores are shown (n = 181 cells). Statistical significance was determined by χ2 test. **p value < 0.01.
FIGURE 6:
FIGURE 6:
Accumulation of R-loops at CEN chromatin contributes to CIN. (A) An hpr1Δ strain displays sensitivity to benomyl. Serial (fivefold) dilutions of HPR1 (JG595), HPR1-3HA (YMB11085), and hpr1Δ (YMB11097) strains were plated on YPD plates with or without benomyl (10 μg/ml) and grown for 3 d at 25°C. (B) Errors in chromosome segregation are increased in hpr1Δ strain. Frequency of CF loss in WT (YPH1018), hpr1Δ (YMB11087), and hpr1Δ CEN-HPR1 (YMB11251) strains were measured by a colony color assay as detailed in Materials and Methods. Average from three biological experiments ± SE. *p value < 0.05, Student’s t test.
FIGURE 7:
FIGURE 7:
Overexpression of RNH1 suppresses CIN, kinetochore biorientation, and kinetochore clustering defects in hpr1∆ strains. (A) RNH1 overexpression suppresses the frequency of chromosome segregation errors in the hpr1Δ strain. Frequencies of CF loss in WT with vector (YMB11206) or 2μ-RNH1 (YMB11207) and hpr1Δ with vector (YMB11208) or 2μ-RNH1 (YMB11209) strains were measured by a colony color assay as detailed in Materials and Methods. Average from three biological experiments ± SE. **p value < 0.01, Student’s t test. (B) RNH1 overexpression suppresses kinetochore biorientation defects in metaphase cells of hpr1∆ strains. WT with vector (YMB11494; n = 135 cells) or 2μ-RNH1 (YMB11495; n = 123 cells) and hpr1∆ with vector (YMB11496; n = 134 cells) or 2μ-RNH1 (YMB11497; n = 216 cells) strains containing Ndc80-GFP and Spc42-mCherry were grown at room temperature (25°C). The cutoff for metaphase spindle length was 1.7 μm. Spc42-mCherry was used as a spindle pole marker. Percentages of cells showing bioriented kinetochores are shown. Statistical significance was determined by χ2 test. *p value < 0.05. (C) Representative images of G1 cells depicting clustered and declustered kinetochores based on the position of Ndc80-GFP (green) and Spc42-mCherry (red). (D) RNH1 overexpression suppresses kinetochore clustering defects of hpr1∆ cells in G1. WT with vector (YMB11494; n = 104 cells) or 2μ-RNH1 (YMB11495; n = 103 cells) and hpr1∆ with vector (YMB11496; n = 100 cells) or 2μ-RNH1 (YMB11497; n = 292 cells) carrying Ndc80-GFP and Spc42-mCherry were grown at room temperature (25°C) to LOG phase, and G1 cells were selected based on the cell morphology (single-celled, no bud). Percentage of cells showing declustered kinetochores in G1 are shown. Statistical significance was determined by χ2 test. **p value < 0.01.
FIGURE 8:
FIGURE 8:
Schematic model proposing that accumulation of R-loops at CEN chromatin contributes to CIN. In a WT strain, the presence of Hpr1 prevents the accumulation of R-loops at CEN chromatin leading to faithful chromosome segregation and white colonies due to retention of the reporter CF. In an hpr1Δ strain, R-loops accumulate at the CEN chromatin and this contributes to reduced levels of Cse4 and Scm3, increased levels of histone H3 at CEN chromatin, defects in kinetochore biorientation, benomyl sensitivity, and CIN as depicted by half red/half white colonies due to loss of reporter CF.

Similar articles

Cited by

References

    1. Aguilera A, Klein HL (1990). HPR1, a novel yeast gene that prevents intrachromosomal excision recombination, shows carboxy-terminal homology to the Saccharomyces cerevisiae TOP1 gene. Mol Cell Biol 10, 1439–1451. - PMC - PubMed
    1. Allison DF, Wang GG (2019). R-loops: formation, function, and relevance to cell stress. Cell Stress 3, 38–46. - PMC - PubMed
    1. Andronov L, Ouararhni K, Stoll I, Klaholz BP, Hamiche A (2019). CENP-A nucleosome clusters form rosette-like structures around HJURP during G1. Nat Commun 10, 4436. - PMC - PubMed
    1. Au WC, Crisp MJ, DeLuca SZ, Rando OJ, Basrai MA (2008). Altered dosage and mislocalization of histone H3 and Cse4p lead to chromosome loss in Saccharomyces cerevisiae. Genetics 179, 263–275. - PMC - PubMed
    1. Bakhoum SF, Swanton C (2014). Chromosomal instability, aneuploidy, and cancer. Front Oncol 4, 161. - PMC - PubMed

Publication types