. 2020 Nov 4;16(11):e1008304.
doi: 10.1371/journal.pcbi.1008304. eCollection 2020 Nov.

PPM-Decay: A computational model of auditory prediction with memory decay

Affiliations

PPM-Decay: A computational model of auditory prediction with memory decay

Peter M C Harrison et al. PLoS Comput Biol. .

Erratum in

Abstract

Statistical learning and probabilistic prediction are fundamental processes in auditory cognition. A prominent computational model of these processes is Prediction by Partial Matching (PPM), a variable-order Markov model that learns by internalizing n-grams from training sequences. However, PPM has limitations as a cognitive model: in particular, it has a perfect memory that weights all historic observations equally, which is inconsistent with memory capacity constraints and recency effects observed in human cognition. We address these limitations with PPM-Decay, a new variant of PPM that introduces a customizable memory decay kernel. In three studies-one with artificially generated sequences, one with chord sequences from Western music, and one with new behavioral data from an auditory pattern detection experiment-we show how this decay kernel improves the model's predictive performance for sequences whose underlying statistics change over time, and enables the model to capture effects of memory constraints on auditory pattern detection. The resulting model is available in our new open-source R package, ppm (https://github.com/pmcharrison/ppm).


Conflict of interest statement

The authors have declared that no competing interests exist.

Figures

Fig 1
Fig 1. A simple decay kernel.
The kernel is defined by an initial weight of w0 = 1, an exponential decay with half life t0.5 = 1 s, and an asymptotic weight w = 0.2.
Fig 2
Fig 2. Illustrative plots for Experiment 1.
A) Example sequence-generation models as randomly generated in Experiment 1. The bar plots describe 0th-order symbol distributions, whereas the matrices describe 1st-order transition probabilities. B) Repeated-measures plot indicating how predictive accuracy for individual sequences (N = 500, hollow circles) increases after the introduction of an exponential-decay kernel. C) Absolute changes in predictive accuracy for individual sequences, as summarised by a kernel density estimator. The median accuracy change is marked with a solid vertical line.
Fig 3
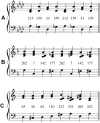
Fig 3. Sample chord sequences analyzed in Experiment 2.
A) represents the popular music corpus (‘Night Moves’, by Bob Seger), B) represents the jazz corpus (‘Thanks for the Memory’, by Leo Robin), and C) represents the Bach chorale harmonization corpus (‘Mit Fried und Freud ich fahr dahin’, by J. S. Bach). Each chord is labeled by its integer encoding within the chord alphabet for the respective corpus. Each chord sequence corresponds to the first eight chords of the first composition in the downsampled corpus. Each chord is defined by a combination of a bass pitch class (lower stave) and a collection of non-bass pitch classes (upper stave). For visualization purposes, bass pitch classes are assigned to the octave below middle C, and non-bass pitch classes to the octave above middle C.
Fig 4
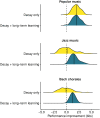
Fig 4. Predictive performances for different decay kernels in Experiment 2.
Each composition contributed one cross-entropy value for each decay kernel; these cross-entropy values are expressed relative to the cross-entropy values of the original PPM model, and then summarised using kernel density estimators. Median performance improvements are marked with solid vertical lines.
Fig 5
Fig 5. Example analysis of a single trial in Experiment 3.
The three panels plot each tone’s frequency, change-point statistic, and information content respectively. ‘Nominal transition’ denotes the point at which the pattern changes from random tones to a repeating pattern of length 10. This repetition starts to become discernible after 10 tones (‘Effective transition’), at which point the sequence becomes fully deterministic. Correspondingly, information content (or ‘surprise’) drops, and triggers change-point detection at ‘Detection of transition’.
Fig 6
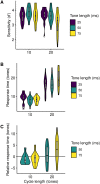
Fig 6. Behavioral results for Experiment 3.
A) Participant d-prime scores by condition, as summarized by violin plots and Tukey box plots. B) Participant mean response times by condition, as summarized by violin plots and Tukey box plots. C) As B, except benchmarking response times against the 25 ms conditions.
Fig 7
Fig 7. Decay kernels employed in Experiment 3.
The temporal duration of the buffer corresponds to the buffer’s informational capacity (15 tones) multiplied by the tone duration.
Fig 8
Fig 8. Modeling participant data in Experiment 3.
Participant data (mean response times) are plotted as white circles, whereas different model configurations (mean simulated response times) are plotted as solid bars. Error bars denote 95% confidence intervals computed using the central limit theorem. A) Progressively adding exponential weight decay and retrieval noise to the original PPM model. B) Progressively adding longer buffers to the PPM-Decay model.
Fig 9
Fig 9. Schematic figure of accumulating observations within a memory buffer.
Weights for the n-gram “AB” are displayed as a function of time, assuming an itemwise buffer capacity (nb) of 5, a buffer weight (w0) of 1.5, an initial post-buffer weight (w1) of 1, a half life (t0.5) of 1 second, and an asymptotic post-buffer weight (w) of 0.
Fig 10
Fig 10. Illustrative weight decay profile.
This figure plots the weight of an n-gram of length one as a function of relative observer position, assuming that new symbols continue to be presented every 0.05 seconds. Model parameters are set to tb = 2, nb = 15, w0 = 1.0, t0.5 = 3.5, w1 = 0.6, and w = 0, as optimized in Experiment 3.
Fig 11
Fig 11. Illustration of the interpolated smoothing mechanism.
This smoothing mechanism blends together maximum-likelihood n-gram models of different orders. Here the Markov order bound is two, the predictive context is “abracadabra”, and the task is to predict the next symbol. Columns are identified by Markov order; rows are organized into weight distributions, maximum-likelihood distributions, and interpolated distributions. Maximum-likelihood distributions are created by normalizing the corresponding weight distributions. Interpolated distributions are created by recursively combining the current maximum-likelihood distribution with the next-lowest-order interpolated distribution. The labelled arrows give the weight of each distribution, as computed using escape method “A”. The “Order = −1” column identifies the termination of the interpolated smoothing, and does not literally mean a Markov order of −1.

Similar articles

Cited by

References

    1. Winkler I, Denham SL, Nelken I. Modeling the auditory scene: predictive regularity representations and perceptual objects. Trends in Cognitive Sciences. 2009;13(12):532–40. 10.1016/j.tics.2009.09.003 - DOI - PubMed
    1. Wacongne C, Labyt E, Wassenhove V van, Bekinschtein T, Naccache L, Dehaene S. Evidence for a hierarchy of predictions and prediction errors in human cortex. Proceedings of the National Academy of Sciences. 2011;108(51):20754–9. 10.1073/pnas.1117807108 - DOI - PMC - PubMed
    1. Barascud N, Pearce MT, Griffiths TD, Friston KJ, Chait M. Brain responses in humans reveal ideal observer-like sensitivity to complex acoustic patterns. Proceedings of the National Academy of Sciences of the United States of America. 2016;113(5):E616–25. 10.1073/pnas.1508523113 - DOI - PMC - PubMed
    1. Garrido MI, Sahani M, Dolan RJ. Outlier responses reflect sensitivity to statistical structure in the human brain. PLoS Computational Biology. 2013;9(3). 10.1371/journal.pcbi.1002999 - DOI - PMC - PubMed
    1. Agres K, Abdallah S, Pearce MT. Information-theoretic properties of auditory sequences dynamically influence expectation and memory. Cognitive Science. 2018;42:43–76. 10.1111/cogs.12477 - DOI - PubMed

Publication types