. 2020 Nov 4;16(11):e1009084.
doi: 10.1371/journal.pgen.1009084. eCollection 2020 Nov.

Loss of hepatocyte cell division leads to liver inflammation and fibrosis

Affiliations

Loss of hepatocyte cell division leads to liver inflammation and fibrosis

Matthew R Dewhurst et al. PLoS Genet. .

Abstract

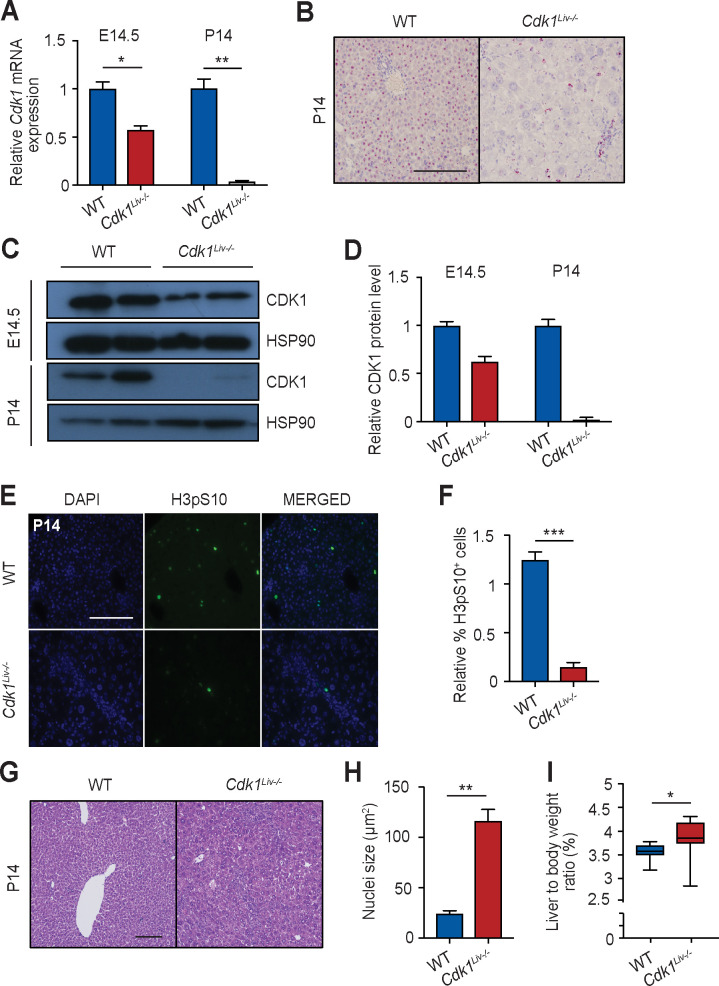
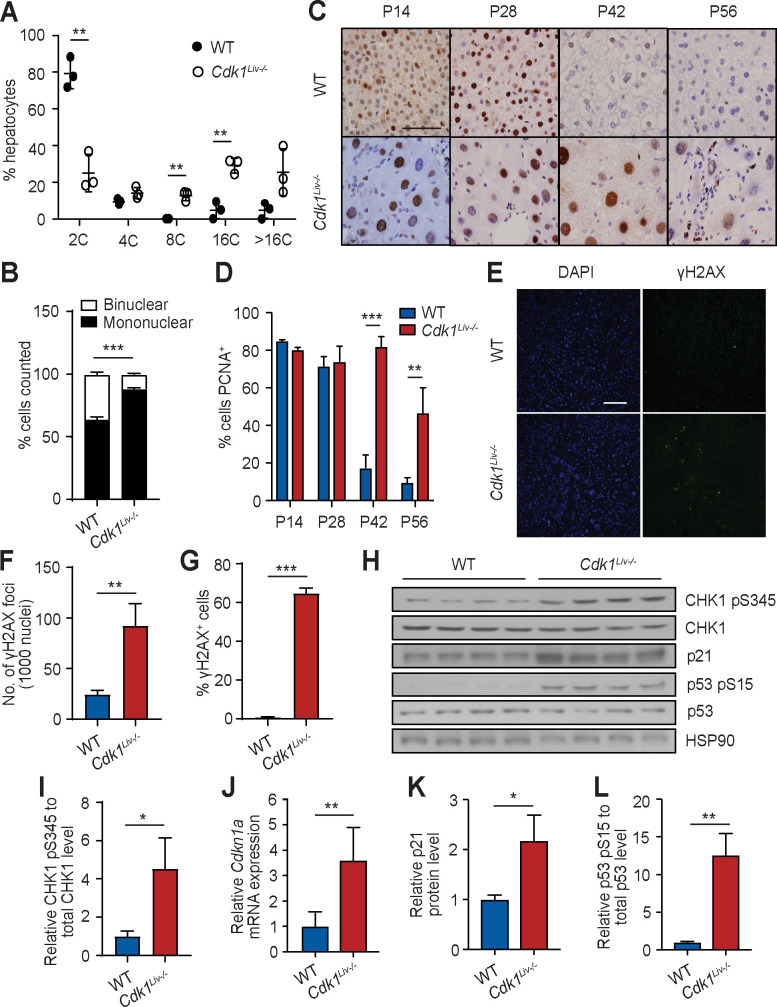
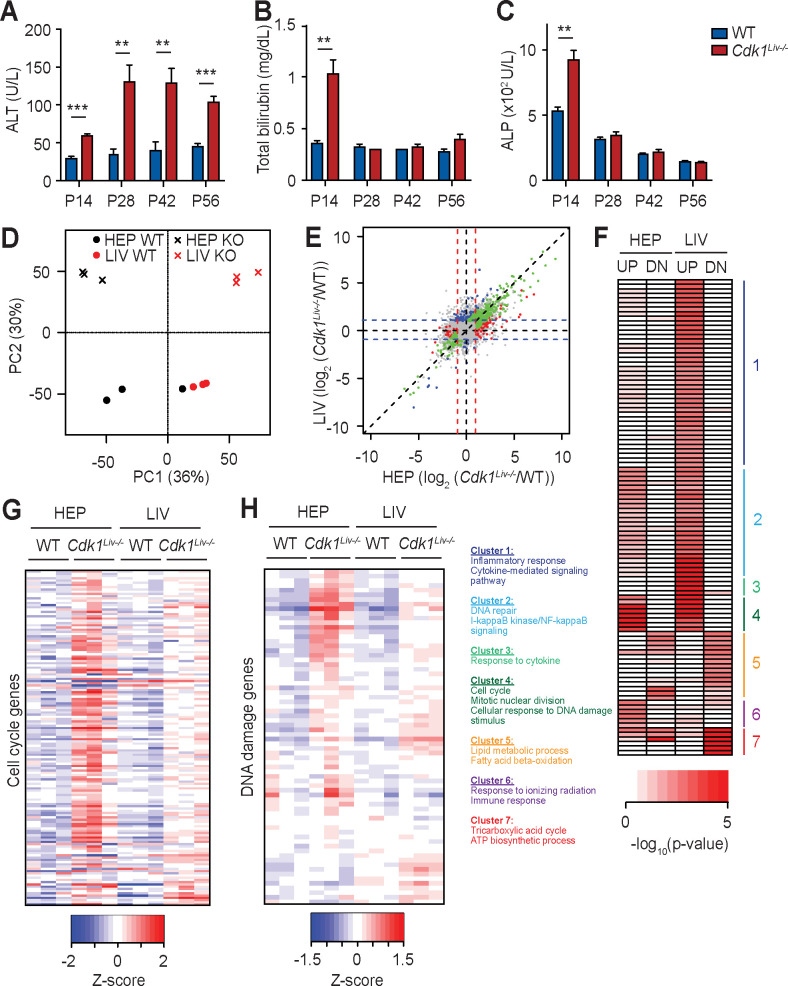
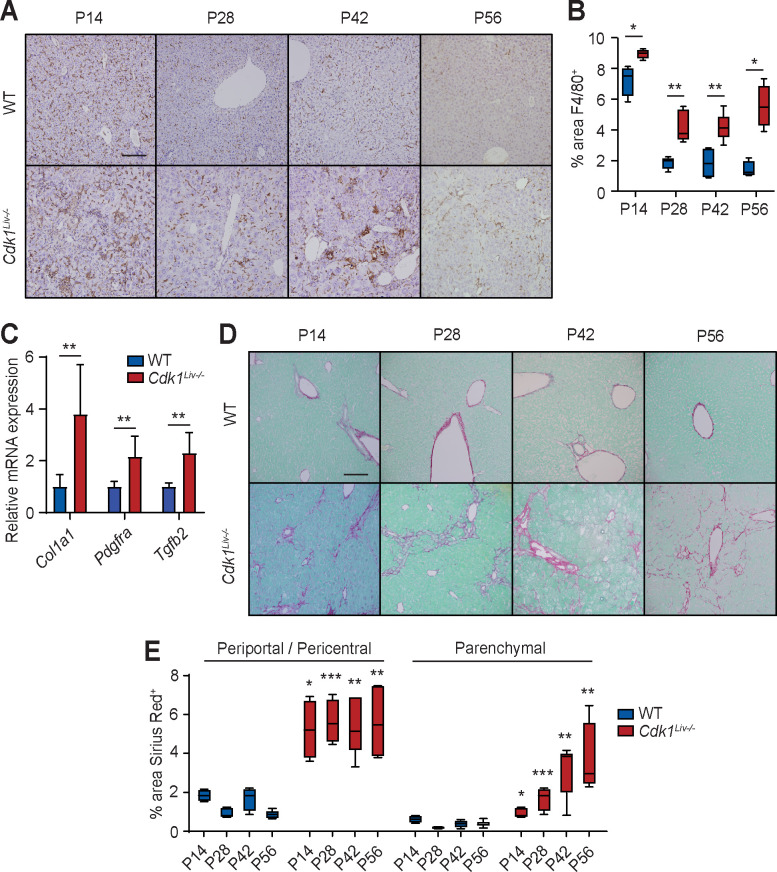
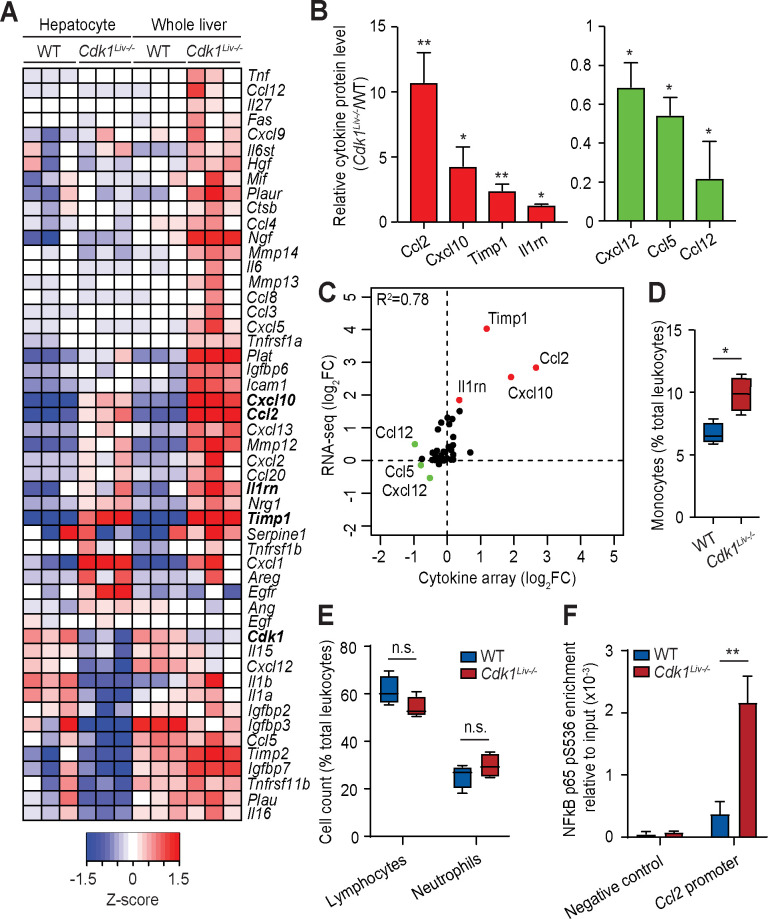
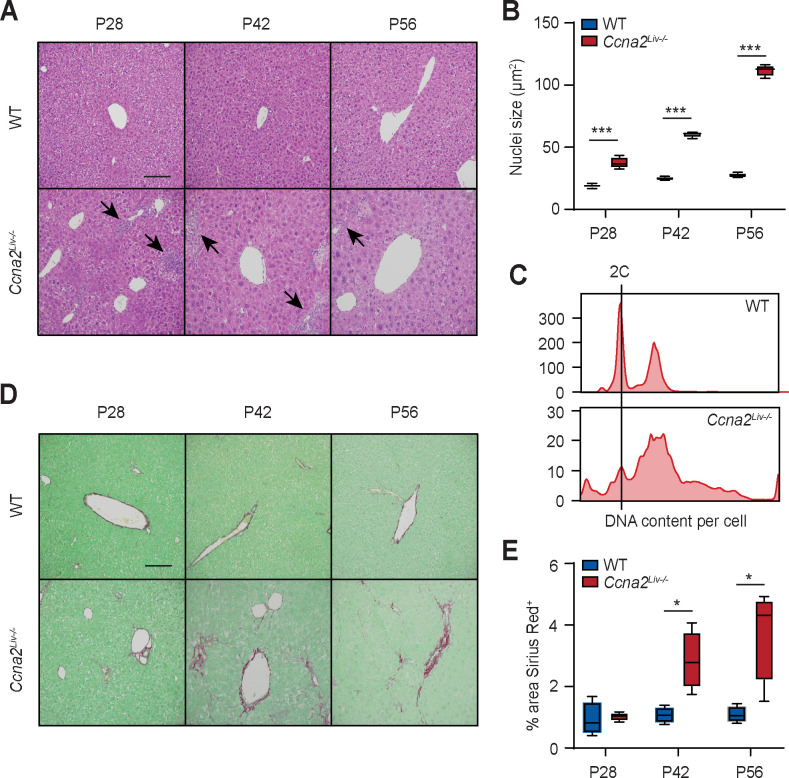
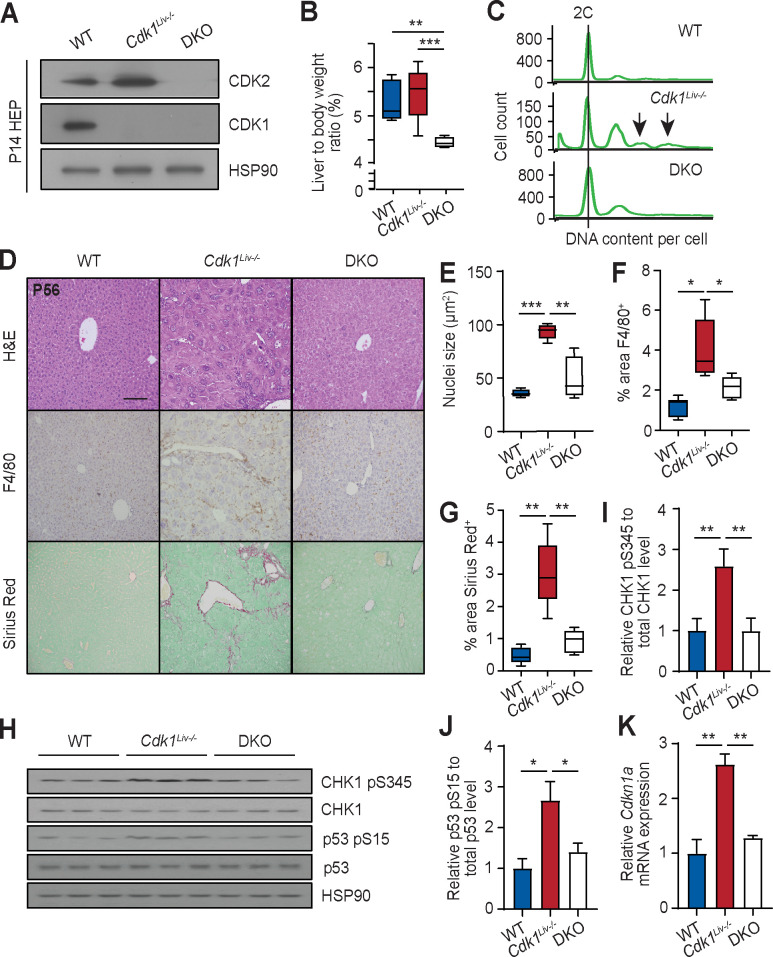
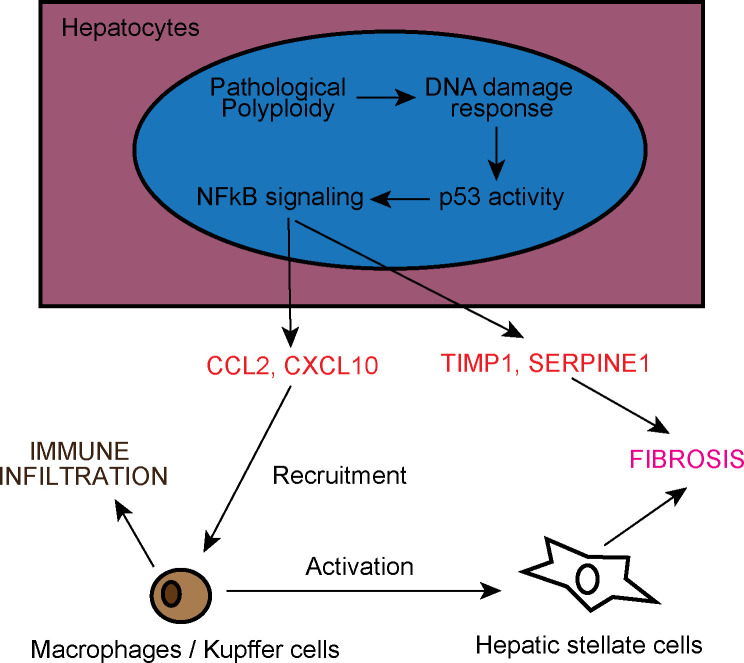
The liver possesses a remarkable regenerative capacity based partly on the ability of hepatocytes to re-enter the cell cycle and divide to replace damaged cells. This capability is substantially reduced upon chronic damage, but it is not clear if this is a cause or consequence of liver disease. Here, we investigate whether blocking hepatocyte division using two different mouse models affects physiology as well as clinical liver manifestations like fibrosis and inflammation. We find that in P14 Cdk1Liv-/- mice, where the division of hepatocytes is abolished, polyploidy, DNA damage, and increased p53 signaling are prevalent. Cdk1Liv-/- mice display classical markers of liver damage two weeks after birth, including elevated ALT, ALP, and bilirubin levels, despite the lack of exogenous liver injury. Inflammation was further studied using cytokine arrays, unveiling elevated levels of CCL2, TIMP1, CXCL10, and IL1-Rn in Cdk1Liv-/- liver, which resulted in increased numbers of monocytes. Ablation of CDK2-dependent DNA re-replication and polyploidy in Cdk1Liv-/- mice reversed most of these phenotypes. Overall, our data indicate that blocking hepatocyte division induces biological processes driving the onset of the disease phenotype. It suggests that the decrease in hepatocyte division observed in liver disease may not only be a consequence of fibrosis and inflammation, but also a pathological cue.


Conflict of interest statement

The authors declare that they have no conflict of interest.

Figures

Fig 1
Fig 1. CDK1 is knocked-out by P14 in Cdk1Liv-/- hepatocytes.
(A) qPCR for Cdk1 mRNA expression in pre-natal hepatoblasts (E14.5) and post-natal hepatocytes (P14) (n = 3 mice per genotype per time point). (B) Representative image of in situ hybridization for exon 3 of Cdk1 on liver sections using the BaseScope assay. (C) Immunoblot of lysates from hepatoblasts (E14.5) and hepatocytes (P14) probed for CDK1 with HSP90 as loading control. (D) Quantification of CDK1 protein level from western blot, normalized to HSP90 protein levels. Error bars represent S.D. (E) Representative immunofluorescence images of sections stained for DAPI (blue), denoting the nuclei, and histone H3 pS10 (green), a marker for mitosis. (F) Quantification of H3pS10+ cells using at least 3,000 hepatocytes per mouse (n = 3 per genotype). Error bars represent S.E.M. (G) Representative H&E images of liver sections from P14 hepatocytes. (H) Quantification of nuclei size of P14 hepatocytes using at least 200 hepatocytes per mouse (n = 3 per genotype). (I) Ratio of liver weight to body weight, shown as percentage (%) of P14 mice (at least n = 8 per genotype). Error bars represent S.E.M. unless otherwise indicated. Scale bar of all microscopy images represent 50μm.
Fig 2
Fig 2. Cdk1Liv-/- hepatocytes do not proliferate but undergo DNA re-replication.
(A) DNA content analysis by flow cytometry of propidium iodide-stained hepatocytes isolated at P14. (B) Quantification of binuclear and mononuclear hepatocytes using at least 3,000 hepatocytes per mouse (at least n = 4 per genotype). (C) Representative immunohistochemistry images of sections stained for PCNA (brown), a marker for DNA replication, at different post-natal time points. (D) Quantification of PCNA+ cells using at least 200 hepatocytes per mouse (n = 5 per genotype per time point). (E) Representative immunofluorescence images of sections stained for DAPI (blue), denoting the nuclei, and γH2AX (green), a marker for DNA damage. (F) Quantification of γH2AX foci from 1000 nuclei using at least 5 images per mouse (at least n = 3 per genotype). (G) Quantification of γH2AX+ cells using at least 1,500 hepatocytes per mouse (at least n = 3 per genotype). (H) Immunoblot of lysates from P56 whole liver probed for CHK1 pS345, total CHK1, p21Cip1/Waf1, p53 pS15 and total p53, using HSP90 as loading control. (I) Quantification of ratio of CHK1 pS345 to total CHK1 levels. (J) qPCR for Cdkn1a mRNA expression in P56 whole liver sample (n = 6 per genotype). Quantification of p21 protein levels (K) and the ratio of p53 pS15 to total p53 levels (L). Error bars of all graphs excluding immunoblot quantification represent S.E.M. Error bars of immunoblot quantification represent S.D. Scale bar of all microscopy images represent 50μm.
Fig 3
Fig 3. Transcriptomic analysis of Cdk1Liv-/- hepatocytes and whole liver.
Blood test for (A) alanine aminotransferase (ALT), (B) total bilirubin, and (C) alkaline phosphatase (ALP) levels at different post-natal time points (at least n = 5 per genotype per time point). (D) Principal component analysis of RNAseq results, with each dot or cross representing one sample that is either whole liver (LIV) or isolated hepatocyte (HEP) from wild type (WT) or Cdk1Liv-/- (KO) mice. (E) Correlation plot of RNAseq results from whole liver and isolated hepatocytes, with each dot representing one gene that is either not significantly differentially expressed (grey), significantly differentially expressed in whole liver only (blue), in isolated hepatocytes only (red), or in both whole liver and isolated hepatocytes (green). (F) Heat map of gene ontologies of genes up-regulated (UP) or down-regulated (DN) in Cdk1Liv-/- compared to WT samples with representative gene ontologies from each cluster listed. Color scale represents–log10(p-value). (G) Heat map of cell cycle associated genes from RNAseq analysis. (H) Heat map of DNA damage associated genes from RNAseq analysis. Color scales represent Z-score unless otherwise specified. Error bars of all graphs represent S.E.M.
Fig 4
Fig 4. Cdk1Liv-/- liver exhibits inflammation and fibrosis.
(A) Representative immunohistochemistry images of sections stained for F4/80 (brown), a marker for macrophages, at different post-natal time points. (B) Quantification of F4/80+ cells using 5 images per mouse (at least n = 4 per genotype per time point). (C) qPCR for Col1a1, Pdgfra, and Tgfb2 mRNA expression in whole liver sample (n = 6 per genotype). (D) Representative images of Sirius Red-stained liver sections at different post-natal time points. (E) Quantification of Sirius Red-stained area using at least 5 images per mouse (at least n = 4 per genotype per time point). Error bars of all graphs represent S.E.M. Scale bars of all microscopy images represent 50μm.
Fig 5
Fig 5. Characterization of the inflammatory response in Cdk1Liv-/- liver.
(A) Heat map of inflammation-associated genes from the RNAseq analysis. Color scale represents Z-score. (B) Cytokine array of lysates from P14 whole liver (n = 3 per genotype). (C) Correlation plot of cytokine levels from the RNAseq analysis and the cytokine array. Whole blood from wild type (WT) and Cdk1Liv-/- mice were analyzed for (D) monocytes, (E) lymphocytes and neutrophils and shown as a percentage (%) of the total number of leukocytes analyzed from the same mouse (n = 4 per genotype). (F) ChIP for NFκB p65 pS536 from lysates of isolated hepatocytes, probing for the Ccl2 promoter by qPCR (n = 3 per genotype). Error bars represent S.E.M.
Fig 6
Fig 6. Ccna2Liv-/- liver exhibits hypertrophy and fibrosis.
(A) Representative H&E images of liver sections. Arrows point to areas of immune infiltration. (B) Quantification of nuclei size of hepatocytes using at least 500 hepatocytes per mouse (n = 4 per genotype per time point). (C) DNA content analysis by flow cytometry of propidium iodide-stained hepatocytes isolated from wild type (WT) and Ccna2Liv-/- mice at P84. (D) Representative images of Sirius Red-stained liver sections. (E) Quantification of Sirius Red-stained area using at least 10 images per mouse (n = 4 per genotype per time point). Error bars represent S.E.M.
Fig 7
Fig 7. Cdk2 knockout rescues phenotype of Cdk1Liv-/- liver.
(A) Immunoblot of lysates from P14 hepatocytes isolated from wild type (WT), Cdk1Liv-/- and double knockout (DKO) mice, probed for CDK1 and CDK2 with HSP90 as loading control. (B) Ratio of liver weight to body weight, shown in percentage [%] (at least n = 4 per genotype). Error bars represent S.D. (C) DNA content analysis by flow cytometry of propidium iodide-stained hepatocytes isolated from wild type (WT), Cdk1Liv-/-, and double knockout (DKO) mice at P14. (D) Representative H&E images, immunohistochemistry images of sections stained for F4/80 (brown), and Sirius Red-stained images of liver sections. (E) Quantification of nuclei size of hepatocytes using at least 300 hepatocytes per mouse (n = 5 per genotype). (F) Quantification of F4/80+ area using at least 4 images per mouse (at least n = 5 per genotype). (G) Quantification of Sirius Red-stained area using at least 4 images per mouse (n = 5 per genotype). (H) Immunoblot of lysates from P14 isolated hepatocytes probed for CHK1 pS345, total CHK1, p53 pS15, and total p53, using HSP90 as loading control. Quantification of ratio of (I) CHK1 pS345 to total CHK1 levels and (J) p53 pS15 to total p53 levels. (K) qPCR for Cdkn1a mRNA expression in P14 isolated hepatocytes (n = 3 per genotype). Error bars of all graphs represent S.E.M. unless otherwise stated. Error bars of immunoblot quantification represent S.D. Scale bar of all microscopy images represent 50μm.
Fig 8
Fig 8. Model of liver inflammation and fibrosis in Cdk1Liv-/- liver.
Pathological polyploidy in Cdk1Liv-/- hepatocytes activates p53 as part of the DNA damage response, which in turn triggers NFκB signaling. NFκB then induces expression of CCL2, and possibly CXCL10, SERPINE1, and TIMP1. CCL2 and CXCL10 recruit monocytes and macrophages leading to immune cell infiltration in the liver. Immune cells subsequently activate hepatic stellate cells to drive liver fibrosis. Separately, SERPINE1 and TIMP1 secreted by hepatocytes also promote the development of fibrosis by blocking the activity of proteases that breakdown extracellular matrix.

Similar articles

Cited by

References

    1. Miyaoka Y, Miyajima A. To divide or not to divide: revisiting liver regeneration. Cell Div. 2013;8(1):8 10.1186/1747-1028-8-8 - DOI - PMC - PubMed
    1. Macdonald RA. "Lifespan" of liver cells. Autoradio-graphic study using tritiated thymidine in normal, cirrhotic, and partially hepatectomized rats. Arch Intern Med. 1961;107:335–43. 10.1001/archinte.1961.03620030023003 - DOI - PubMed
    1. Yang SQ, Lin HZ, Mandal AK, Huang J, Diehl AM. Disrupted signaling and inhibited regeneration in obese mice with fatty livers: implications for nonalcoholic fatty liver disease pathophysiology. Hepatology. 2001;34(4 Pt 1):694–706. 10.1053/jhep.2001.28054 - DOI - PubMed
    1. Zhao G, Nakano K, Chijiiwa K, Ueda J, Tanaka M. Inhibited activities in CCAAT/enhancer-binding protein, activating protein-1 and cyclins after hepatectomy in rats with thioacetamide-induced liver cirrhosis. Biochem Biophys Res Commun. 2002;292(2):474–81. 10.1006/bbrc.2002.6630 - DOI - PubMed
    1. Vetelainen R, van Vliet AK, van Gulik TM. Severe steatosis increases hepatocellular injury and impairs liver regeneration in a rat model of partial hepatectomy. Ann Surg. 2007;245(1):44–50. 10.1097/01.sla.0000225253.84501.0e - DOI - PMC - PubMed

Publication types

MeSH terms