

Boosting test-efficiency by pooled testing for SARS-CoV-2-Formula for optimal pool size
- PMID: 33147228
- PMCID: PMC7641378
- DOI: 10.1371/journal.pone.0240652
Boosting test-efficiency by pooled testing for SARS-CoV-2-Formula for optimal pool size
Abstract
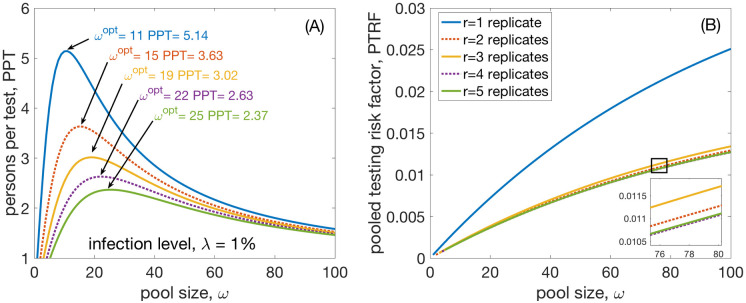
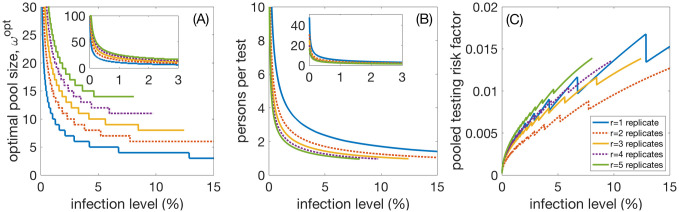
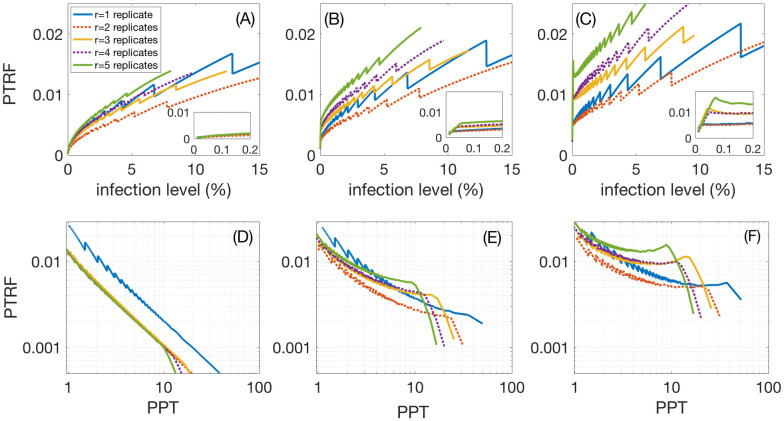
In the current COVID19 crisis many national healthcare systems are confronted with an acute shortage of tests for confirming SARS-CoV-2 infections. For low overall infection levels in the population the pooling of samples can drastically amplify the testing capacity. Here we present a formula to estimate the optimal group-size for pooling, the efficiency gain (tested persons per test), and the expected upper bound of missed infections in pooled testing, all as a function of the population-wide infection levels and the false negative/positive rates of the currently used PCR tests. Assuming an infection level of 0.1% and a false negative rate of 2%, the optimal pool-size is about 34, and an efficiency gain of about 15 tested persons per test is possible. For an infection level of 1% the optimal pool-size is 11, the efficiency gain is 5.1 tested persons per test. For an infection level of 10% the optimal pool-size reduces to about 4, the efficiency gain is about 1.7 tested persons per test. For infection levels of 30% and higher there is no more benefit from pooling. To see to what extent replicates of the pooled tests improve the estimate of the maximal number of missed infections, we present results for 1 to 5 replicates.
Conflict of interest statement
The authors have declared that no competing interests exist.
Figures
References
-
- Jeffay N. To ease global virus test bottleneck, Israeli scientists suggest pooling samples. The Times of Israel. 2020 March 18. Available from: https://www.timesofisrael.com/to-ease-global-virus-test-bottleneck-israe....
-
- Rambam Medical Center and the Technion in Haifa. Pooling Method for Accelerated Testing of COVID-19. Available from: https://www.technion.ac.il/en/2020/03/pooling-method-for-accelerated-tes....
-
- Dorfman R. The detection of defective numbers of large populations. Annals of Mathematical Statistics 1943;14:436–440. 10.1214/aoms/1177731363 - DOI
-
- Du DZ and Hwang FK. Pooling Designs and Nonadaptive Group Testing. Series on Applied Mathematics 2006; 18 10.1142/6122 - DOI
Publication types
MeSH terms
Substances
LinkOut - more resources
Full Text Sources
Other Literature Sources
Medical
Miscellaneous
