DNA methylation in blood-Potential to provide new insights into cell biology
- PMID: 33147241
- PMCID: PMC7641429
- DOI: 10.1371/journal.pone.0241367
DNA methylation in blood-Potential to provide new insights into cell biology
Abstract
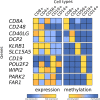
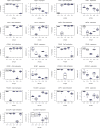
Epigenetics plays a fundamental role in cellular development and differentiation; epigenetic mechanisms, such as DNA methylation, are involved in gene regulation and the exquisite nuance of expression changes seen in the journey from pluripotency to final differentiation. Thus, DNA methylation as a marker of cell identify has the potential to reveal new insights into cell biology. We mined publicly available DNA methylation data with a machine-learning approach to identify differentially methylated loci between different white blood cell types. We then interrogated the DNA methylation and mRNA expression of candidate loci in CD4+, CD8+, CD14+, CD19+ and CD56+ fractions from 12 additional, independent healthy individuals (6 male, 6 female). 'Classic' immune cell markers such as CD8 and CD19 showed expected methylation/expression associations fitting with established dogma that hypermethylation is associated with the repression of gene expression. We also observed large differential methylation at loci which are not established immune cell markers; some of these loci showed inverse correlations between methylation and mRNA expression (such as PARK2, DCP2). Furthermore, we validated these observations further in publicly available DNA methylation and RNA sequencing datasets. Our results highlight the value of mining publicly available data, the utility of DNA methylation as a discriminatory marker and the potential value of DNA methylation to provide additional insights into cell biology and developmental processes.
Conflict of interest statement
The authors have declared that no competing interests exist.
Figures


Similar articles
-
Integrative analysis of DNA methylation and mRNA expression during differentiation of umbilical cord blood derived mononuclear cells to endothelial cells.Gene. 2017 Nov 30;635:48-60. doi: 10.1016/j.gene.2017.09.006. Epub 2017 Sep 6. Gene. 2017. PMID: 28887159
-
Early DNA methylation changes in children developing beta cell autoimmunity at a young age.Diabetologia. 2022 May;65(5):844-860. doi: 10.1007/s00125-022-05657-x. Epub 2022 Feb 10. Diabetologia. 2022. PMID: 35142878 Free PMC article.
-
Genome-wide DNA methylation analysis reveals loci that distinguish different types of adipose tissue in obese individuals.Clin Epigenetics. 2017 May 3;9:48. doi: 10.1186/s13148-017-0344-4. eCollection 2017. Clin Epigenetics. 2017. PMID: 28473875 Free PMC article.
-
Hypermethylation of glucocorticoid receptor gene promoter results in glucocorticoid receptor gene low expression in peripheral blood mononuclear cells of patients with systemic lupus erythematosus.Rheumatol Int. 2015 Aug;35(8):1335-42. doi: 10.1007/s00296-015-3266-5. Epub 2015 Apr 22. Rheumatol Int. 2015. PMID: 25899090
-
DNA methylation testing and marker validation using PCR: diagnostic applications.Expert Rev Mol Diagn. 2012 Jan;12(1):75-92. doi: 10.1586/erm.11.90. Expert Rev Mol Diagn. 2012. PMID: 22133121 Review.
Cited by
-
BRCA1/2 methylation and expression dynamics in hereditary breast and ovarian cancer: insights from gene, protein, and TCGA analysis.Clin Transl Oncol. 2025 Apr 30. doi: 10.1007/s12094-025-03934-w. Online ahead of print. Clin Transl Oncol. 2025. PMID: 40307595
-
OXTR-Related Markers in Clinical Depression: a Longitudinal Case-Control Psychotherapy Study.J Mol Neurosci. 2022 Apr;72(4):695-707. doi: 10.1007/s12031-021-01930-7. Epub 2021 Nov 25. J Mol Neurosci. 2022. PMID: 34822109 Free PMC article.
References
Publication types
MeSH terms
Substances
LinkOut - more resources
Full Text Sources
Research Materials

