

doi: 10.1126/science.331474.
Viral integration and excision: structure of the lambda att sites
- PMID: 331474
- PMCID: PMC1994661
- DOI: 10.1126/science.331474
Item in Clipboard
Viral integration and excision: structure of the lambda att sites
Science.
.
No abstract available
Figures

The λ integration-excision pathway and the origin of transducing phage carrying different att sites. Integration of the circularized phage genome requires the phage-encoded protein int and proceeds via site-specific recombination between the phage att site POP’ and the primary bacterial att site BOB’. The reaction yields a prophage bounded by a left prophage att site, BOP’ (attL), and a right prophage att site, POB’ (attR.). The reverse reaction, excision, involves recombination between BOP’ and POB’ to yield BOB’ and POP’ (excised phage) and requires int and a second phage product xis, both of which map immediately to the right of att. The gal transducing phage carrying the left prophage att site and bio transducing phage carrying the right prophage att site are created by rare excision events in which int-independent recombination occurs at sites other than the prophage att sites. A gal-bio transducing phage carrying the bacterial att site BOB’ is generated by int-dependent recombination between the prophage att sites of coinfecting gal and bio transducing phage.
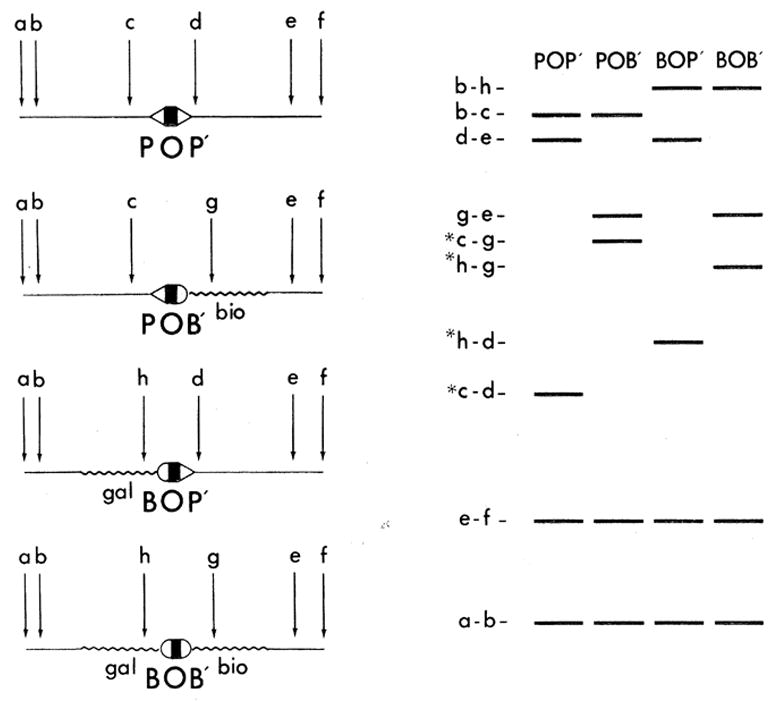
Logic used to identify restriction fragments carrying the four att sites POP’, POB’, BOP’, and BOB’. The DNA’s from four phage, each carrying a different att site, are cleaved with a restriction endonuclease at the specific sites marked a to h. The DNA restriction fragments, resolved by electrophoresis in adjacent gel lanes, are predicted to fall into three categories: (i) those common to all four profiles, and deriving from phage DNA outside the boundaries of the bacterial DNA substitutions, for example, fragments a-b and e-f; (ii) those appearing in two of the four profiles, and deriving from within bacterial DNA, from the non-att phage-bacterial DNA juncture, or from within phage DNA deleted during formation of the transducing phages, for example, fragments b-c, d-e, b-h, and g-e; and (iii) those occurring in only one profile. These “unique” fragments, of which there should be one per profile, contain the crossover region, for example, fragments c-d, c-g, h-d and h-g (designated with an asterisk in the figure). Preparative quantities of the primary att-containing fragments (see text) are subjected to secondary digestions with restriction enzymes having shorter, and therefore more frequent, recognition sites. Secondary att-containing fragments can be identified by a similar logic; however, the first category of fragments, those appearing in all four profiles, is not expected in these experiments since the ends of the primary fragments fall within the bacterial DNA substitutions. An exception to the above predictions would be found if a primary or secondary restriction site occurred within a region of homology that was common to all four att sites; in this case, no unique, att-containing fragments would be found. This situation did not occur in our experiments.

Hinf 1 digestion profiles of the four primary att-containing fragments. The primary fragments are: (i) from λ wt. POP’ fragment of 1400 base pairs in length, named Cl: (ii) from λgal49 a 1600 base-pair BOP’ fragment, named B7a: (iii) from λbio256 a POB’ fragment of 650 base pairs, named D3a: and (iv) from λgal49bio256 a BOB’ fragment of 850 base pairs, named C8a (29). A portion (1.0 to 1.5 μg) of each purified primary fragment was incubated with Hinf I restriction endonuclease (29). Samples were subjected to electrophoresis on a 1-mm thick, 8 percent acrylamide-0.26 percent methylene-bis-acrylamide gel in tris-borate buffer. pH 8.3. for 4 hours at 150 volts. The gel was stained in ethidium bromide (2 μg/ml) and photographed with Polaroid 55 P/N film using a long-wave ultraviolet light source. Arrows mark the unique att-containing fragments in both gel and schematic profiles. (The B7a unique fragment. 227, comigrales with fragment 230. which is also found in Cl. In double digests with Hpa II. the 230 fragment is cut, leaving 227 readily apparent as the unique fragment; data not shown.) The molecular weight marker is a Hind II-III digest of
DNA (62). Calibration of the smaller fragments in this marker digest will be described elsewhere. Molecular weight estimates in base pairs arc given besides each fragment in the schematic profiles. (–––) Hinf 1 products of primary fragments: (-----) products of other fragments contaminating the primary fragment preparation (present in less than molar yield): (†) fragments whose entire sequences have been determined.

Map of secondary restriction endonuclease recognition sites in the att regions of the four primary att-containing fragments, Cl, D3a, B7a, and C8a. The primary fragments (29) were generated by a mixture of the two nucleases Hind II + III, recognizing the sequences GTPyPuAC (63) and AAGCTT, respectively (64). The secondary enzymes used in studying all four primary fragments were: Hinf I, purified from Haemophilus influenzae strain Rf, and recognizing the sequence GANTC (28); Hha I, purified from H. haemolyticus, recognizing GCGC (65); Hpa II, purified from H. parainfluenzae, recognizing CCGG (66); Mbo II, purified from Moraxella bovis, recognizing GAAGA and cutting eight base pairs downstream of the recognition site (28); and Alu I purified fromArthrobacter luteus, and recognizing AGCT (67). Hae III, purified from Haemophilus aegyptius, and recognizing GGCC (28) and BamH I, purified from Bacillus amyloliquefaciens H, recognizing GGATCC (28) were studied only with primary fragment Cl. Digestion conditions used for all enzymes were as reported (29). The methods used in mapping these recognition sites are discussed in the text. The numbering scale, in base pairs, is the same as that used for the sequence in Fig. 7. The precise positions of some restriction cut sites have been determined by sequence analysis (Figs. 6 and 7). Additional sites are known to occur in the B and P’ arms, but their map positions are undetermined. The presence of unmapped sites for particular enzymes is designated by the symbols between slashes in these arms. (▲) Hha I; (△) Mbo II; ■) Hinf I; (□) Alu I; (●) Hpa II; (○) Hae III; (––– ) phage DNA; (
 ) bacterial DNA; (*) the relative order of these two sites is not certain; ( + ) three additional Hha I sites occur to the right of the one mapped in B’, but their locations have not been determined.
) bacterial DNA; (*) the relative order of these two sites is not certain; ( + ) three additional Hha I sites occur to the right of the one mapped in B’, but their locations have not been determined.
Sequencing gels illustrating the central portion of the phage and bacterial att regions. Each gel shows a portion of the sequence that was obtained from the fragment named above the panel, for example, panel A sequence is from PB’4 (Fig. 6), fragment D3a-Alu 1 + Hpa 11-275 (see Tables 2 and 3). Also indicated above each panel are the region and direction of the sequence; for example, the sequence in panel A begins in O, the common core region, and extends into the B’ arm. Brackets indicate those bases that are part of a common core sequence. (In panels A and B, the bands corresponding to the first three nucleotides of the common core have been run off the gels; these bases were seen on other gels, for example, panel E; see also Table 2.) In preparation for sequencing, the fragments used in panels A to D were generated by digestion with the first enzyme in the name, then labeled at the 5′ end with polynucleotide kinase and [γ-32P]ATP as described (29). [γ-32P] ATP was synthesized according to modifications of methods described (33, 68). The two 5′ ends of each labeled fragment were separated either by (i) digestion with the second named enzyme, followed by gel purification of the products (panels A, B and D), or (ii) separation of the two DNA strands of the fragment by gel electrophoresis (panel C) (33, 34). In panel E, purified r strand of Cl-Hinf I-320 was digested with endonuclease IV (31), and the products were labeled at the 5′ end and purified by gel electrophoresis (32). Labeled fragments were eluted from gels by diffusion and sometimes purified from soluble gel material by BND cellulose or hydroxylapatite column chromatography. The sequencing method has been described by Maxam and Gilbert (33). We chose to use five of the reactions specified by Maxam and Gilbert, including two “alternative” cleavages. For the T+C lane, labeled fragment was incubated with 12 to 15M hydrazine hydrate. For the C>T lane, incubation was with 14 to 17M hydrazine hydrate, plus 1.5M NaCl. For the G+A and G lanes, the fragment was incubated with dimethyl sulfate. Half of the sample, for the G+A lane, was then subjected to the “strong adenine/weak guanine” cleavage method. The remaining half was cleaved by the “alternative guanine” method to specifically cleave methylated G residues. A fifth reaction, the “alternative strong adenine/weak cytosine” cleavage, was used for the A>C lane. The gels illustrated are 16 percent acrylamide-7M urea, with electrophoresis at 600 volts for approximately 9 hours, after a 6-hour prerun of the gel. Autoradiography was done at −20°C.

Schematic summary of results from Tables 1 to 3, showing the extent of complementary and overlapping sequence information. Only those portions of the four primary fragments from which sequence was determined are represented. Restriction sites in the sequenced region are indicated. Arrows represent lengths of sequence determined in particular experiments; the source of fragments, PP’ 1, and so forth, and actual sequence determined from them can be found in Tables 1 to 3. Arrows indicate sequence in a 5′ to 3′ direction. Those pointing rightward represent sequence from the l strand, those pointing leftward represent sequence from the r strand. The scale, in nucleotide pairs, is as designated for Fig. 7. (––––) Phage DNA; (
) bacterial DNA; (◆ ◆) common core region.
) bacterial DNA; (◆ ◆) common core region.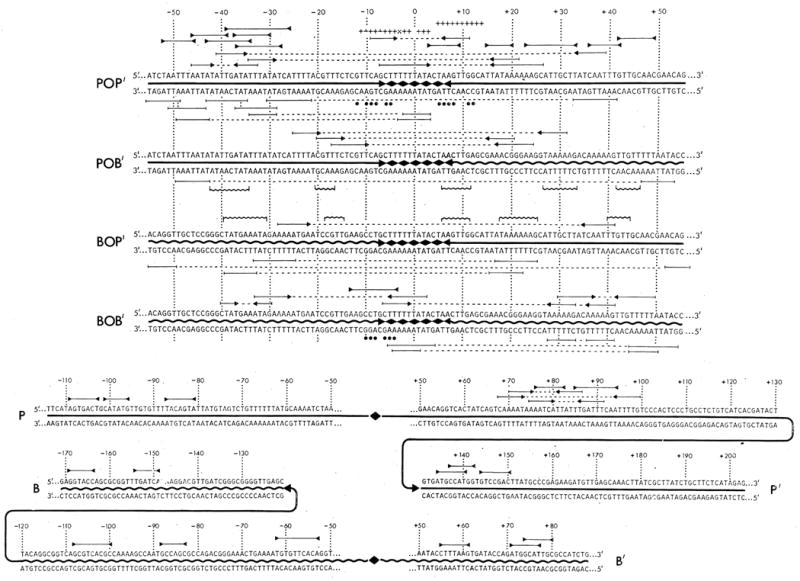
Sequences determined in the phage, prophage, and bacterial att site region. The sequences are numbered with zero as the central base of the common region. Sequences extending rightward from zero into the P’ and B’ arms is assigned postive numbers, and leftward from 0 into the P and B arms negative numbers (———) Phage DNA: (
) and bacterial DNA; (◆ ◆) the common core region. The top section of the figure includes the central 111 bases of each of the four att sites, 55 bases of each side of zero. The lower section includes the distal portions of the four arms, P and B from −50 toward the left, and P’ and B’ from +50 towards right. (There is 5-base overlap of each arm with the top section.) In the lower section, the central 101 bases are represented by the appropriate symbols. Three types of structural features are identified in the sequences. Molecular palindromes are indicated by (
 ) above the corresponding sequences in both the top and lower sections. There are no palindromes meeting the set criteria (see below) which are unique to the prophage att sites. Direct repeats are only marked in the top section and are indicated below the corresponding sequences by (
 ). Dashed lines connect the pairs of repeats. In the prophage sequences only those direct repeats (see below for criteria) which are unique to these sequences, that is, those with elements in P and B’ or B and P’, are shown. Inverted repeats are only marked in the top section and are indicated by (
 ) above the corresponding sequences. The two elements of each inverted repeats are connected by dashed lines. The only inverted repeats included in the lower section are the three that occur in the proposed int gene termination region (see text). The criteria used in marking each of the above sequences features were a minimum of six base pairs with no mismatches, a single central mismatch with at least three base pairs to each side. Three sequences, of special interest because of their location, have been marked as inverted repeats even though they do not meet the stated criteria. Two of these occur from −46 to −33 and from −40 to −30 in the P and b arms, respectively. The third sequences involves the core-arm junctures in the phage att site (see text). Direct and inverted repeats, with elements often separated by considerable distance, also occur in the distal portions of the arms (lower section) but have not been included. In the central 111 base pairs, similar sequences (“identities”) occurring in approximately the same position in the P and B arms, and in the P’ and B’ arms, are marked between the two prophage sequences by (
 ). A sequence of ten bases (+5 to +14) in the phage l strand (marked+++) is identical to part of an inverted repeat structure in one arm of ISl (47). A similar but less perfect homology exists between the r strand (+3 to −11) and the other elements of the same inverted repeat structure that occurs in the other ISl arm (+, exact match; ⊥, purines or pyrimidine match; and ×, A-T base pair). Homology between the core-arm junctures and the 3′ end of 16S ribosomal RNA are indicated by (●) under the matching bases (see 69).
) and bacterial DNA; (◆ ◆) the common core region. The top section of the figure includes the central 111 bases of each of the four att sites, 55 bases of each side of zero. The lower section includes the distal portions of the four arms, P and B from −50 toward the left, and P’ and B’ from +50 towards right. (There is 5-base overlap of each arm with the top section.) In the lower section, the central 101 bases are represented by the appropriate symbols. Three types of structural features are identified in the sequences. Molecular palindromes are indicated by (
) above the corresponding sequences in both the top and lower sections. There are no palindromes meeting the set criteria (see below) which are unique to the prophage att sites. Direct repeats are only marked in the top section and are indicated below the corresponding sequences by (
). Dashed lines connect the pairs of repeats. In the prophage sequences only those direct repeats (see below for criteria) which are unique to these sequences, that is, those with elements in P and B’ or B and P’, are shown. Inverted repeats are only marked in the top section and are indicated by (
) above the corresponding sequences. The two elements of each inverted repeats are connected by dashed lines. The only inverted repeats included in the lower section are the three that occur in the proposed int gene termination region (see text). The criteria used in marking each of the above sequences features were a minimum of six base pairs with no mismatches, a single central mismatch with at least three base pairs to each side. Three sequences, of special interest because of their location, have been marked as inverted repeats even though they do not meet the stated criteria. Two of these occur from −46 to −33 and from −40 to −30 in the P and b arms, respectively. The third sequences involves the core-arm junctures in the phage att site (see text). Direct and inverted repeats, with elements often separated by considerable distance, also occur in the distal portions of the arms (lower section) but have not been included. In the central 111 base pairs, similar sequences (“identities”) occurring in approximately the same position in the P and B arms, and in the P’ and B’ arms, are marked between the two prophage sequences by (
). A sequence of ten bases (+5 to +14) in the phage l strand (marked+++) is identical to part of an inverted repeat structure in one arm of ISl (47). A similar but less perfect homology exists between the r strand (+3 to −11) and the other elements of the same inverted repeat structure that occurs in the other ISl arm (+, exact match; ⊥, purines or pyrimidine match; and ×, A-T base pair). Homology between the core-arm junctures and the 3′ end of 16S ribosomal RNA are indicated by (●) under the matching bases (see 69).
Base composition of phage and bacterial att sites. Average base composition of blocks of ten base pairs, beginning at zero (0 to 10, 11 to 20, and so on) is represented as the percent of A+T.

Potential chain termination triplets for the int gene. The positions of all chain termination codons (UAA, UGA. or UAG) are shown for each of the three reading frames in the r strand (corresponding to the mRNA) of the P’ arm. Numbering of the P’ arm is as described for Fig. 7; U, uridine.
References
-
- Bukhari A, Shapiro J, Adhya S, editors. DNA Insertion Elements, Plasmids, and Episomes. Cold Spring Harbor Press; Cold Spring Harbor, N.Y: in press.
-
- Gottesman ME, Weisberg RA. In: The Bacteriophage Lambda. Hershey AD, editor. Cold Spring Harbor Press; Cold Spring Harbor, N.Y.: 1971. p. 113.
- Nash HA. Current Top Microbiol Immunol. in press. - PubMed
-
- Campbell A. Adv Genet. 1962;11:101.
Publication types
MeSH terms
Substances
Associated data
- Actions
- Actions
- Actions
Grants and funding
LinkOut - more resources
Full Text Sources
Other Literature Sources
