. 2020 Nov 25;120(22):12357-12489.
doi: 10.1021/acs.chemrev.0c00451. Epub 2020 Nov 4.

Optical Sensing and Imaging of pH Values: Spectroscopies, Materials, and Applications

Affiliations

Optical Sensing and Imaging of pH Values: Spectroscopies, Materials, and Applications

Andreas Steinegger et al. Chem Rev. .

Abstract

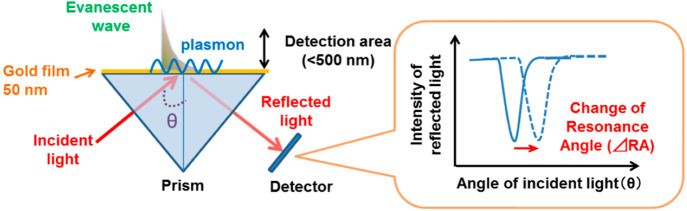
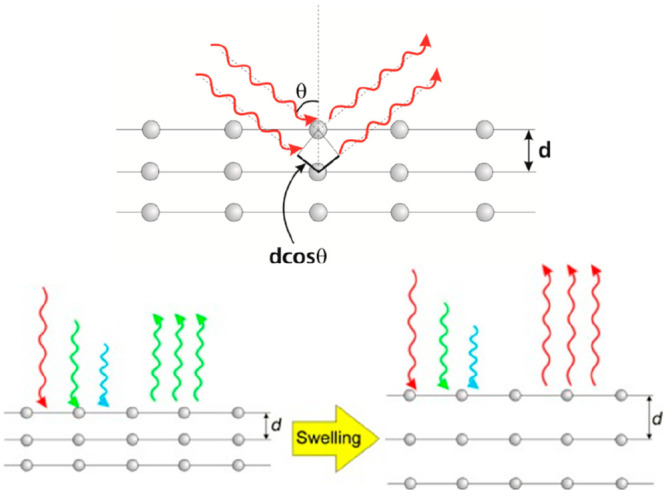
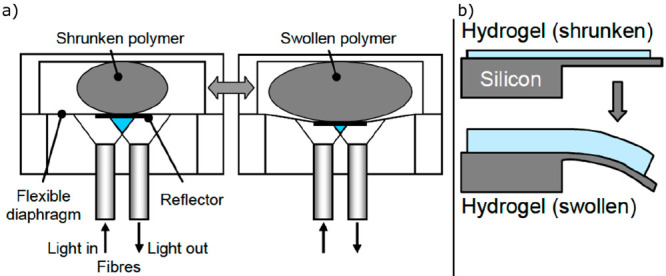
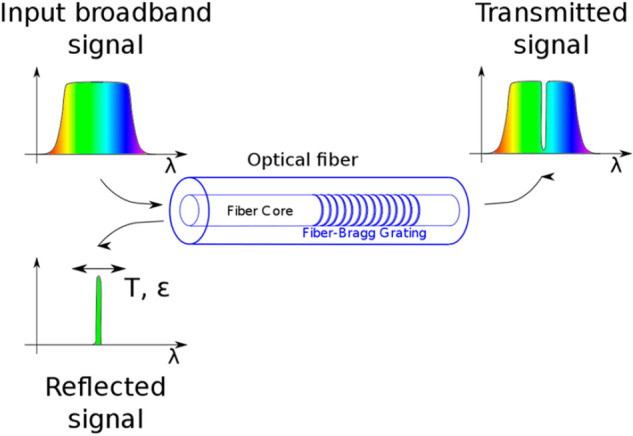
This is the first comprehensive review on methods and materials for use in optical sensing of pH values and on applications of such sensors. The Review starts with an introduction that contains subsections on the definition of the pH value, a brief look back on optical methods for sensing of pH, on the effects of ionic strength on pH values and pKa values, on the selectivity, sensitivity, precision, dynamic ranges, and temperature dependence of such sensors. Commonly used optical sensing schemes are covered in a next main chapter, with subsections on methods based on absorptiometry, reflectometry, luminescence, refractive index, surface plasmon resonance, photonic crystals, turbidity, mechanical displacement, interferometry, and solvatochromism. This is followed by sections on absorptiometric and luminescent molecular probes for use pH in sensors. Further large sections cover polymeric hosts and supports, and methods for immobilization of indicator dyes. Further and more specific sections summarize the state of the art in materials with dual functionality (indicator and host), nanomaterials, sensors based on upconversion and 2-photon absorption, multiparameter sensors, imaging, and sensors for extreme pH values. A chapter on the many sensing formats has subsections on planar, fiber optic, evanescent wave, refractive index, surface plasmon resonance and holography based sensor designs, and on distributed sensing. Another section summarizes selected applications in areas, such as medicine, biology, oceanography, bioprocess monitoring, corrosion studies, on the use of pH sensors as transducers in biosensors and chemical sensors, and their integration into flow-injection analyzers, microfluidic devices, and lab-on-a-chip systems. An extra section is devoted to current challenges, with subsections on challenges of general nature and those of specific nature. A concluding section gives an outlook on potential future trends and perspectives.


Conflict of interest statement

The authors declare no competing financial interest.

Figures

Figure 1
Figure 1
(a) Typical pH titration plot of a pH indicator (HPTS) with a single pH transition (and pKa value). Reprinted by permission of Springer Nature from ref (36). Copyright Springer Nature 1983. Note that the shape of titration plots depends on the analytical wavelengths in absorption, emission, or excitation: At the isosbestic point (here at 415 nm), the signal is independent of the pH value. (b) Typical titration plot of a pH-dependent conductive polymer (polyaniline) with several overlapping transitions due to the presence of many protonable nitrogen atoms in different microenvironments. This results in a much wider detection range. Reprinted from ref (68) with permission from Elsevier. Copyright Elsevier Science B.V. 1997. (c) Titration plot for a typical nanomaterial (graphite oxide) with two fairly wide transitions that have been attributed to the dissociation of carboxy groups and phenolic hydroxy groups. Reprinted by permission of Springer Nature from ref (98). Copyright Springer Nature 2012.
Figure 2
Figure 2
Commercially available disposable optical pH sensor attached to a single-use flow-through T-cell (from PreSens). It is connected to the pH meter (not shown) via a polymer optical fiber (top). The sensor spot (diameter = 3 mm) is placed in such a way that it is in contact with the sample solution passing the T-cell. These sensors typically cover the pH range of 5.5–8.5 and are precalibrated. Major applications are in perfusion systems and in process monitoring. Reprinted from https://www.presens.de/de/produkte/detail/ph-einweg-durchflusszelle-ftc-su-hp5-s with permission of Presens GmbH (Regensburg, Germany).
Figure 3
Figure 3
Calibration plots of hydrogel-immobilized fluorescein indicators at different ionic strengths, demonstrating the decrease in the pKa value with increasing ionic strength of the solution. Reprinted with permission of The Royal Society of Chemistry from ref (110). Copyright Royal Society of Chemistry 2005. Permission conveyed through Copyright Clearance Center, Inc.
Figure 4
Figure 4
Salinity (in PSU) dependency of the apparent pKa´ of m-cresol purple in water. Reprinted from ref (116) with permission from Elsevier. Copyright Elsevier B.V. 2004.
Figure 5
Figure 5
Salinity cross-talk of the pH sensors based on 1-aminoperylene (left) and aza-BODIPY-based indicators (right, salinity in PSU) both embedded into uncharged cross-linked poly(acryloylmorpholine) hydrogel (T = 25 °C). Reprinted with permission of The Royal Society of Chemistry from ref (123). Copyright the Royal Society of Chemistry 2013. Permission conveyed through Copyright Clearance Center, Inc. Reprinted from ref (124) with permission from Elsevier. Copyright Elsevier B.V. 2019.
Figure 6
Figure 6
Temperature dependency for the sensor based on aza-BODIPY pH indicator bearing a phenol receptor. Reprinted from ref (124) with permission from Elsevier. Copyright 2019 Elsevier B.V.
Figure 7
Figure 7
Schematic of an optoelectronic module for continuous sensing of pH values in a flow tube, usually a bypass of a bioreactor fluid, such as in fermenters (beer, wine or production of penicillin). The pH sensitive layer typically is covered with a black optical isolation to prevent sample fluorescence to interfere or to cause inner filter effects. Two LEDs are employed, one serving as a reference. The two LEDs are alternatingly turned on, and the signals of the sensor layer are acquired by a photodiode (PD).
Figure 8
Figure 8
Time-resolved sensing. Following an excitation pulse (during which luminescence rises to a maximum; blue area), the photodetector is opened only after a certain delay time during which background luminescence (yellow) is allowed to decay. The luminescence of the pH-sensitive probe, in contrast, decays much slower (mainly red area) and can be detected after the delay time and with virtually zero background. The method does not compensate, however, for constant levels of ambient light or long-lived background luminescence. Reprinted from ref (132) with public license. Published by The Royal Society of Chemistry.
Figure 9
Figure 9
Structures of two PET-based fluorescent probes and illustration of PET-based pH sensing. The PET groups can be attached in R1 or R2 position.
Figure 10
Figure 10
Principle of the DLR referencing for read-out of fluorescent sensors in time domain (left) and in frequency domain (right). The upper and the lower rows reflect the situations with “switched on” and “switched off” pH indicator, respectively.
Figure 11
Figure 11
Schematic of a fiber optic pH sensor based on measurement of changes in refractive index (RI). If the RI of the cladding approaches or exceeds the RI of the core, light will not be completely reflected at the interface and get “lost”. This is referred to as a leaky mode.
Figure 12
Figure 12
Phase transition behavior of polyelectrolyte hydrogels. Acidic hydrogels (red) swell in basic solution because of ionization by deprotonation; basic hydrogels (blue swell in acidic solutions and amphiphilic hydrogels (green) contain both acidic and basic groups and therefore show two phase transitions. Adapted from ref (158) with public license. Published by MDPI.
Figure 13
Figure 13
Schematic of an SPR-based sensor. Incident (laser) light hits a gold film placed on a prism. Part of the light wave evanesces into the detection area that consists of a pH-dependently swelling polymer. The angle of reflection depends on the refractive index of the coating, and this is detected by plotting the intensity of reflected light versus the angle of incident light. Reprinted from ref (160) with public license. Published by MDPI.
Figure 14
Figure 14
Simplified scheme of light reflection of ordered spheres in a photonic crystal illustrating how the distance in crystals of defined dimensionality (1D, 2D, or 3D) causes a change in the reflected wavelength. Adapted with permission from ref (163). Copyright Wiley-VCH Verlag GmbH & Co., KGaA, Weinheim 2014.
Figure 15
Figure 15
(a) Dual fiber sensor based on measurement of the displacement of a reflector. Changes in polymer volume cause the reflecting diaphragm to move, which in turn changes the intensity of light reflected back into the optical fiber. (b) Principle of a microcantilever-based pH sensor coated with a swellable hydrogel. Adapted from ref (158) with public license. Published by MDPI.
Figure 16
Figure 16
Fiber Bragg grating showing the optical fiber core with the grating, the input spectrum, and the transmitted spectrum, which lacks the fraction that can be found in the reflected signal. The wavelength of the reflected signal is strongly affected if pH (or any other parameter, such as temperature) expands the grating period. Reprinted from ref (181) with public license. Published by MDPI.
Figure 17
Figure 17
Overview of the most common absorptiometric indicators used in optical pH sensors.
Figure 18
Figure 18
Overview of other absorptiometric indicators used in optical pH sensors.
Figure 19
Figure 19
Different classes of pH indicators, which found application in optical sensors (part 1/2, other part see Figure 20). Numerous other dyes reported have been reported as molecular probes and are described in detail elsewhere.,
Figure 20
Figure 20
Different classes of pH indicators that have found application in optical sensors (part 2/2, other part see Figure 19). Numerous other dyes have been reported to be viable molecular probes and are described in detail elsewhere.,
Figure 21
Figure 21
Structure–pKa´ value relationship in fluorescent indicators libraries exemplified for fluoresceins (A) and BODIPY dyes (B).
Figure 22
Figure 22
Chemical structures of luminescent ruthenium(II) polypyridyl (1–6) and lanthanide (7–9) complexes used in optical pH sensors, and of model compounds 10, 11 that were used in solution studies.
Figure 23
Figure 23
Luminescent lifetimes of the acidic and basic forms of 13 and 12 (Figure 22D) in 10 mM phosphate buffer (air saturation) as a function of pH. The inserts show the corresponding amplitudes of the luminescence lifetimes obtained from the biexponential fits of the emission decays at each pH value. Dependency of the pKa and apparent pKa´ values on concentration of the phosphate buffer is given on the right. Adapted with permission from ref (559). Copyright American Chemical Society 2010.
Figure 24
Figure 24
Chemical structures of representative polymers as used in pH-sensing materials.
Figure 25
Figure 25
Physical entrapment as strategy for immobilization of pH indicators into matrices
Figure 26
Figure 26
Covalent immobilization for immobilization of pH indicators into matrices.
Figure 27
Figure 27
Chemical structures of the pH optodes based on conjugated polymers.
Figure 28
Figure 28
Examples of pH nanosensors exploring conformational changes of polymers. (A) Chemical structure and sensing mechanism of the nanoprobe based on a pyrene energy donor and a coumarin energy acceptor connected via a polyacrylamide linker modified with pH sensitive sulfadimethoxine. Reprinted with permission from ref (871). Copyright American Chemical Society 2005. (B) Chemical structure, sensing mechanism and pH dependency of fluorescence spectra (λexc = 365 nm) for the nanoprobe composed of two quantum dots emitters and graphite oxide acting as a quencher. Reprinted with permission from ref (872). Copyright American Chemical Society 2014. (C) chemical structures of the self-assembled polymeric micelles nanosensors, fluorescent images of their aqueous solutions at the same polymer concentration (100 μg/mL) but different pH values (pseudocolors were used for PC7A-C55 and PC6A-C75 nanoprobes due to their near IR emissions) and the pH response of the nanosensors. Reprinted with permission from ref (873). Copyright American Chemical Society 2012. (D) Chemical structure of a unimolecular polymeric micelle pH probe, schematic representation of the volume phase transition and respective pH response. Reprinted with permission of The Royal Society of Chemistry from ref (874). Copyright The Royal Society of Chemistry 2014. Permission conveyed through Copyright Clearance Center, Inc.
Figure 29
Figure 29
Cross-section of a planar optode with light-enhancing and optical isolation layers. The same design can be adapted for fiber-optic sensors. The upper layers are knife-coated or sprayed onto a dry sensing layer. Dissolution of the upper part of the sensing layer ensures good adhesion but also bears the risk of dye extraction in case of physically entrapped indicators.
Figure 30
Figure 30
Ratiometric luminescent pH sensing. (A) pH dependency of excitation (left) and emission (right) spectrum of 8-hydroxypyrene-1,3,6-trisulfonate HPTS in an aqueous buffer. Reprinted by permission of Springer Nature from ref (36). Copyright Springer Nature 1983. (B) pH-dependent excitation (left) and emission (right, λexc 534 nm) spectra of C-SNARF-1 in an aqueous buffer. Reprinted from ref (445) with permission from Elsevier. Copyright Elsevier, Inc., 1991. (C) pH-dependent emission spectra of the sensing material incorporating an aza-BODIPY pH indicator in hydrogel D4 and reference emitter Egyptian blue used in form of microcrystalline powder in the same matrix. Both emitters are excited at 625 nm. Author version of a figure from ref (153). Copyright American Chemical Society 2013.
Figure 31
Figure 31
Examples of decay time sensing of pH. (A) Fluorescence phase shift and decay time response of SNARF-6 to pH under 543 nm excitation and emission detected at different wavelengths. Adapted with permission from ref (937). Copyright American Chemical Society 1993. (B) Decay time response of the Cu-doped gradient-alloyed CdZnS nanoparticles to pH. Adapted with permission of The Royal Society of Chemistry from ref (798). Copyright The Royal Society of Chemistry 2015. Permission conveyed through Copyright Clearance Center, Inc.
Figure 32
Figure 32
Examples of anisotropy-based pH sensing. (A) pH dependency of fluorescence anisotropy of 10-diethylaminomethylanthracene in an unspecified solvent. Adapted with permission from ref (940). Copyright American Chemical Society 1993. (B) pH dependency of the emission spectra (left) and anisotropy (right) of the stretched films containing Py-2 (structure shown below) and solution of 6-carboxyfluorescein. Adapted with permission of The Royal Society of Chemistry from ref (941). Copyright The Royal Society of Chemistry 2015. Permission conveyed through Copyright Clearance Center, Inc.
Figure 33
Figure 33
Chemical structures of the optical pH probes utilizing FRET.
Figure 34
Figure 34
Examples of FRET-based pH sensors. (A) Fluorescence spectra (left) and pH calibration plot (right) for ratiometric pH-sensitive nanoparticles based on coumarin 6, Nile red, and BTB. Reprinted with permission from ref (768). Copyright Wiley-VCH Verlag GmbH & Co., KGaA, Weinheim 2010. (B) Luminescence lifetime-based pH sensing utilizing FRET from the phosphorescent Ru(II) polypyridyl dye to a pH-sensitive aza-dye. Reprinted with permission from ref (944). Copyright American Chemical Society 1998.
Figure 35
Figure 35
(A) Cross-section of an optical pH sensor based on inner-filter effect read-out. (B) Emission spectra of the pH sensor (λexc = 590 nm) obtained in a time-resolved measurement (delay 20 μs) and resulting calibration curve (inset). Reprinted from ref (949) with permission from Elsevier. Copyright Elsevier B.V. 2013.
Figure 36
Figure 36
Examples of pH sensors based on lanthanide upconversion. (A) pH-dependent upconversion spectra for the sensor film utilizing NaYF4:Er3+,Yb3+ nanorods and bromothymol blue. Reprinted with permission of The Royal Society of Chemistry from ref (950). Copyright The Royal Society of Chemistry 2009. (B) pH-dependent upconversion spectra of the sensor film containing NaCaY0.2Yb0.7Tm0.02Ho0.08(MoO4)3 microcrystalline powder and an aza-BODIPY pH indicator and the respective calibration plot (inset). Reprinted from ref (953) with permission from Elsevier. Copyright Elsevier B.V. 2017. (C) Emission spectra of the NaYF4:Yb3+,Er3+ nanorods (inset) together with the absorption spectra of the ETH 5418 pH indicator in protonated and deprotonated forms. Reprinted with permission from ref (952). Copyright American Chemical Society 2012. (D) pH-dependent upconversion spectra for the sensor film containing NaYF4:Yb3+,Er3+ nanorods and ETH 5418 in plasticized poly(vinyl chloride) and the respective calibration plot (inset). Reprinted with permission from ref (952). Copyright American Chemical Society 2012.
Figure 37
Figure 37
(A) Cross-section of the Paratrend 4-parameter array sensor. Reprinted by permission from Springer Nature from ref (972). Copyright Springer Nature 2004. (B) Spectral properties of the pH/pO2 dual sensor at different pH and oxygen concentrations as well as the spectral sensitivity of the camera channels. (DClFA, 2′,7′-dichloro-5(6)-N-octadecyl-carboxamidofluorescein; PtTPTBPF, platinum(II) meso-tetra(4-fluorophenyl) tetrabenzoporphyrin) Reprinted from ref (973) with public license. Published by The Royal Society of Chemistry.
Figure 38
Figure 38
Chemical structure and acid–base equilibrium for Pt(II) porphyrin acting as a dual indicator for oxygen (via phosphorescence quenching) and pH (via absorption changes).
Figure 39
Figure 39
Typical setup for imaging of pH distribution at a water–sand interface with planar optodes.
Figure 40
Figure 40
Examples of pH imaging. (A) Spectral response different channels of a dual chip (RGB + NIR) camera. Reprinted from ref (973) with public license. Published by The Royal Society of Chemistry. (B) Example of RGB pH imaging (pseudocolor) with a planar optode in marine sediment containing a burrow. Reprinted with permission from ref (374). Copyright by the Association for the Sciences of Limnology and Oceanography, Inc., 2011. (C) Imaging of a sensor array of immobilized pH indicators with a smartphone. Fluorescence images of the array at different pH values under UV excitation (left) and screenshot of a software for image processing (right). Reprinted with permission from ref (135). Copyright 2017 American Chemical Society. (D) Confocal fluorescence microscopy images (overlaid on bright field) of pH nanosensors in RBL mast cells showing (a) reference dye channel, (b) sensor dye channel, (c) overlaid images, and (d) pseudocolor ratiometric imaging of pH in various intracellular compartments. Reprinted with permission from ref (404). Copyright Wiley-VCH Verlag GmbH & Co., KGaA, Weinheim 2006.
Figure 41
Figure 41
Examples of lifetime-based pH imaging. (A) Frequency domain FLIM imaging of pH with the planar optode via fluorescence decay time of a triangulenium indicator PhOHCl2-DAOTA. Left: photographic image of the microfluidic chip with integrated sensor foil. Right: false color image of the pH distribution in the chip simultaneously flushed with buffers of pH 6.5 and 5.0 (speed 21 μL min–1). Reprinted with permission from ref (524). Copyright 2019 American Chemical Society. (B) Time domain FLIM images of MC3T3-E1 cells incubated with nigericin and buffers mimicking the extracellular medium at pH 4.87 (left) and 8.14 (right). The scale bars (white lines) represent 10 μm. CdZnS quantum dots pH probes were utilized. Reprinted with permission from ref (801). Copyright 2013 American Chemical Society. (C) False color images of pH distribution acquired with time domain DLR technique for a marine sediment after 10 (left) and 40 (right) min light exposure (∼450 μmol photons·m–2·s–1). Reprinted with permission from ref (146). Copyright by the Association for the Sciences of Limnology and Oceanography, Inc., 2006.
Figure 42
Figure 42
Comparison of the responses of a commercial test strip and the new pH test paper strips to (A) strong bases and (B) strong acids. Row I: Commercial pH test paper strips. Row II: Phen-MDI pH test paper strips. Rows III–IV: Phen-MDI in the presence of two different reference dyes that improve contrast. The photographs on the left were taken under visible light, and those on the right under irradiation with 365 nm light. Reprinted with permission from ref (998). Copyright American Chemical Society 2019.
Figure 43
Figure 43
Chemical structures of the indicators used for sensing of high pH. Upper and lower panels: Absorptiometric and fluorescent indicators, respectively. Note that the structure of indicator 1 is not disclosed; one of the R groups is a hydroxy group responsible for the pH sensitivity.
Figure 44
Figure 44
Chemical structures of the indicators used for sensing of low pH. For the structures of other indicators used in sensing of low pH the reader is referred to section 3.
Figure 45
Figure 45
(A) Chemical structure and acid–base equilibria of the corrole indicator. (B) Response of the pH optode based on sol–gel immobilized corrole. α = (FFb)/(FaFb), where F, Fb, and Fa are, respectively, the fluorescence intensities at a given pH, in the completely deprotonated form (pH 11) and in the completely protonated form (pH 1). Reprinted with permission of The Royal Society of Chemistry from ref (1005). Copyright The Royal Society of Chemistry 2006. (C) Extended range pH optode utilizing surface curvative of mesoporous silica nanoparticles (MSN) creating different density of positively charged groups originating from aminopropyltrimethoxysilane (AMPMS). Reprinted with permission of The Royal Society of Chemistry from ref (755). Copyright The Royal Society of Chemistry 2013. (D) pH response of mesoporous silica nanoparticles (MSN) and hollow mesoporous silica nanoparticles (HMS) stained with fluorescein and rhodamine dyes. Reprinted with permission of The Royal Society of Chemistry from ref (755). Copyright The Royal Society of Chemistry 2013.
Figure 46
Figure 46
(A) Response of the sensor based on a mixture of 6 4-amino-1,8-naphthalimide pH indicators immobilized onto aminocellulose particles, which were dispersed in polyurethane hydrogel. Adapted with permission from ref (466). Copyright 2015 American Chemical Society. (B) Response of a pH sensor based on a mixture of 4 aza-BODIPY indicators immobilized into polyurethane hydrogel. Adapted from ref (505) with public license. Published by The Royal Society of Chemistry. (C) Response of the nanosensors containing covalently embedded individual indicators (fluorescein FS, Oregon green OG) and their mixture (OG-FS) along with rhodamine reference dye. Adapted with permission from ref (764). Copyright 2011 American Chemical Society. (D) Comparison of pH values obtained with the smartphone photographing the fluorescence of a sensor strip (array of 10 BODIPY indicators) and a conventional pH glass electrode. Adapted with permission from ref (135). Copyright 2017 American Chemical Society.
Figure 47
Figure 47
Examples of the planar optodes and fiber-optic sensors. (A) Preparation of a planar optode by knife-coating of a sensor “cocktail” (indicator, polymer, organic solvents, and optionally some additives) onto a transparent poly(ethylene terephthalate) support. (B) Planar sensor spot glued to the inner wall of a transparent glass vial. (C) Fiber-optic sensor manufactured by fixing a planar sensor spot of a small diameter (2 mm) onto a distal end of a plastic optical fiber. (D) Example of a flat-broken fiber-optic pH microsensor for simultaneous measurement of pH and pO2. The blue color of a 470 nm LED (used for the excitation), as well as red luminescence from the indicators is visible. Reprinted with permission from ref (381). Copyright 2007 American Chemical Society. (E) Example of a tapered fiber-optic sensor.
Figure 48
Figure 48
Schematic representation of an evanescent-field sensor (left) and its photographic image (right): 1, fiber core; 2, original cladding; 3, protective jacket; 4, typical propagation modes. Reproduced from ref (1020) with permission from Elsevier. Copyright Published by Elsevier, Ltd., 2004.
Figure 49
Figure 49
Schematic of a fiber optic sensor for measurement of refractive index by using surface plasmon resonance. The lower panel shows the flow system, including a syringe pump, a flow-through cell, and respective tubings. The upper panel shows an enlarged view of the SPR detection system. The swellable pH-responsive material can be placed on the gold film. The angle of reflection (Φi) depends on the RI of the polymer. Reprinted from ref (1036) with public license. Published by the Optical Society of America.
Figure 50
Figure 50
Schematic of a bioinspired photonic crystal based optical sensor for H values. The graph shows the typical chitosan structure of the wing of a butterfly that was coated with a synthetic copolymer that undergoes pH dependent swelling. This results in a change in the structural color of the wing. Reprinted with permission from ref (1064). Copyright American Chemical Society 2016.
Figure 51
Figure 51
Operating principle of a distributed sensor. (A) Schematic representation of the optical fiber modified with sol–gel layers containing immobilized aminoacridine (AA) and cresyl violet (CV). (B) Corresponding time-resolved emission profiles following pulsed laser excitation for a 9 m fiber. Reprinted with permission from ref (1084). Copyright American Chemical Society 1996.
Figure 52
Figure 52
Critical care analyzer developed by AVL Scientific Corporation: instrument (left) and disposable cartridge (right). Blood (60 μL) is injected via the Luer port and, then, passes the various optical sensors. The whole sensor kit is placed in a portable instrument for on-site use. The fluorescence of the sensor spots is read by a photodiode after photoexcitation with a blue LED. Reprinted with permission of The Royal Society of Chemistry from ref (1087). Copyright The Royal Society of Chemistry 2005. (B) Schematic cross-section of a multiparameter intravascular blood gas probe. Reproduced from ref (1103) with permission from BMJ Publishing Group, Ltd.
Figure 53
Figure 53
Luminescence imaging of pH during cutaneous wound healing. Upper row: Photographic images of the skin sites. Lower row: Respective pseudocolor images created with optical 2D pH sensors. Scale bars: 1 cm. Reprinted from ref (145) with public license. Published by the United States National Academy of Sciences.
Figure 54
Figure 54
(A) Changes of rhizosphere pH along the root axis in dark (left) and light (right) conditions. Reprinted by permission of Oxford University Press from ref (1140). Copyright Oxford University Press 2002. (B) Combined optical pH imaging and imaging of trace metals with DGT technique in Salix smithiana rhizosphere. The bars represent pH and average solute flux to the gel (in pg·cm–2·s–1) respectively. Adapted from ref (424) with public license. Published by Elsevier.
Figure 55
Figure 55
Examples of applications of optical pH sensors in oceanography and marine biology. (A) Stand-alone pH optode for oceanographic applications developed by Staudinger and co-workers. Reprinted from ref (537) with public license. Published by Wiley Periodicals, Inc., on behalf of Association for the Sciences of Limnology and Oceanography. (B) Imaging of pH distribution with planar optode and an RGB camera. The pseudocolor image shows the elevated values around a 2 day old burrow of the polychaete Hediste diversicolor. Reprinted from ref (374) with public license. Published by Frontiers. (C) Photograph of cross-section of didemnid ascidian Lissoclinum patella containing symbiotic cyanobacterium Prochloron (left) and pseudocolor images of the pH distribution in L. patella before and under irradiation with visible light (incident photon irradiance of 250 μmol photons m–2 s–1). Reprinted from ref (1152) with public license. Published by the Association for the Sciences of Limnology and Oceanography, Inc., 2011.
Figure 56
Figure 56
(A) Simultaneous monitoring of pH, carbon dioxide, and oxygen with a fiber-optic multiparameter sensor during fermentation of beer. Reprinted from ref (429) with permission from Elsevier. Copyright Elsevier B.V. 1997. (B) Photograph of a 24-channel SensorDish reader from PreSens on a shaker (left) and cross-section of a well of a microplate with the sensor in its bottom. Reprinted with permission from ref (93) Copyright Wiley Periodicals, Inc., 2008. (C) Scheme for the preparation of a sprayable sensor using a thermogelating hydrogel and its application. Reprinted from ref (127) with permission from Elsevier. Copyright Elsevier B.V. 2015.
Figure 57
Figure 57
Chemical formula of representative lipophilic pH indicators for use in sensors for pH values and ions.
Figure 58
Figure 58
Examples of optical pH sensors integrated into microfluidic devices. (A) pH response of sol–gel immobilized fluorescein in microfluidic channels of a patterned fluidic system. Reprinted by permission from Springer Nature from ref (1212). Copyright Springer Nature 2000. (B) Absorptiometric sensing with polyaniline nanofibers integrated into microfluidic channels of a flexible chip. Adapted with permission of The Royal Society of Chemistry from ref (1213). Copyright The Royal Society of Chemistry 2013. Permission conveyed through Copyright Clearance Center, Inc. (C) Fluorescence images of ratiometric pH sensor spots exposed to different pH. Adapted from ref (1195) with permission from Elsevier. Copyright Elsevier B.V. 2004. (D) Fluorescence image of a chip for isoelectric focusing with integrated pH layer. Adapted with permission of The Royal Society of Chemistry from ref (988). Copyright The Royal Society of Chemistry 2013. Permission conveyed through Copyright Clearance Center, Inc. (E) Simultaneous pH gradient observation and separation of fluorescently labeled proteins lactalbumin (La), lactoglobulic (Lg), and myoglobin (My). Adapted from ref (588) with public license. Published by The Royal Society of Chemistry.
Figure 59
Figure 59
Examples of pH imaging in concrete samples. (A) Pseudocolor images of pH distribution in cement paste specimens at various degrees of carbonation Adapted from ref (333) with permission from Elsevier. Copyright Elsevier, Ltd., 2017. The sensing composition containing a highly viscous solution of an absorptiometric indicator in a mixture of polymers and surfactants was spread over the concrete surface. (B) pH imaging with a planar optode in concrete specimen previously exposed to accelerated carbonation. (B-A) pH image of the sample recorded with t-DLR imaging technique. (B-B) Photographic image of the concrete surface used for pH imaging. (B-C) Combined image of B-A and B-B including reference pH measurements using a flat surface electrode. Reprinted from ref (997) with permission from Elsevier. Copyright Elsevier Ltd. 2018.

Similar articles

Cited by

References

    1. Prichard F. E.; Lawn R.; Royal Society of Chemistry (Great Britain) . Measurement of pH: A Practical Handbook; Royal Society of Chemistry: London, 2003.
    1. Wolfbeis O. S.Fiber Optic Chemical Sensors and Biosensors, Vol. 1 and 2; Wolfbeis O. S., Ed.; CRC Press: Boca Raton, FL, 1991.
    1. Wencel D.; Abel T.; McDonagh C. Optical Chemical pH Sensors. Anal. Chem. 2014, 86, 15–29. 10.1021/ac4035168. - DOI - PubMed
    1. Shi W.; Li X.; Ma H. Fluorescent Probes and Nanoparticles for Intracellular Sensing of pH Values. Methods Appl. Fluoresc. 2014, 2, 04200110.1088/2050-6120/2/4/042001. - DOI - PubMed
    1. Lian Y.; Zhang W.; Ding L.; Zhang X.; Zhang Y.; Wang X.. Chapter 8: Nanomaterials for Intracellular pH Sensing and Imaging. In Novel Nanomaterials for Biomedical, Environmental and Energy Applications; Wang X., Chen X., Eds.; Elsevier, 2019; pp 241–273.

Publication types