. 2020 Dec 17;80(6):996-1012.e9.
doi: 10.1016/j.molcel.2020.10.012. Epub 2020 Nov 3.

Two Aldehyde Clearance Systems Are Essential to Prevent Lethal Formaldehyde Accumulation in Mice and Humans

Affiliations

Two Aldehyde Clearance Systems Are Essential to Prevent Lethal Formaldehyde Accumulation in Mice and Humans

Felix A Dingler et al. Mol Cell. .

Abstract

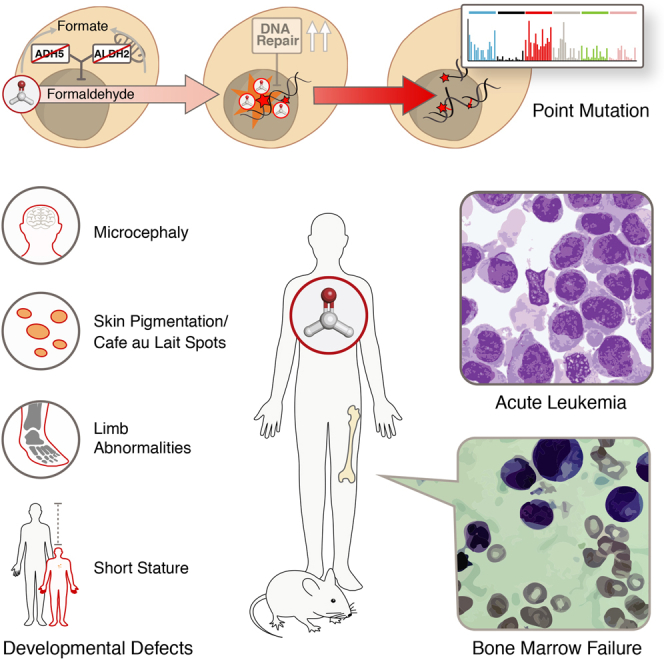
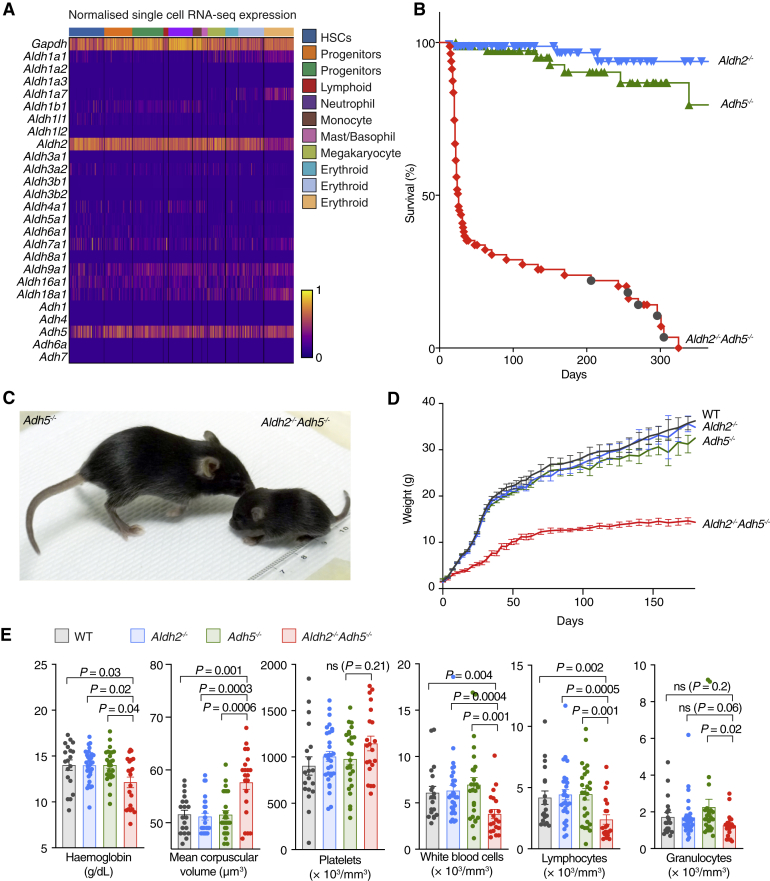
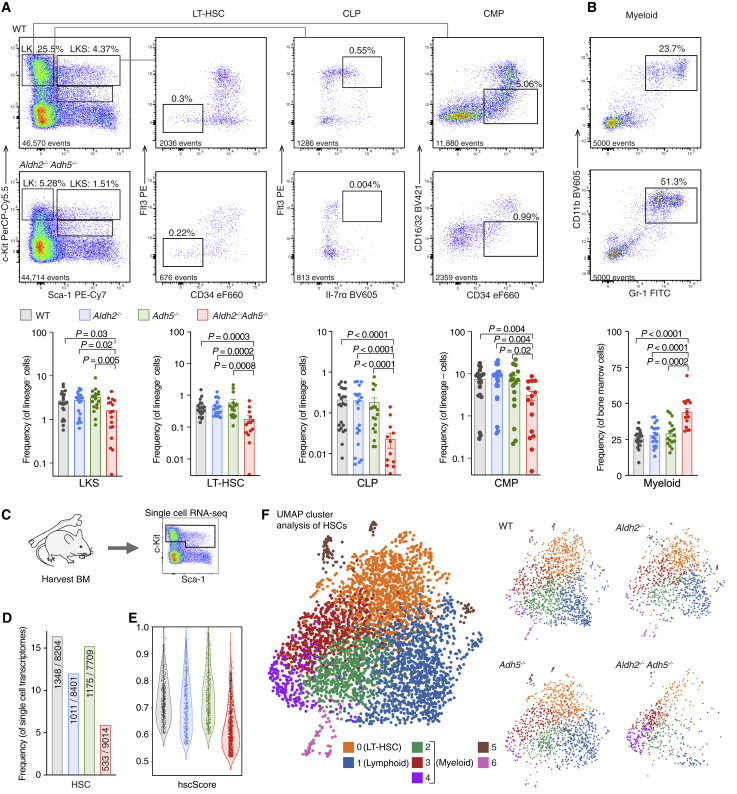
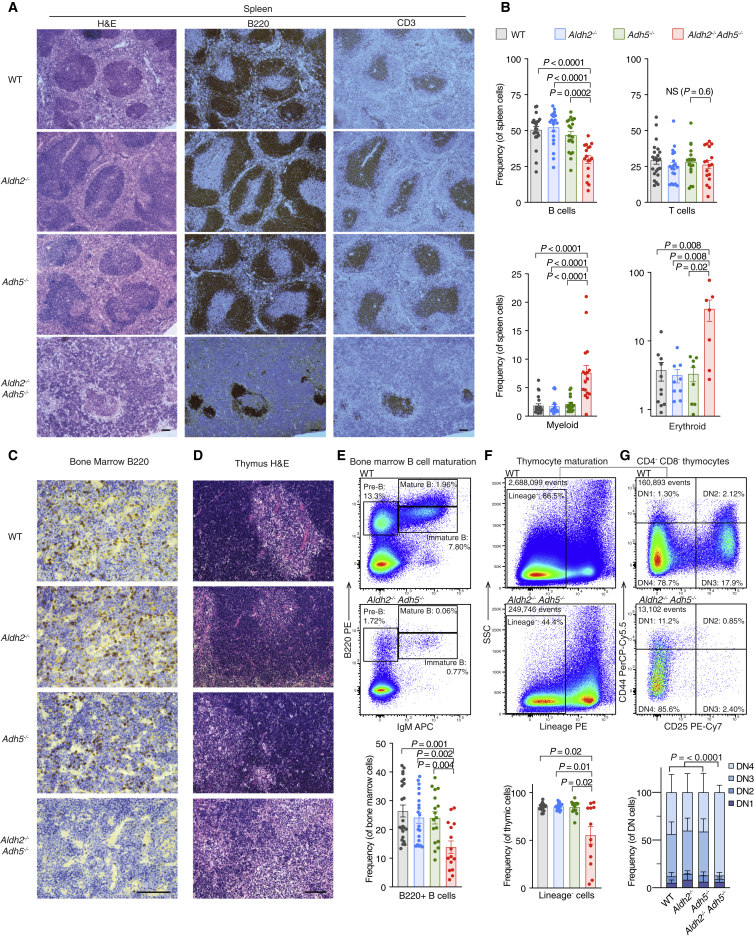
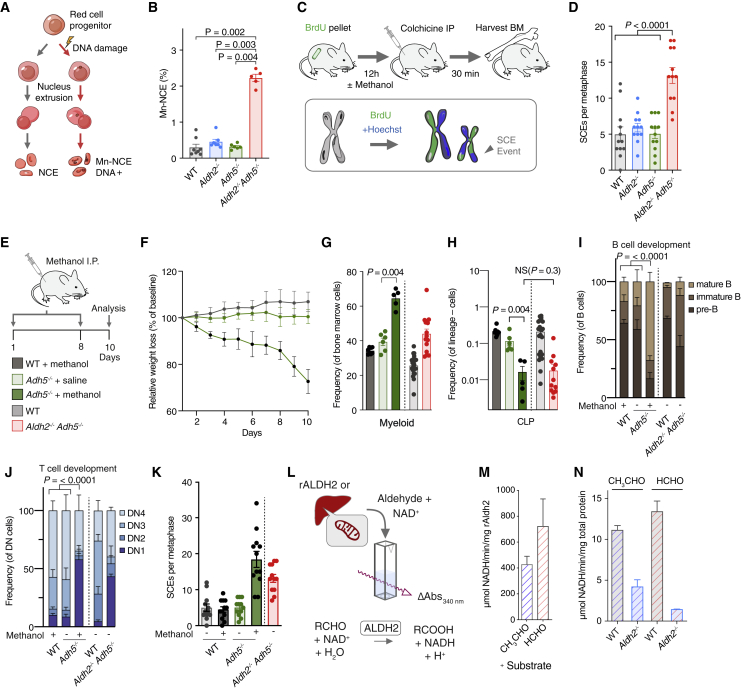
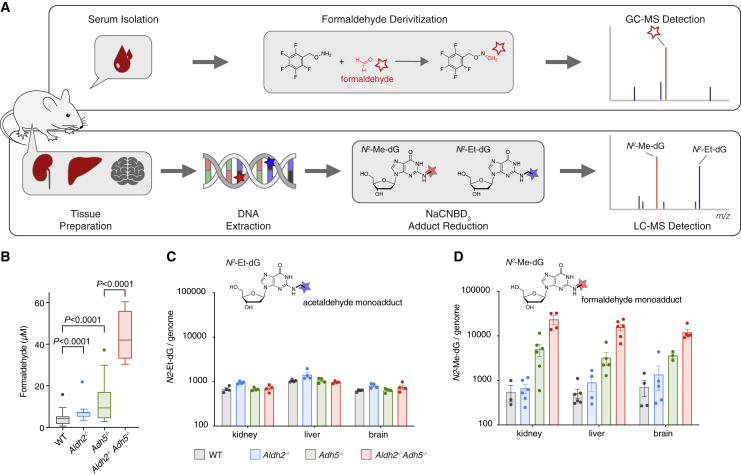
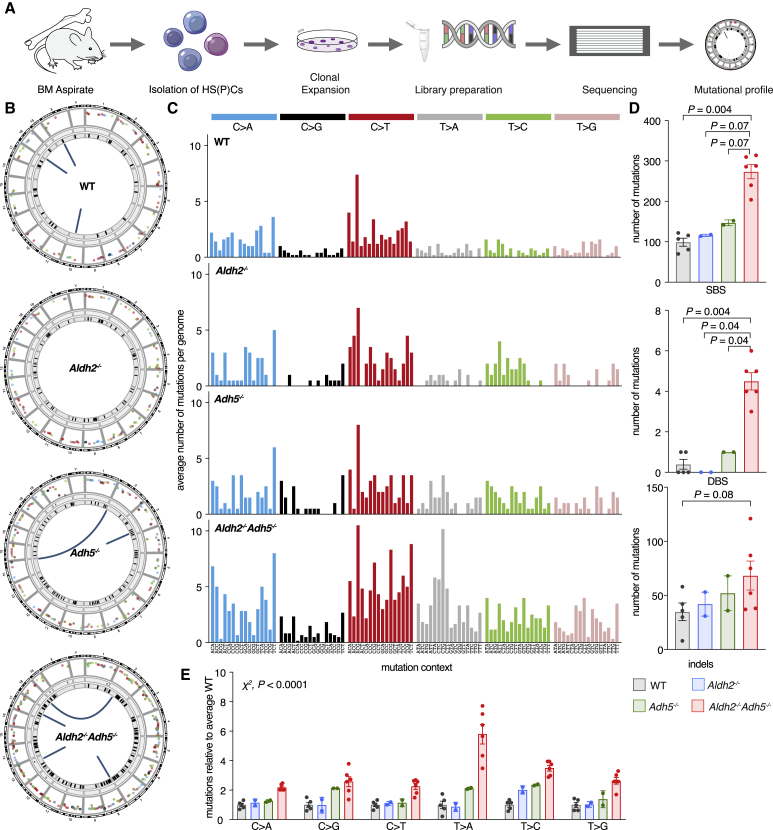
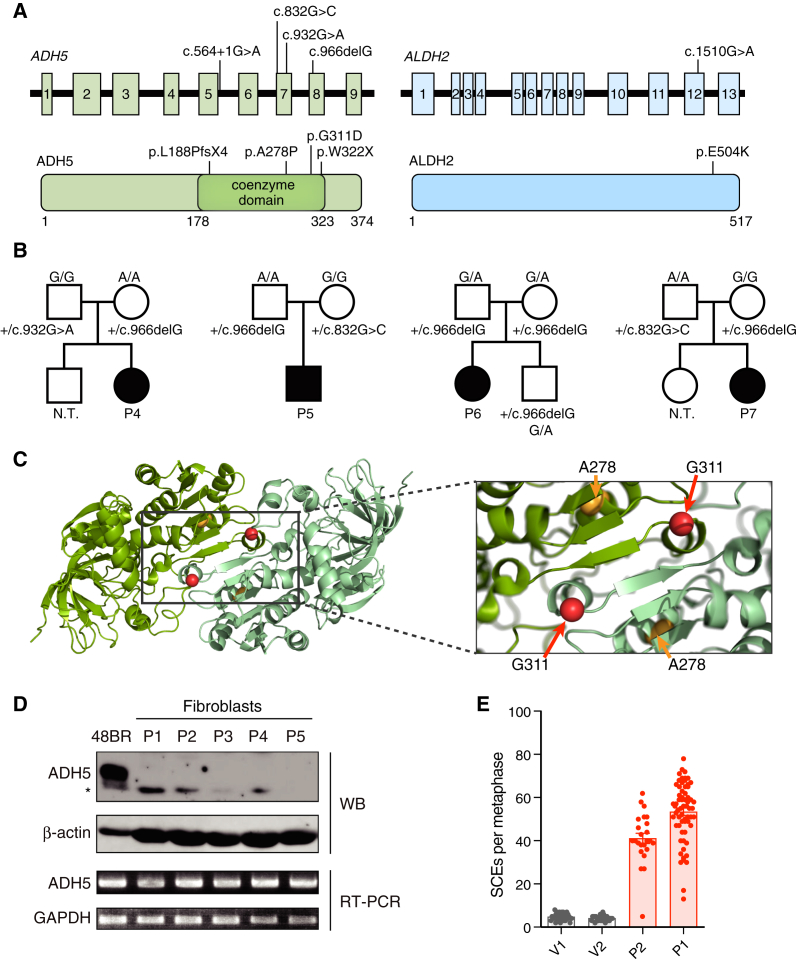
Reactive aldehydes arise as by-products of metabolism and are normally cleared by multiple families of enzymes. We find that mice lacking two aldehyde detoxifying enzymes, mitochondrial ALDH2 and cytoplasmic ADH5, have greatly shortened lifespans and develop leukemia. Hematopoiesis is disrupted profoundly, with a reduction of hematopoietic stem cells and common lymphoid progenitors causing a severely depleted acquired immune system. We show that formaldehyde is a common substrate of ALDH2 and ADH5 and establish methods to quantify elevated blood formaldehyde and formaldehyde-DNA adducts in tissues. Bone-marrow-derived progenitors actively engage DNA repair but also imprint a formaldehyde-driven mutation signature similar to aging-associated human cancer mutation signatures. Furthermore, we identify analogous genetic defects in children causing a previously uncharacterized inherited bone marrow failure and pre-leukemic syndrome. Endogenous formaldehyde clearance alone is therefore critical for hematopoiesis and in limiting mutagenesis in somatic tissues.

Keywords: DNA damage; ageing; bone marrow failure; cancer; formaldehyde; hematopoiesis; hematopoietic stem cells; immunodeficiency; mutagenesis; oncometabolite.


Conflict of interest statement

Declaration of Interests The authors declare no competing interests.

Figures

None
Graphical abstract
Figure 1
Figure 1
Postnatal Lethality, Stunted Growth, and Cancer Predisposition in Aldh2−/−Adh5−/− Mice (A) Gene expression analysis of Aldh and Adh gene families by scRNA-seq in WT bone marrow progenitor cells (Lin c-Kit+ Sca-1+). The colored bar at the top represents the assigned lineage of cell transcriptomes. (B) Kaplan-Meier survival curve of Aldh2−/−, Adh5−/−, and Aldh2−/−Adh5−/− mice (n = 166, 89, 67). Dark gray circles indicate cancer deaths. (C) Photograph of Aldh2−/−Adh5−/− mouse (right) and its littermate Adh5−/− control (left). (D) Total body mass as mean ± SEM of WT, Aldh2−/−, Adh5−/−, and Aldh2−/−Adh5−/− mice (initial n = 35, 58, 60, 16). (E) Blood parameters in Aldh2−/−Adh5−/− mice with controls (mean ± SEM; n = 21, 30, 26, 19, left to right). The p values were determined by two-tailed Mann-Whitney U test. See also Figure S1 and Table S1.
Figure 2
Figure 2
Disrupted Aldehyde Catabolism Compromises Hematopoiesis (A and B) Representative flow cytometry plots from Aldh2−/−Adh5−/− and WT mice showing bone marrow LK, LKS, LT-HSC, CLP, and CMP (A) and myeloid populations (B). Bottom: quantification of the respective populations assessed by flow cytometry in 2- to 30-week-old Aldh2−/−Adh5−/− mice with age-matched controls (mean ± SEM; n = 24, 20, 17, 17, left to right). (C) scRNA-seq analysis of HSPCs from a 6-week-old female Aldh2−/−Adh5−/− mouse with age- and sex-matched controls. (D) Fraction of single-cell transcriptomes assigned to the HSC cell identity (numerator) from total transcriptomes analyzed (denominator). (E) hscScore analysis of single-cell transcriptomes identified as HSCs. (F) UMAP visualization of HSC transcriptomes colored by cluster. On the left, all 4 genotypes are superimposed; on the right, individual genotypes are shown separately to highlight variation in distribution between the clusters. The p values were determined by two-tailed Mann-Whitney U test. See also Figures S2 and S3 and Tables S2 and S5.
Figure 3
Figure 3
Aldehyde Catabolism Is Essential for Lymphoid Development (A) Spleen histology (hematoxylin and eosin [H&E stain]) and immunohistochemistry for B220 or CD3. (B) Quantification of splenic B, T, myeloid, and erythroid precursors assessed by flow cytometry (n = 23, 20, 19, 17, left to right). (C) Bone marrow immunohistochemistry for B220. (D) Thymus histology (H&E stain). (E) Representative flow cytometry plots showing bone marrow B cell development and quantification of total B220+ cells (mean ± SEM; n = 23, 20, 19, 15, left to right). (F and G) Representative flow cytometry plots and quantification of the thymic Lin population (F) and Lin CD4 CD8 (DN) populations defined by CD44 and CD25 expression (G). Mice analyzed for thymic Lin populations were 2–30 weeks old (n = 23, 20, 19, 15, left to right). Mice analyzed for thymic DN populations were older than 30 weeks (n = 7, 7, 5, 5 mice, left to right). All bar graphs are shown with mean ± SEM. The p values were determined by two-tailed Mann-Whitney U test except for (G), where pairwise χ2 tests of average distributions were performed. Scale bars indicate 100 μm. See also Figures S2 and S3.
Figure 4
Figure 4
DNA Damage in Aldh2−/−Adh5−/− Mice and Methanol Challenge of Adh5−/− Mice Phenocopies the Double Mutant (A) Scheme of the micronucleus assay. (B) Micronuclei in Aldh2−/−Adh5−/− mice and controls. (mean ± SEM, n = 8, 7, 6, 5, left to right). (C) SCE analysis in bone marrow cells. (D) Quantification of SCE in Aldh2−/−Adh5−/− mice and controls. (mean ± SEM, n = 12 metaphases per group). (E) Treatment of mice with intraperitoneal methanol injection. (F) Percentage of weight loss relative to baseline weight on day 0 (mean ± SD, n = 10; WT + methanol, 6; Adh5−/− + saline and 6; Adh5−/− + methanol). (G and H) Frequency of bone marrow myeloid (CD11b+ Gr-1+) and CLP cells (mean ± SEM, n = 8, 6, 5, left to right). (I and J), Frequency of bone marrow B cell (pre-B, immature and mature) and thymus DN populations (DN1–DN4) (mean and SEM; n = 8, 6, 5 mice, left to right). (K) Quantification of SCEs of methanol-treated mice and controls. n = 12 metaphases per group. (L) ALDH activity assays on recombinant ALDH2 (rALDH2) or mitochondrial extracts from WT or Aldh2−/− liver. (M and N) ALDH activity performed with acetaldehyde (CH3CHO) and formaldehyde (HCHO) substrates using rALDH2 (M); WT and Aldh2−/− liver mitochondrial extract (N). Activity is expressed as micromolar NADH per minute per milligram of total protein (mean and SD; n = 2). The p values were determined by two-tailed Mann-Whitney U test, except for (I) and (J), where pairwise χ2 tests of average distributions were performed. See also Figures S3 and S4.
Figure 5
Figure 5
Aldh2 and Adh5 Act to Suppress Blood Formaldehyde Levels and Its DNA Adduct in Tissues (A) Scheme of formaldehyde quantification in serum and as DNA adduct in tissues. (B) Serum levels of formaldehyde (n = 43, 20, 51, 4, left to right). Boxes with lines indicate quartiles and median, and Tukey whiskers extend to 1.5 interquartile ranges. Two-tailed Mann-Whitney U test. (C) Determination of the reduced genomic AA-deoxyguanine adduct N2-ethyl-deoxyguanosine from kidneys, liver, and brain (mean ± SEM; n = 4 per group). (D) Determination of the reduced genomic formaldehyde-deoxyguanine adduct N2-methyl-deoxyguanosine from mouse kidneys, liver, and brain (mean ± SEM; n = 3–6 per group). See also Figure S5.
Figure 6
Figure 6
Formaldehyde-Accumulating Aldh2−/−Adh5−/− Mice Reveal a Mutation Signature (A) Whole-genome sequencing of HSPCs. (B) Circos plots highlighting the different types and levels of mutations from a representative Aldh2−/−Adh5−/− mouse and controls. The outermost ring represents each chromosome, followed by sequential rings highlighting single-base substitutions (SBSs) as a rainfall plot (color-coding of substitution types as in C), tandem base substitutions (DBSs), and insertions or deletions (indels). Chromosomal rearrangements are represented by lines linking the translocated chromosomes at the center. (C) Aggregated mutational profile of SBSs in HSPC genomes. Each mutation is assigned to the pyrimidine base of the originating base pair; within each of the 6 main mutation types, the sequence context of 5′ and 3′ flanking bases is shown in alphabetical order. (D) Frequency of SBSs, DBSs, and indels (mean ± SEM; number of HSPC genomes analyzed = 5, 2, 2, 6 from left to right; two-tailed Mann-Whitney U test). (E) Relative mutation number at each base, normalized to the average HSPC clone from WT litter-matched 40-week-old animals (mean ± SEM; n = 5, 2, 2, 6 from left to right; χ2 test comparing the aggregate number of mutations of each type between the WT and Aldh2−/−Adh5−/−). See also Figure S6.
Figure 7
Figure 7
Human Patients with Bone Marrow Failure Syndrome Caused by Inactivating Mutations in ALDH2 and ADH5 (A) Location of mutations in the ADH5 and ALDH2 genes (top) and proteins (bottom). (B) Family pedigree of patients P4–P7. All parents were heterozygous for ADH5 mutations and reported to be healthy regardless of ALDH2 genotype. N.T., not tested. (C) Localization of missense mutations near the ADH5 dimer interface. (D) ADH5 gene expression in fibroblasts from patients P1–P5 by protein and RNA. An asterisk denotes a non-specific band recognized by the antibody. (E) SCEs per metaphase (mean ± SEM) in patient-derived, PHA-stimulated lymphoblasts (P1 and P2) and two unrelated ALDH21/2 heterozygous volunteers (V1 and V2). See also Figure S7.

Comment in

References

    1. Alexandrov L.B., Jones P.H., Wedge D.C., Sale J.E., Campbell P.J., Nik-Zainal S., Stratton M.R. Clock-like mutational processes in human somatic cells. Nat. Genet. 2015;47:1402–1407. - PMC - PubMed
    1. Alexandrov L.B., Kim J., Haradhvala N.J., Huang M.N., Tian Ng A.W., Wu Y., Boot A., Covington K.R., Gordenin D.A., Bergstrom E.N., PCAWG Mutational Signatures Working Group; PCAWG Consortium The repertoire of mutational signatures in human cancer. Nature. 2020;578:94–101. - PMC - PubMed
    1. Beane Freeman L.E., Blair A., Lubin J.H., Stewart P.A., Hayes R.B., Hoover R.N., Hauptmann M. Mortality from lymphohematopoietic malignancies among workers in formaldehyde industries: the National Cancer Institute Cohort. J. Natl. Cancer Inst. 2009;101:751–761. - PMC - PubMed
    1. Blokzijl F., de Ligt J., Jager M., Sasselli V., Roerink S., Sasaki N., Huch M., Boymans S., Kuijk E., Prins P. Tissue-specific mutation accumulation in human adult stem cells during life. Nature. 2016;538:260–264. - PMC - PubMed
    1. Bluteau O., Sebert M., Leblanc T., Peffault de Latour R., Quentin S., Lainey E., Hernandez L., Dalle J.-H., Sicre de Fontbrune F., Lengline E. A landscape of germ line mutations in a cohort of inherited bone marrow failure patients. Blood. 2018;131:717–732. - PubMed

Publication types

MeSH terms