. 2021 Jan 7;184(1):92-105.e16.
doi: 10.1016/j.cell.2020.10.030. Epub 2020 Oct 24.

Identification of Required Host Factors for SARS-CoV-2 Infection in Human Cells

Affiliations

Identification of Required Host Factors for SARS-CoV-2 Infection in Human Cells

Zharko Daniloski et al. Cell. .

Abstract

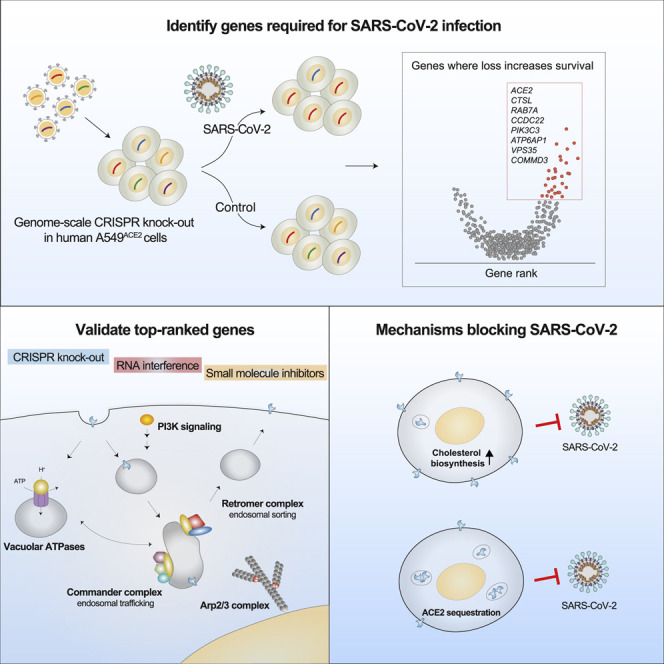
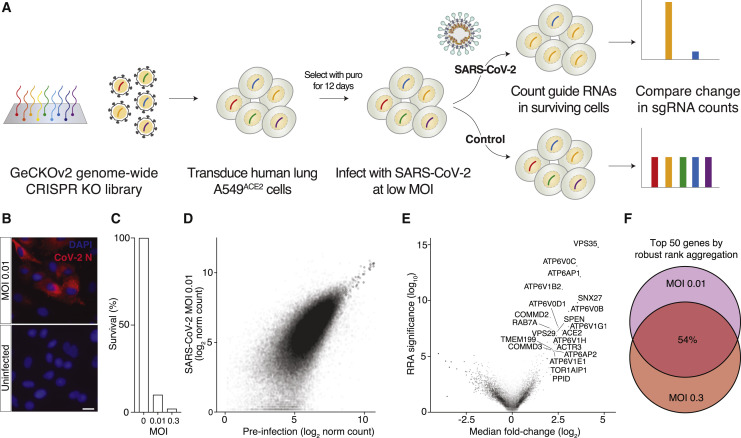
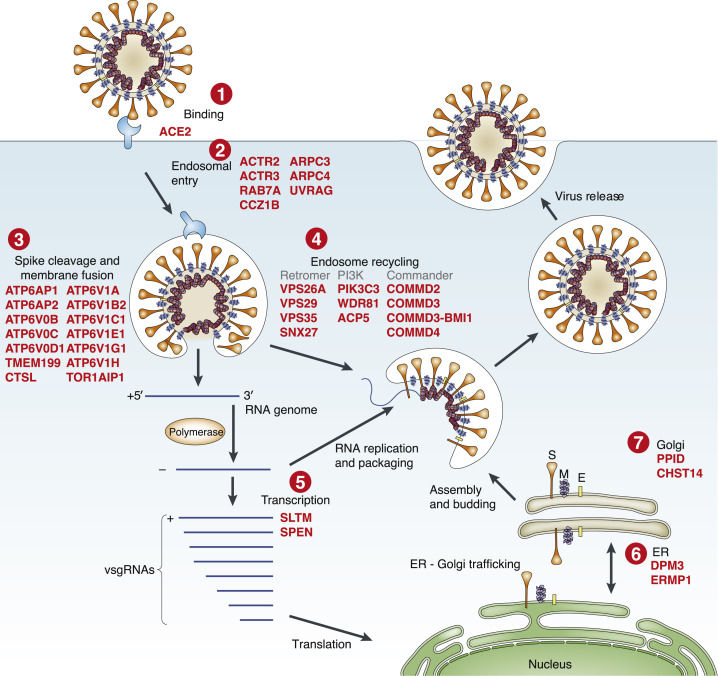
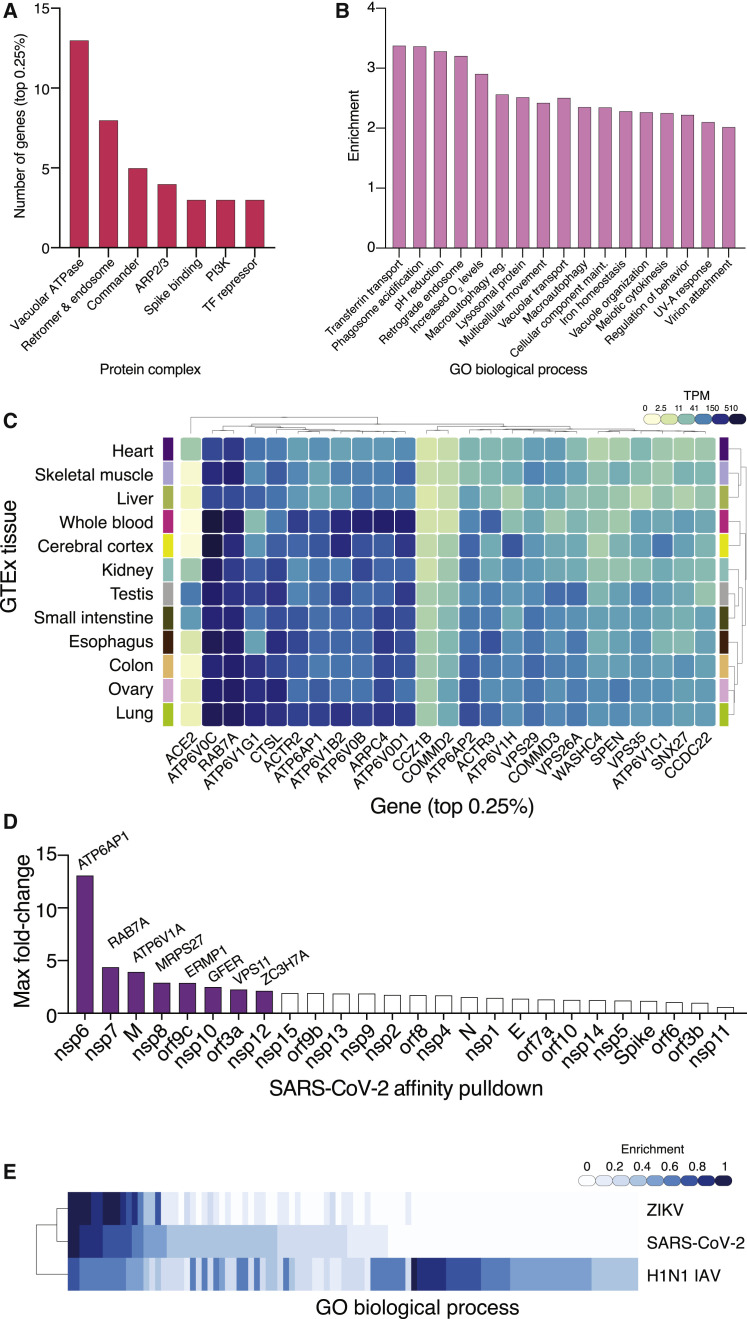
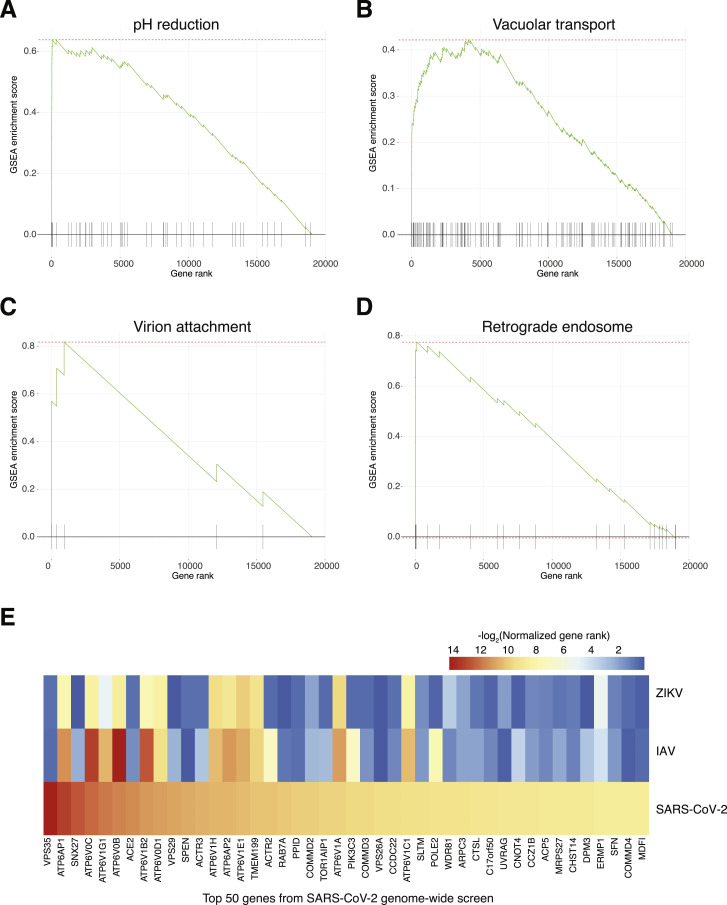
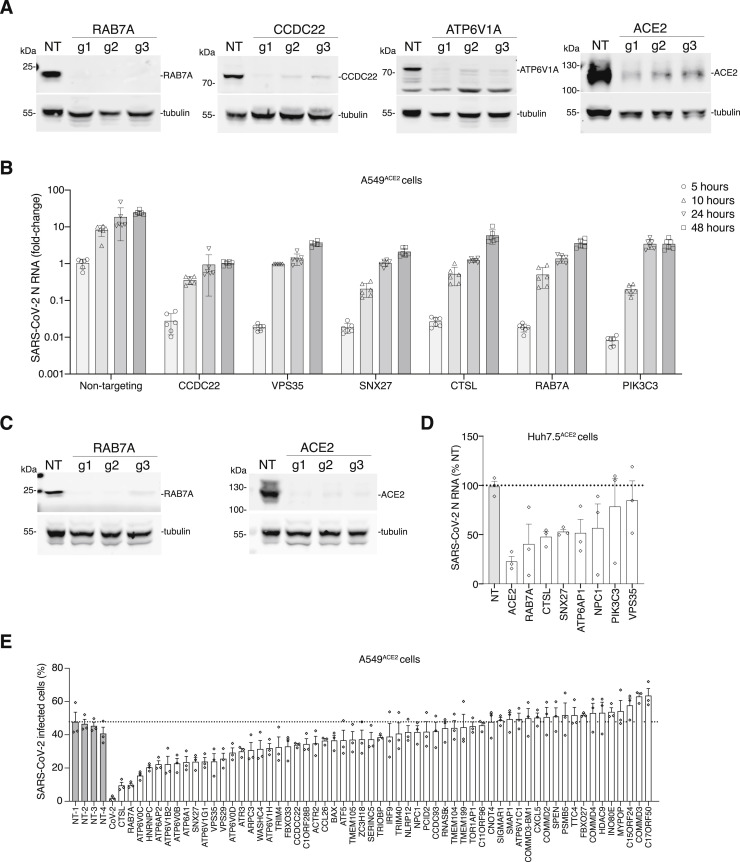
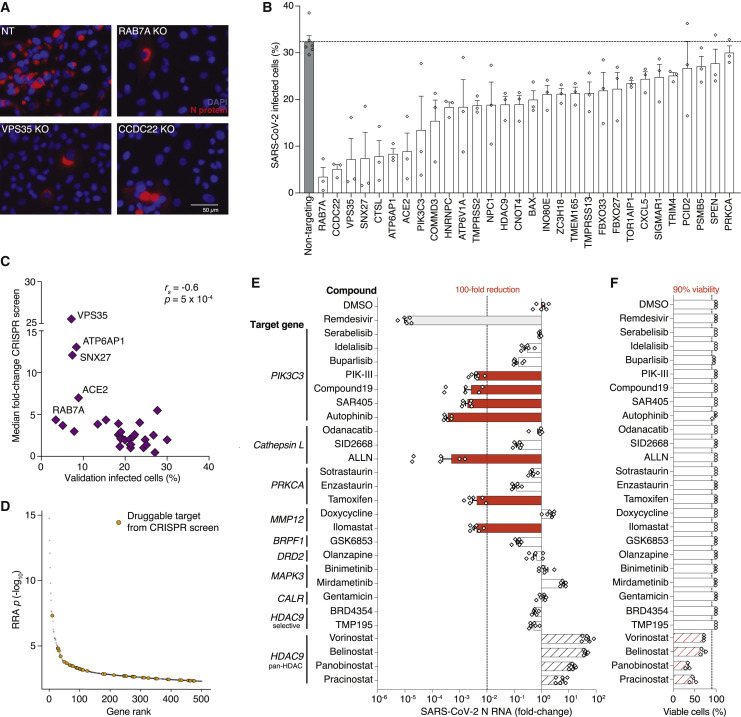
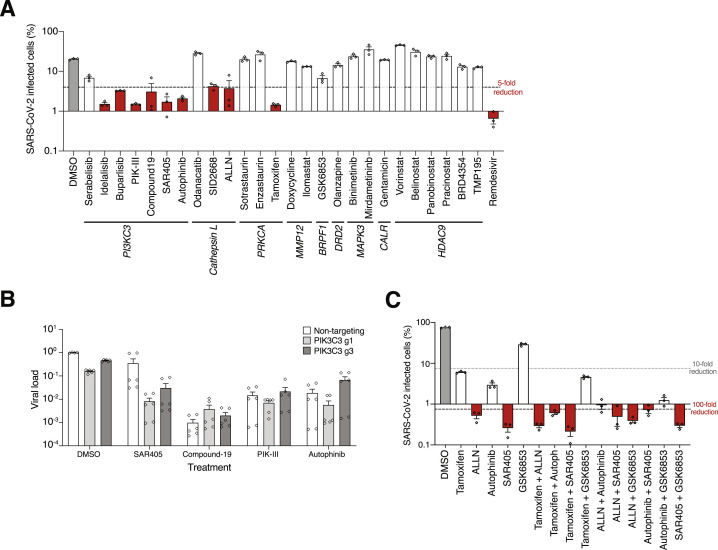
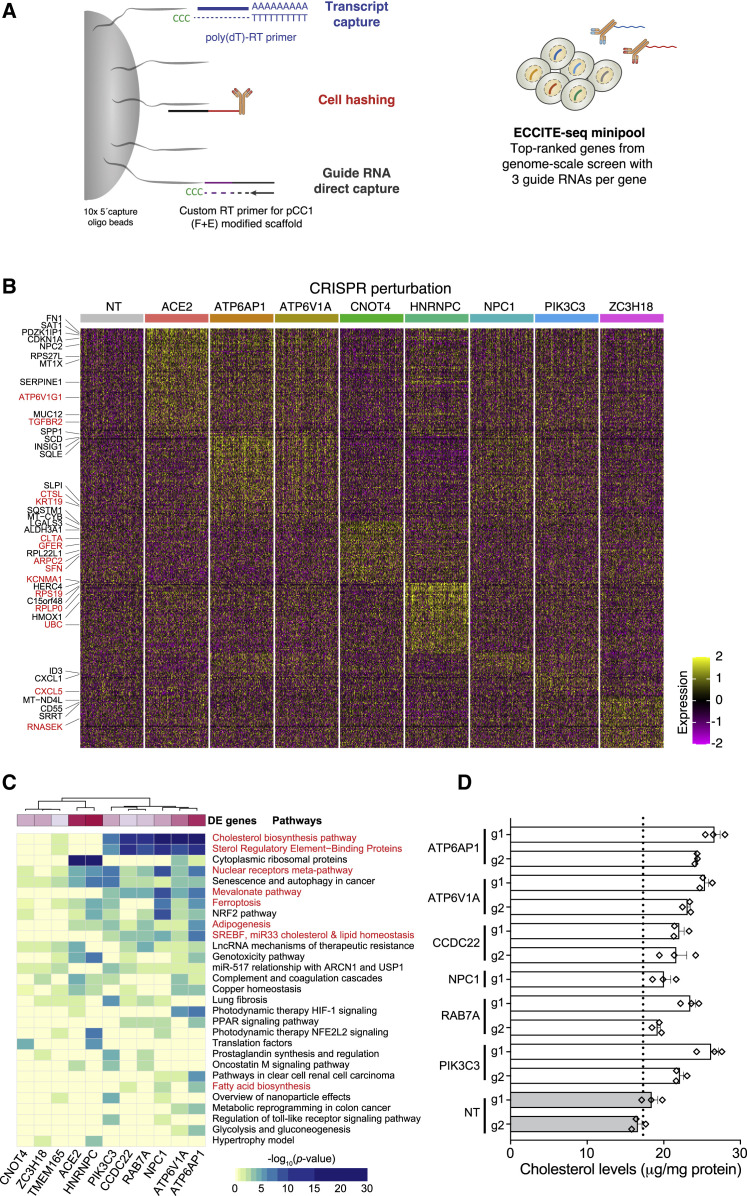
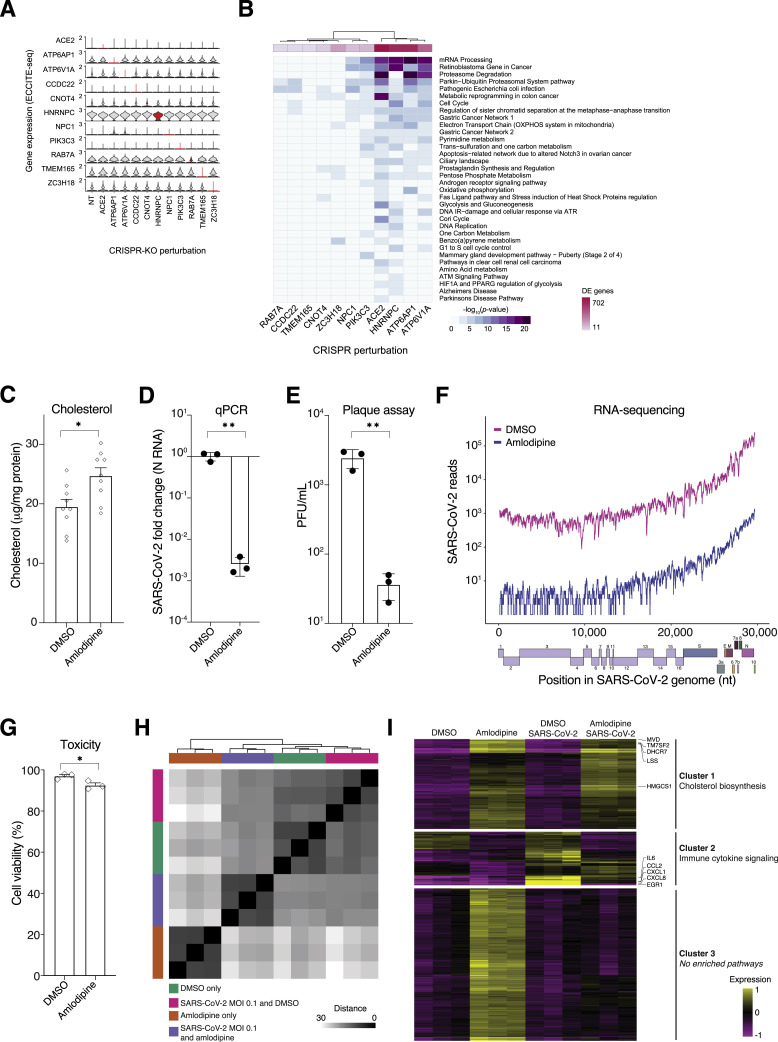
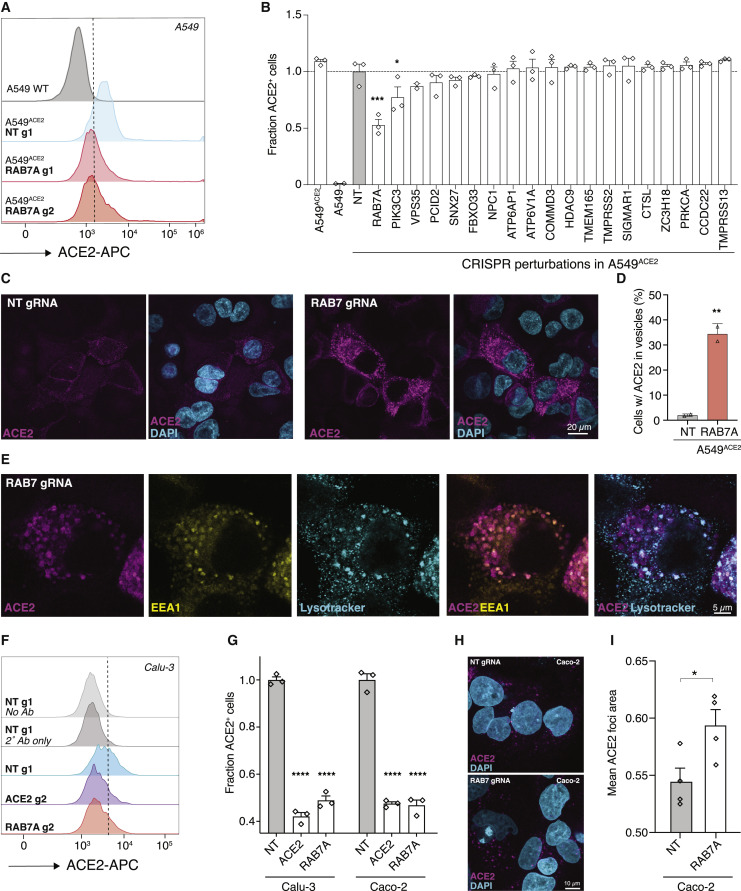
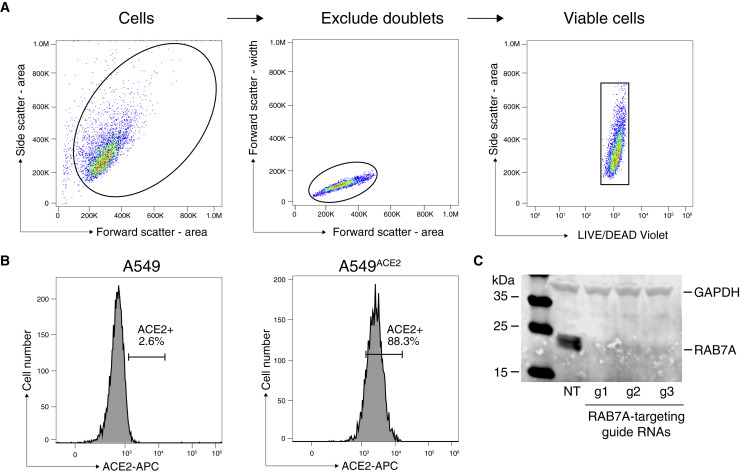
To better understand host-virus genetic dependencies and find potential therapeutic targets for COVID-19, we performed a genome-scale CRISPR loss-of-function screen to identify host factors required for SARS-CoV-2 viral infection of human alveolar epithelial cells. Top-ranked genes cluster into distinct pathways, including the vacuolar ATPase proton pump, Retromer, and Commander complexes. We validate these gene targets using several orthogonal methods such as CRISPR knockout, RNA interference knockdown, and small-molecule inhibitors. Using single-cell RNA-sequencing, we identify shared transcriptional changes in cholesterol biosynthesis upon loss of top-ranked genes. In addition, given the key role of the ACE2 receptor in the early stages of viral entry, we show that loss of RAB7A reduces viral entry by sequestering the ACE2 receptor inside cells. Overall, this work provides a genome-scale, quantitative resource of the impact of the loss of each host gene on fitness/response to viral infection.

Keywords: COVID-19; CRISPR; Cas9; ECCITE-seq; SARS-CoV-2; cholesterol; endosome; genome-wide screen; human lung; loss of function.


Conflict of interest statement

Declaration of Interests N.E.S. is an advisor to Vertex. T.L. is a member of the scientific advisory boards of Goldfinch Bio and, with equity, Variant Bio. The New York Genome Center and New York University have applied for patents relating to the work in this article.

Figures

None
Graphical abstract
Figure 1
Figure 1
A Genome-Scale CRISPR Loss-of-Function Screen to Identify Genes that Prevent SARS-CoV-2 Infection of Human Alveolar Epithelial Carcinoma Cells (A) Overview of the genome-scale loss-of-function screen for host factors in human A549ACE2 cells requires for SARS-CoV-2 infection. (B) Immunofluorescence of SARS-CoV-2 nucleocapsid (N) protein and DAPI labeling of human A549ACE2 cells at 24 h post-infection. (C) Percent survival of human A549ACE2 cells transduced with the GeCKOv2 library with the indicated SARS-CoV-2 viral amount (MOI) at 6 days post-infection. (D) Scatterplot of guide RNA read counts from A549ACE2 cells at 6 days post-infection with SARS-CoV-2 (MOI ~0.01) versus cells prior to infection. Read counts are normalized log2 reads. (E) Volcano plot of median fold-change of guide RNAs for each gene and log10 robust rank aggregation (RRA) p values. All genes with |fold-change| > 4 and RRA p < 10−3 are labeled. (F) Overlap of top 50 ranked genes between the MOI 0.01 and MOI 0.3 screen. See also Figure S1 and Table S1.
Figure S1
Figure S1
Genome-wide Loss-of-Function CRISPR Screen Enriched Gene Identification, Related to Figure 1 (A) Scatterplot of guide RNA read counts from A549ACE2 cells at 3 days post-transduction with the GeCKOv2 library versus read counts from the library plasmid. Read counts ar4e normalized log2 reads. (B) RRA p-value distribution for all genes in the GeCKOv2 library. (C) Overlap of top-ranked (top 500) genes between 3 different analysis methods (RRA, RIGER, and SBR). 142 genes are found by all 3 methods. (D) Comparison of top-ranked genes between different genome-scale CRISPR screens for SARS-CoV-2 infection.
Figure 2
Figure 2
Top-Ranked Genes from the CRISPR Screen Are Involved in Key Elements of the SARS-CoV-2 Viral Life Cycle Schematic of SARS-CoV-2 docking, entry, RNA genome release and transcription, and virion replication, assembly, and release with top-ranked host genes from the CRISPR screen highlighted in red. All genes shown are ranked in the top 50 genes (top ~0.25% of library) in the low MOI CRISPR screen using RRA. Adapted from Du et al. (2009). See also Figure S2 and Table S2.
Figure 3
Figure 3
Enriched Genes Cluster into Related Pathways, Are Expressed Broadly, Interact Directly with Viral Proteins, and Are Also Involved in Viral Pathogenesis of Pandemic Flu and Zika Virus (A) Classification of genes shown in Figure 2 (top-ranked ~0.25% of the GeCKOv2 library) into specific complexes. (B) Gene set enrichment analysis normalized enrichment scores for all significant (FDR q < 0.1) Gene Ontology (GO) biological processes. (C) Expression of top-ranked genes (same as in A) across the indicated human tissues from GTEx v8. Gene expression color scale is transcripts per million (TPM). (D) RRA fold-change for the low MOI CRISPR screen for the high-confidence protein-protein interaction with the maximum fold-change for each viral gene from the Gordon et al. (2020) mass spectrometry dataset. (E) Clustering of top-ranked GO biological processes for CRISPR screens for Zika virus ZIKV (Li et al., 2019), H1N1 pandemic avian influenza IAV (Li et al., 2020), and SARS-CoV-2 (this study). See also Figure S2 and Table S2.
Figure S2
Figure S2
Gene Set Enrichment and Overlap of Top-Ranked Genes with Other Viral Infections, Related to Figures 2 and 3 (A) – (D) Four of the significant (FDR < 0.1) top-ranked GO biological process terms and the fold-change ranks of their genes in the SARS-CoV-2 low MOI CRISPR screen. (E) Normalized gene ranks of the top 50 genes from the SARS-CoV-2 low MOI CRISPR screen and genome-scale CRISPR screens for Zika virus (ZIKV) and H1N1 avian influenza (IAV).
Figure S3
Figure S3
Validation of Top-Ranked Genes Using CRISPR Perturbations and RNA Interference, Related to Figure 4 (A) western blot analysis of RAB7A, CCDC22, ATP6V1A, and ACE2 after transduction of A549ACE2 with the indicated CRISPR guide RNA and selection with puromycin for 7 days. For validation, we designed 3 independent guide RNAs per gene (i.e., distinct guide RNAs from those in the GeCKOv2 library). Beta tubulin was used as loading control. (B) Quantitative PCR (qPCR) of SARS-CoV-2 viral load present in A549ACE2 CRISPR-perturbed cells infected with SARS-CoV-2 at MOI of 0.1. The qPCR was performed on cells collected at the indicated time (hours) post-infection (hpi) (n = 6 biological replicates, error bars indicate s.e.m.). (C) western blot analysis of RAB7A and ACE2 after transduction of Huh7.5ACE2 with the indicated CRISPR guide RNA and selection with puromycin for 7 days. For validation, we designed 3 independent guide RNAs per gene (i.e., distinct guide RNAs from those in the GeCKOv2 library). Beta tubulin was used as loading control. (D) qPCR of SARS-CoV-2 viral load present in Huh7.5ACE2 CRISPR-perturbed cells infected with SARS-CoV-2 at MOI of 0.1. The qPCR was performed on cells collected and fixed at 36 h.p.i (n = 3 guide RNAs with 6 biological replicates each, error bars indicate s.e.m.). (E) Immunofluorescence quantification of SARS-CoV-2 N protein at 36 hours post-infection (hpi) at MOI 0.1 in A549ACE2 cells pretreated with siRNA pools for 48 hours (n = 3 technical replicates, error bars represent s.e.m., NT indicates non-targeting controls).
Figure 4
Figure 4
Arrayed Validation of Genome-Scale SARS-CoV-2 Screen and Identification of Druggable Gene Targets (A) Representative immunofluorescence images of A549ACE2 knockout lines infected with SARS-CoV-2 at MOI of 0.1 and fixed 36 h post-infection (hpi). SARS-CoV-2 N protein is shown in red and DAPI in blue. (B) Quantification of SARS-CoV-2 infected A549ACE2 knockout lines immuno-stained with N protein as shown in (A). Each gene was targeted with 3 different guide RNAs represented as diamond symbols (n = 3 biological replicates, error bars indicate SEM). (C) Correlation of log2 median fold change from the genome-scale CRISPR screen (low MOI) and percent of infected cells after individual (arrayed) gene perturbation shown in (B). (D) Druggable genes found in the Drug Gene Interaction database (DGIdb) among highly ranked genes from the genome-scale CRISPR screen (ranked by RRA p value). (E) qPCR of SARS-CoV-2 viral load present in A549ACE2 cells pretreated for 2 h with the indicated small molecule inhibitors at 10 μM and then infected with SARS-CoV-2 at MOI of 0.1. The qPCR was performed at 36 hpi. Red bars indicate inhibitors that yield a >100-fold reduction in viral load. Bars with hatch marks indicate an unreliable viral load measurement due to a large reduction in cell viability (see F). Inhibitors were maintained at the same concentration throughout the experiment (n = 6 biological replicates, error bars indicate SEM). (F) Percent of A549ACE2 viable cells following inhibitor treatments at 10 μM for 36 hpi determined using LIVE/DEAD stain and flow cytometry. Bars with red hatch marks indicate that inhibitor treatment had a large impact on viability (<90% viability). Significance testing for (B), (E), and (F) was performed via a one-way ANOVA with false-discovery rate-corrected follow up tests; for clarity of presentation, all significance testing can be found in Table S6. See also Figures S3 and S4 and Tables S3 and S4.
Figure S4
Figure S4
Perturbations of Enriched CRISPR Screen Genes with Small-Molecule Inhibitors, Related to Figure 4 (A) Immunofluorescence quantification of SARS-CoV-2 N protein at 36 hpi (MOI 0.1) in A549ACE2 cells pretreated for 2 hours with 10 μM of the indicated inhibitors (n = 3 biological replicates, error bars represent s.e.m.) (B) Quantitative PCR (qPCR) of SARS-CoV-2 viral load present in A549ACE2 cells (CRISPR-perturbed with either non-targeting or PIK3C3-targeting guide RNAs) pretreated for 2 hours with the indicated PIK3C3 molecule inhibitors at 10 μM and then infected with SARS-CoV-2 at MOI of 0.1. The qPCR was performed at 36 hours post-infection (hpi). Inhibitors were maintained at the same concentration throughout the experiment (n = 6 biological replicates, error bars indicate s.e.m.). (C) Immunofluorescence quantification of SARS-CoV-2 N protein at 36 hpi (MOI 0.1) in A549ACE2 cells pretreated with a combination of indicated inhibitors at 10 μM each for 2 hours (n = 3 biological replicates, error bars represent s.e.m.).
Figure 5
Figure 5
Single-Cell Transcriptomics (ECCITE-Seq) Identifies Shared Target Gene Signatures for Lipid and Cholesterol Regulation (A) Schematic of pooled CRISPR perturbations with expanded CRISPR-compatible cellular indexing of transcriptomes and epitopes by sequencing (ECCITE-seq). Adapted from Mimitou et al. (2019). (B) Single-cell mRNA expression heatmap showing the 100 most differentially upregulated genes (adjusted p value <0.01) for 200 randomized cells per selected target gene perturbation (for clarity, CCDC22, PIK3C3, RAB7, and TMEM165 perturbations are not shown). Labeled genes are either a top-ranked gene from the genome-wide CRISPR screens (red) or among the top 5 differentially expressed genes for a gene perturbation (black). (C) Heatmap summarizing gene set enrichment analysis results for genes upregulated in any of the indicated target gene-perturbed cells (all genes with p value <0.01 and with a limit to the 300 most differentially expressed genes; all enriched pathways with adjusted p value <10−13). (D) Cholesterol quantification in gene-perturbed cells (with the indicated guide RNAs), normalized to total protein. See also Figure S5 and Tables S5 and S6.
Figure S5
Figure S5
ECCITE-Seq Identifies Cholesterol Gene Signature Shared across Multiple Top-Ranked Genes, Related to Figure 5 (A) Stacked violin plot of 11 genes shared in both ECCITE-seq experiments. Single-cells are grouped by unique guide RNA target gene label of cells with a single detected guide RNA. Target gene expression is highlighted in red. (B) Heatmap of Gene Set Enrichment Analysis results for genes downregulated in any of the indicated target gene perturbed cells. (C) Cholesterol (normalized by total protein) in A549ACE2 cells treated with amlodipine or vehicle (DMSO) for 24 hours. (D) Quantitative PCR (qPCR) of SARS-CoV-2 viral load present in A549ACE2 cells treated with amlodipine or DMSO for 24 hours and then infected with SARS-CoV-2 at MOI of 0.1. The qPCR was performed on cells collected at the indicated time (hours) post-infection (hpi) (n = 3 biological replicates, error bars indicate s.e.m.). (E) Plaque assays of SARS-CoV-2 viral load present in A549ACE2 cells treated with amlodipine or DMSO for 24 hours and then infected with SARS-CoV-2 using logarithmically diluted supernatants. (n = 3 biological replicates, error bars indicate s.e.m.). (F) Number of reads mapping to the indicated portion of the viral genome in A549ACE2 cells treated with amlodipine or DMSO. A representative sample is shown for each treatment (n = 3 biological replicate sequencing libraries). (G) Cell viability by Trypan Blue exclusion in A549ACE2 cells treated with amlodipine or DMSO for 24 hours (n = 3 biological replicates, error bars indicate s.e.m.). (H) Distance matrix of RNA-sequencing from A549ACE2 cells treated with amlodipine or DMSO for 24 hours and then infected at MOI 0.1 or mock infection (n = 3 biological replicate sequencing libraries for each treatment-infection group). Read counts were processed with the DESeq2 regularized-log transform before computing distances. (I) k-means clustering (k = 3) of the top 500 most variable genes across all 4 conditions (n = 3 biological replicate sequencing libraries for each treatment-infection group). For each cluster, we label the most enriched pathway (lowest p-value) and, for the genes in that pathway, we label the top 5 most variable genes. No significantly enriched pathways were found for Cluster 3.
Figure 6
Figure 6
RAB7A Loss Results in a Reduced Cell Surface Expression and an Increased Endosomal Accumulation of ACE2 (A) Representative histograms of flow cytometry analysis to determine cell surface expression of ACE2 on A549 cell lines (A549 wild-type [WT], A549ACE2, and ACE2 with Cas9 and non-targeting [NT] or RAB7A-targeting guide RNAs). The dashed line indicates the gate between the ACE2-negative and -positive cells. (B) Fraction of ACE2+ cells (using gating shown in A). ACE2 expression level was normalized across all samples to the A549ACE2 cells transduced with non-targeting (NT) guides (n = 2–3 guide RNA-transduced lines per gene, error bars are SEM). (C) Representative images of immunofluorescence staining of ACE2 on A549ACE2 transduced with an NT or a RAB7A-targeting guide. In NT cells, ACE2 localizes at the cell membrane and in the cytoplasm, while in RAB7A-targeted cells, ACE2 shows a distinct pattern of localization to vesicles. (D) Percent of cells with ACE2 accumulation in vesicles in NT and RAB7A-transduced A549ACE2 cells (n = 2 biological replicates, error bars are SEM). (E) Representative images of immunofluorescence co-stained for ACE2, EEA1, and LysoTracker in A549ACE2 cells with a CRISPR guide RNA targeting RAB7A. ACE2 shows a distinct colocalization with EEA1 (an early endosome marker) and a less frequent colocalization with LysoTracker (a lysosomal maker). (F) Representative histograms of flow cytometry analysis to determine cell surface expression in Calu-3 cells. The dashed line indicates the gate between the ACE2-negative and -positive cells. (G) Fraction of ACE2+ cells (using gating shown in F). ACE2 expression level was normalized across all samples to the Calu-3 cells transduced with an NT guide (n = 3 biological replicates, error bars are SEM). (H) Representative images of immunofluorescence staining of ACE2 on Caco-2 cells transduced with a NT or a RAB7A-targeting guide. In NT cells, ACE2 localizes at the cell membrane and in the cytoplasm, whereas in RAB7A-targeted cells, ACE2 shows a distinct pattern of localization to vesicles. (I) Mean area of ACE2 foci in Caco-2 cells transduced with a NT or a RAB7A-targeting guide (n = 4 biological replicates, 80–105 cells per replicate were scored, error bars are SEM). Significance testing for (B) and (G) was performed with a one-way ANOVA (B: F = 9.8, p < 10−4; G: Calu-3: F = 378, p < 10−4, Caco-2: F = 222, p < 10−4) with false-discovery rate-corrected post hoc tests. Significance testing for (D) and (I) was performed with an unpaired t test. For all panels, p ≤ 0.05, ∗∗p ≤ 0.01, ∗∗∗p ≤ 0.001, and ∗∗∗∗p ≤ 0.0001. See also Figure S6.
Figure S6
Figure S6
Flow Cytometry for Cell Surface ACE2 Expression and Protein Analysis of RAB7A Protein after CRISPR Targeting, Related to Figure 6 (A) and (B) Flow cytometry gating strategy to quantify cell surface expression of ACE2. (A) Live cells were first gated by the forward and side scatter area, then doublets were excluded by gating with the forward scatter area and width. Viable cells were selected by gating on side scatter area and LIVE/DEAD violet. (B) Gating strategy to determine ACE2+ cells. The gate was position such that < 3% of A549 wild-type and > 85% of A549ACE2 cells were ACE2 positive. The same gating strategy was applied to all samples. (C) western blot on A549ACE2 cells perturbed with non-targeting (NT) or RAB7A-targeting guide RNAs and probed with a RAB7A antibody. GAPDH was used as loading control.

Comment in

Similar articles

Cited by

References

    1. Aguet F., Barbeira A.N., Bonazzola R., Brown A., Castel S.E., Jo B., Kasela S., Kim-Hellmuth S., Liang Y., Oliva M., et al. The GTEx Consortium atlas of genetic regulatory effects across human tissues. bioRxiv. 2019 doi: 10.1101/787903. - DOI
    1. Aizaki H., Morikawa K., Fukasawa M., Hara H., Inoue Y., Tani H., Saito K., Nishijima M., Hanada K., Matsuura Y., et al. Critical role of virion-associated cholesterol and sphingolipid in hepatitis C virus infection. J. Virol. 2008;82:5715–5724. - PMC - PubMed
    1. Bajimaya S., Frankl T., Hayashi T., Takimoto T. Cholesterol is required for stability and infectivity of influenza A and respiratory syncytial viruses. Virology. 2017;510:234–241. - PMC - PubMed
    1. Banerjee S., Kane P.M. Regulation of V-ATPase Activity and Organelle pH by Phosphatidylinositol Phosphate Lipids. Front. Cell Dev. Biol. 2020;8:510. - PMC - PubMed
    1. Beigel J.H., Tomashek K.M., Dodd L.E., Mehta A.K., Zingman B.S., Kalil A.C., Hohmann E., Chu H.Y., Luetkemeyer A., Kline S., et al. Remdesivir for the Treatment of Covid-19 - Preliminary Report. N. Engl. J. Med. 2020 doi: 10.1056/NEJMoa2007764. Published online May 22 2020. - DOI - PMC - PubMed

Publication types

MeSH terms