

Calcium influx through the mitochondrial calcium uniporter holocomplex, MCUcx
- PMID: 33147447
- PMCID: PMC7880866
- DOI: 10.1016/j.yjmcc.2020.10.015
Calcium influx through the mitochondrial calcium uniporter holocomplex, MCUcx
Abstract
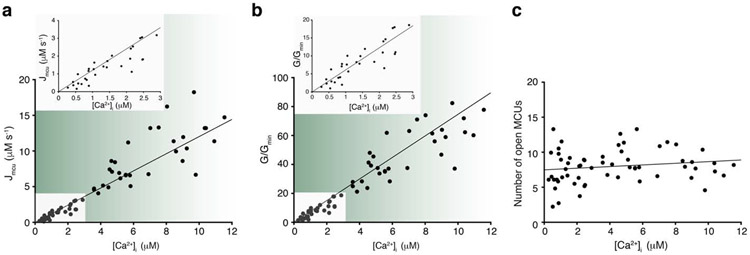
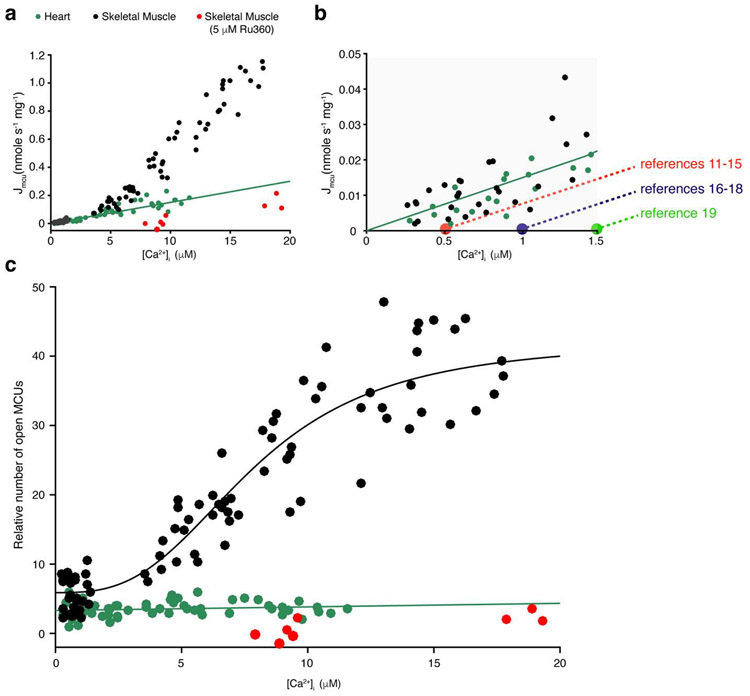
Ca2+ flux into the mitochondrial matrix through the MCU holocomplex (MCUcx) has recently been measured quantitatively and with milliseconds resolution for the first time under physiological conditions in both heart and skeletal muscle. Additionally, the dynamic levels of Ca2+ in the mitochondrial matrix ([Ca2+]m) of cardiomyocytes were measured as it was controlled by the balance between influx of Ca2+ into the mitochondrial matrix through MCUcx and efflux through the mitochondrial Na+ / Ca2+ exchanger (NCLX). Under these conditions [Ca2+]m was shown to regulate ATP production by the mitochondria at only a few critical sites. Additional functions attributed to [Ca2+]m continue to be reported in the literature. Here we review the new findings attributed to MCUcx function and provide a framework for understanding and investigating mitochondrial Ca2+ influx features, many of which remain controversial. The properties and functions of the MCUcx subunits that constitute the holocomplex are challenging to tease apart. Such distinct subunits include EMRE, MCUR1, MICUx (i.e. MICU1, MICU2, MICU3), and the pore-forming subunits (MCUpore). Currently, the specific set of functions of each subunit remains non-quantitative and controversial. The more contentious issues are discussed in the context of the newly measured native MCUcx Ca2+ flux from heart and skeletal muscle. These MCUcx Ca2+ flux measurements have been shown to be a highly-regulated, tissue-specific with femto-Siemens Ca2+ conductances and with distinct extramitochondrial Ca2+ ([Ca2+]i) dependencies. These data from cardiac and skeletal muscle mitochondria have been examined quantitatively for their threshold [Ca2+]i levels and for hypothesized gatekeeping function and are discussed in the context of model cell (e.g. HeLa, MEF, HEK293, COS7 cells) measurements. Our new findings on MCUcx dependent matrix [Ca2+]m signaling provide a quantitative basis for on-going and new investigations of the roles of MCUcx in cardiac function ranging from metabolic fuel selection, capillary blood-flow control and the pathological activation of the mitochondrial permeability transition pore (mPTP). Additionally, this review presents the use of advanced new methods that can be readily adapted by any investigator to enable them to carry out quantitative Ca2+ measurements in mitochondria while controlling the inner mitochondrial membrane potential, ΔΨm.
Keywords: Heart; Mitochondrial Ca2+ signaling; Mitochondrial Na+/Ca2+ exchanger (NCLX); Mitochondrial calcium uniporter complex (MCUcx); Mitochondrial permeability transition pore (mPTP); Skeletal muscle.
Copyright © 2020 Elsevier Ltd. All rights reserved.
Figures
References
-
- Clapham DE, Calcium signaling, Cell 131(6) (2007) 1047–58. - PubMed
-
- Cheng H, Lederer WJ, Calcium sparks, Physiol Rev 88(4) (2008) 1491–545. - PubMed
-
- Mallilankaraman K, Cardenas C, Doonan PJ, Chandramoorthy HC, Irrinki KM, Golenar T, Csordas G, Madireddi P, Yang J, Muller M, Miller R, Kolesar JE, Molgo J, Kaufman B, Hajnoczky G, Foskett JK, Madesh M, MCUR1 is an essential component of mitochondrial Ca2+ uptake that regulates cellular metabolism, Nat Cell Biol 14(12) (2012) 1336–43. - PMC - PubMed
Publication types
MeSH terms
Substances
Grants and funding
LinkOut - more resources
Full Text Sources
Other Literature Sources
Miscellaneous
