. 2020 Nov 3;33(5):108337.
doi: 10.1016/j.celrep.2020.108337.

Human and Mouse Transcriptome Profiling Identifies Cross-Species Homology in Pulmonary and Lymph Node Mononuclear Phagocytes

Affiliations

Human and Mouse Transcriptome Profiling Identifies Cross-Species Homology in Pulmonary and Lymph Node Mononuclear Phagocytes

Sonia M Leach et al. Cell Rep. .

Abstract

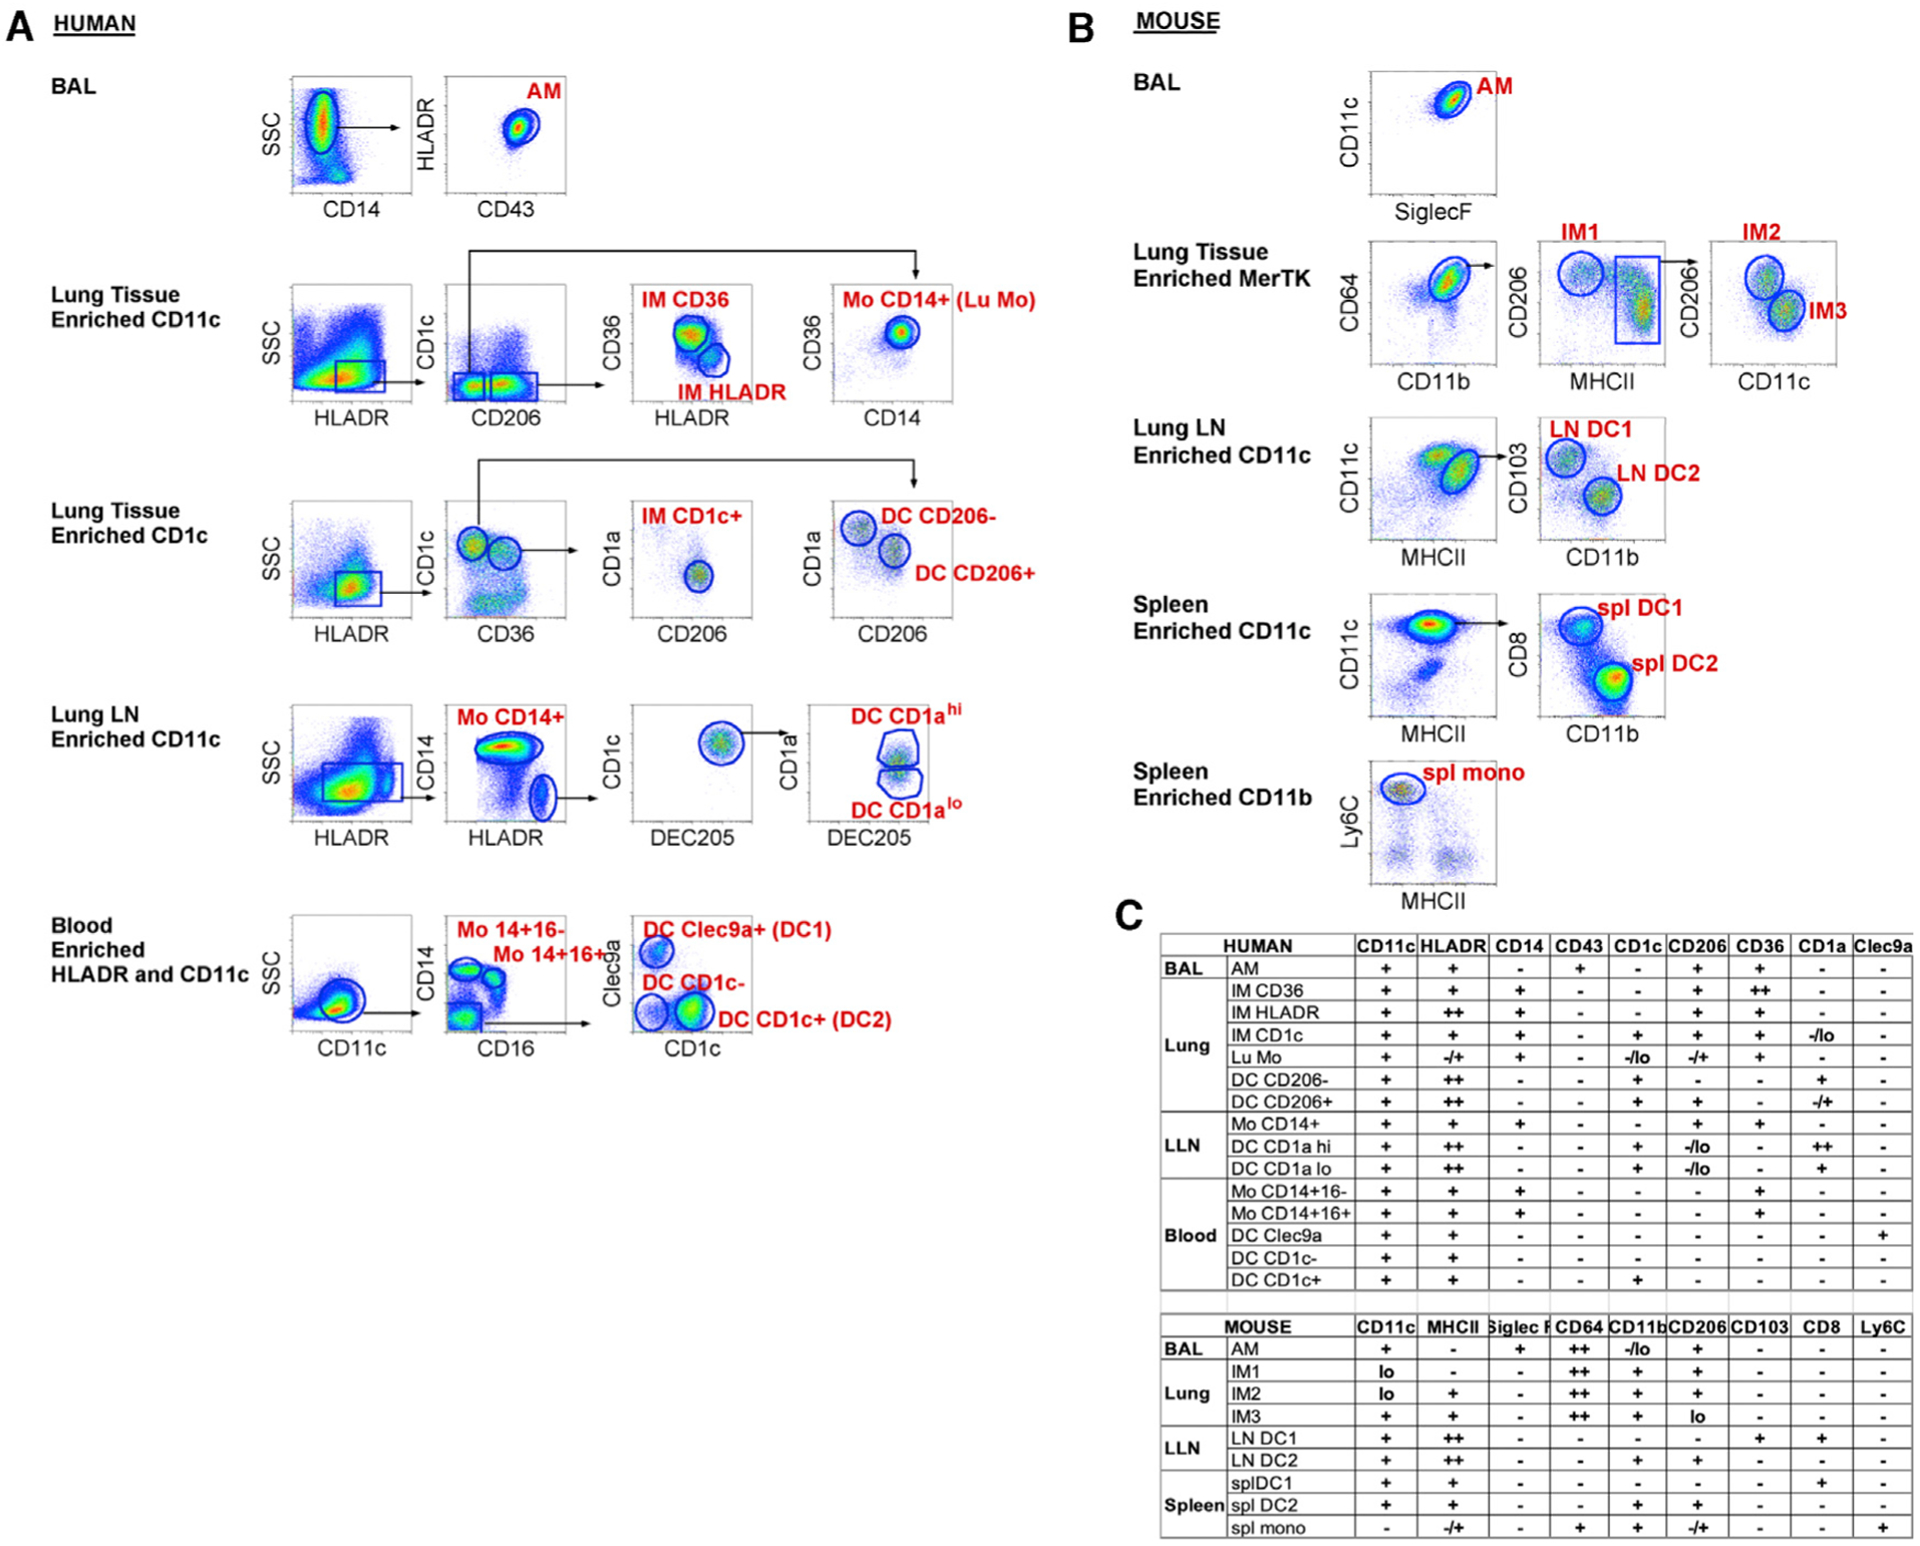
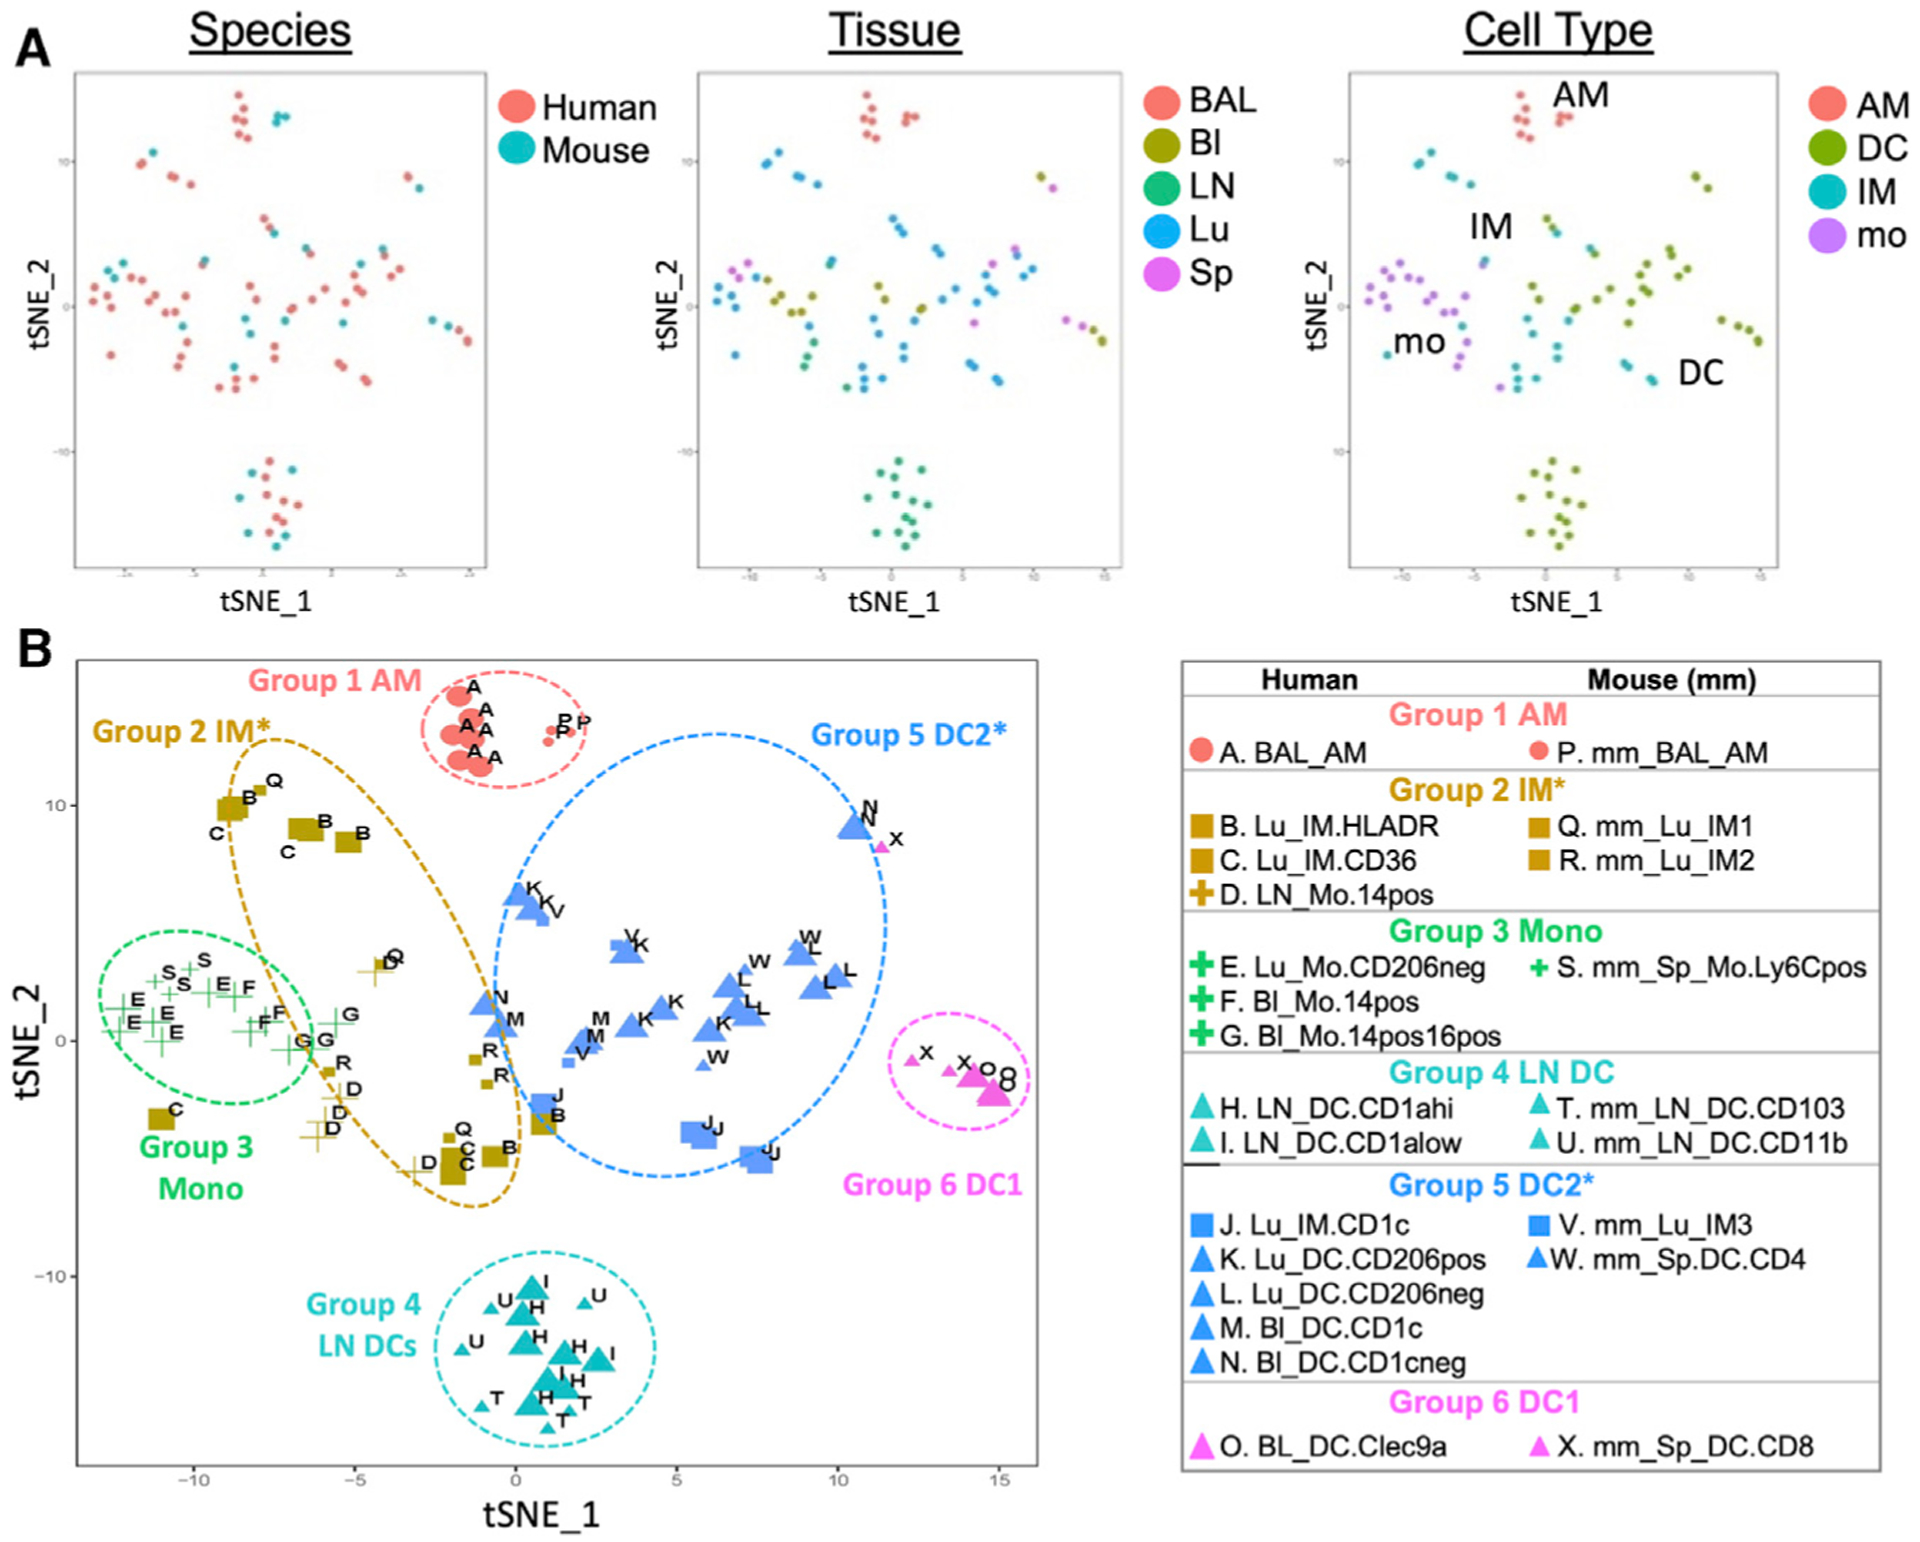
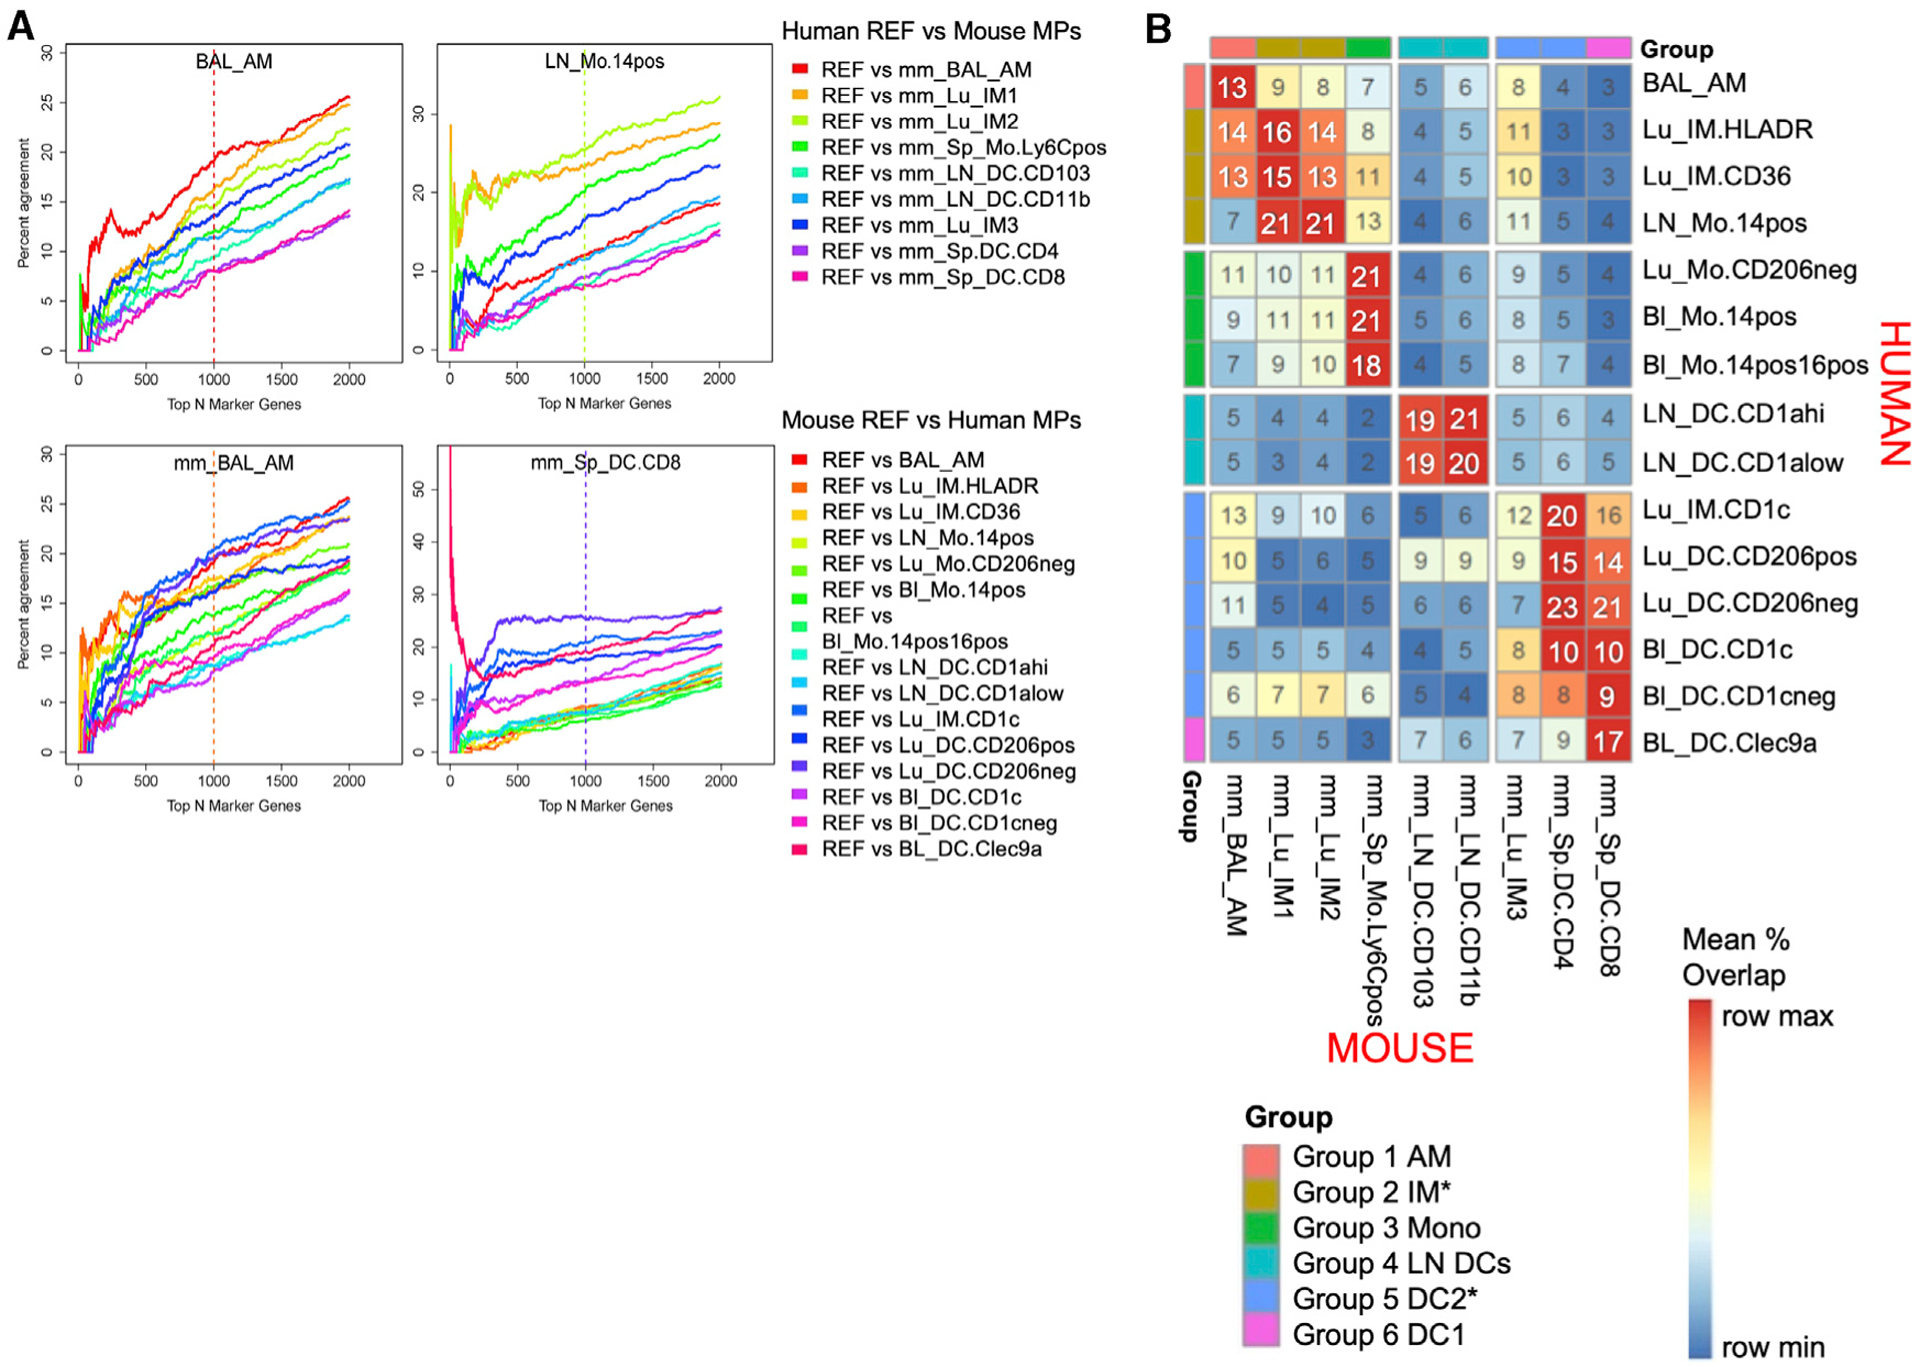
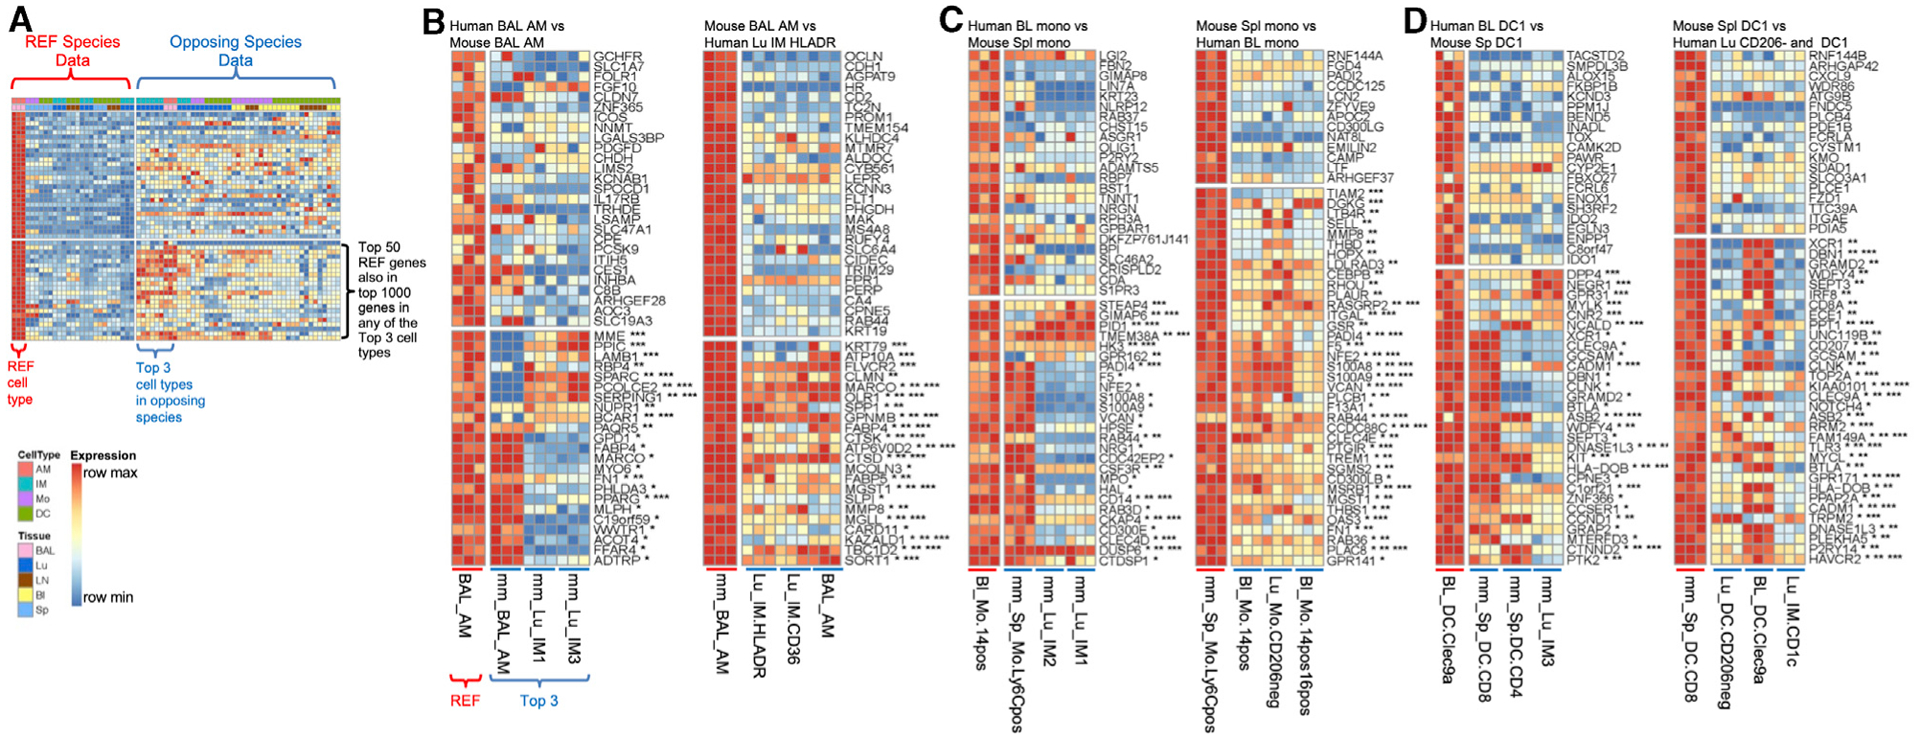
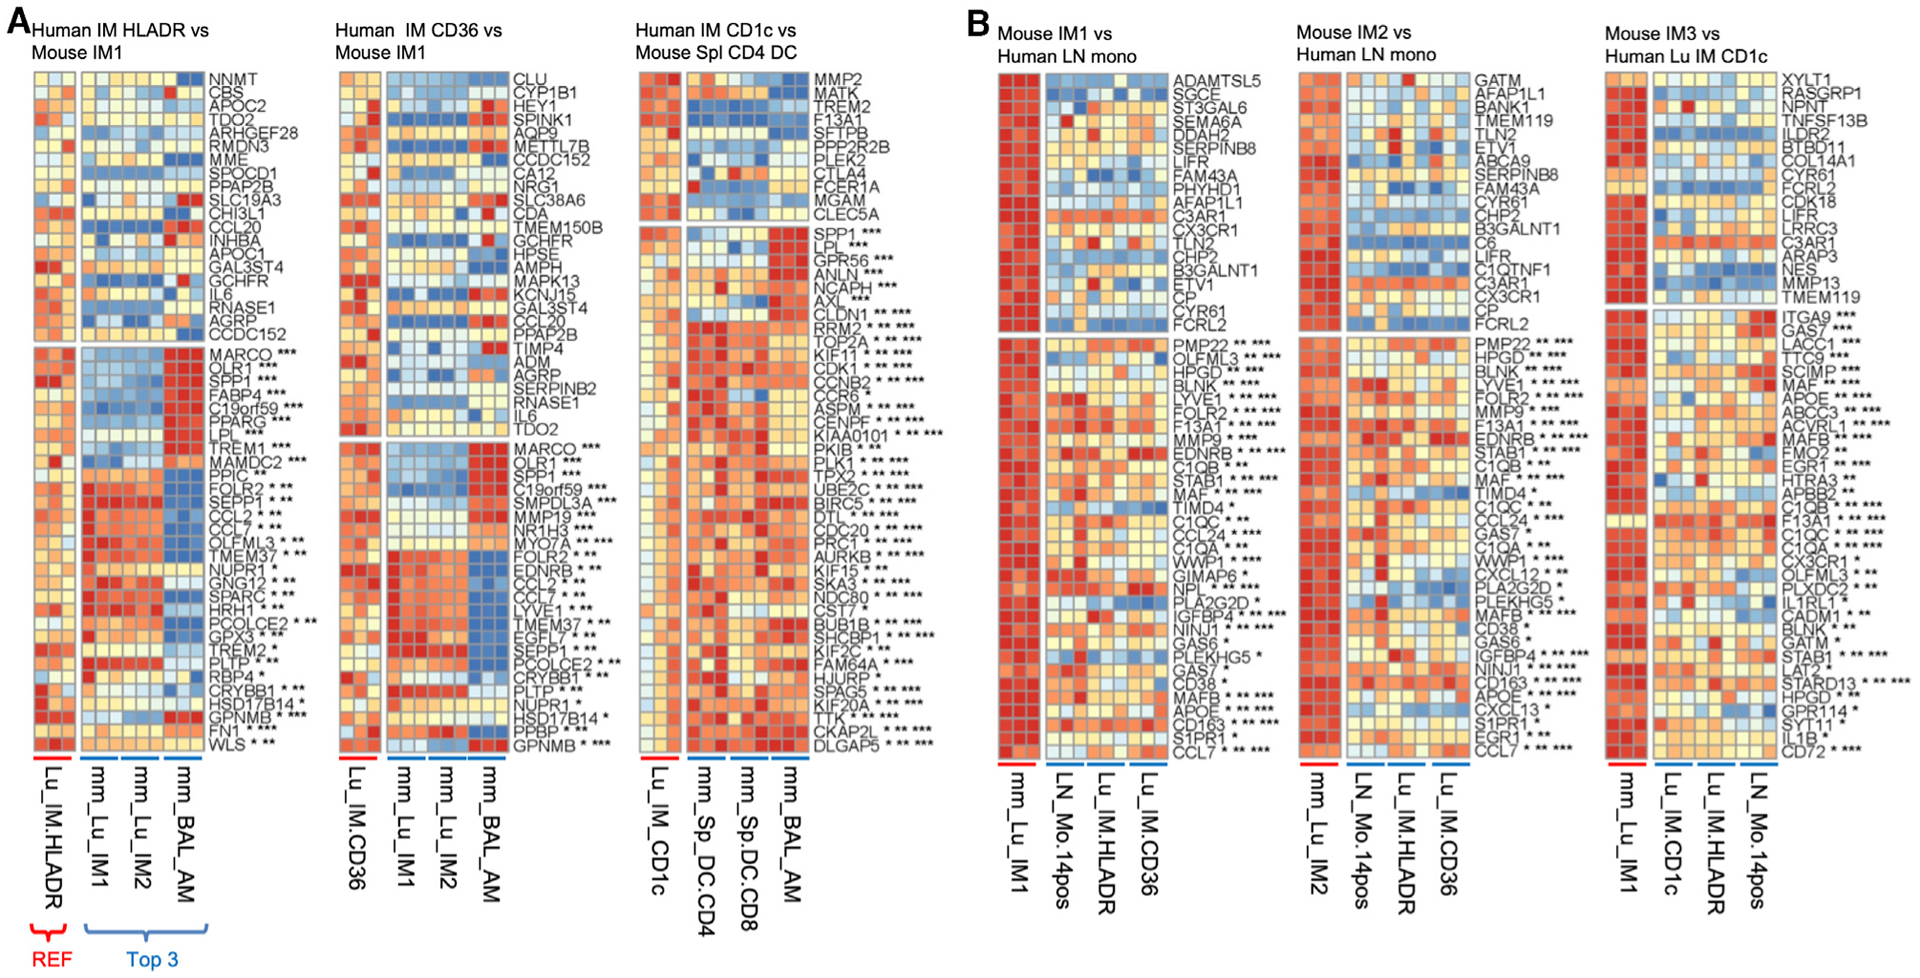
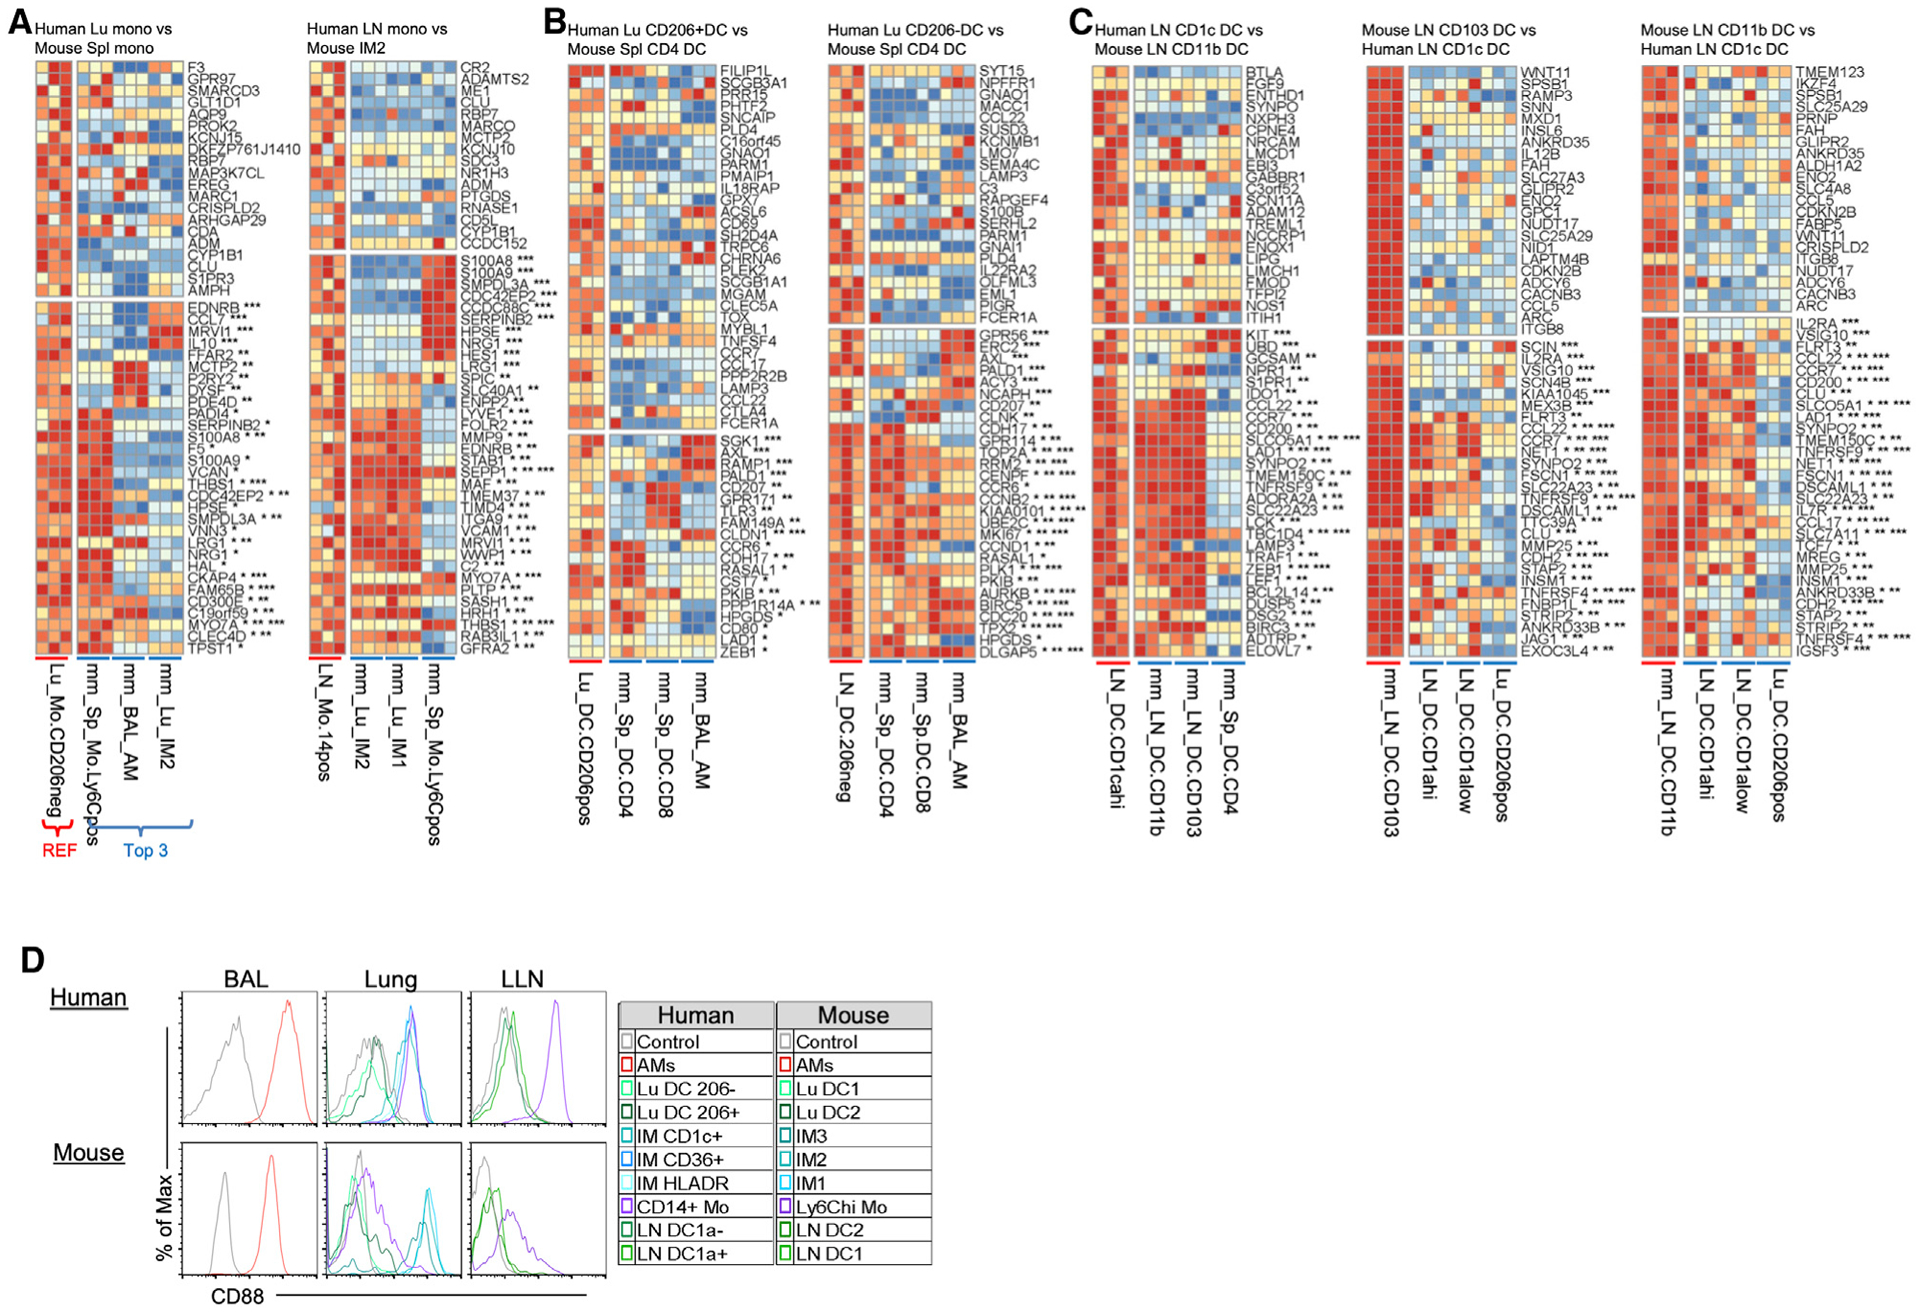
The mononuclear phagocyte (MP) system consists of macrophages, monocytes, and dendritic cells (DCs). MP subtypes play distinct functional roles in steady-state and inflammatory conditions. Although murine MPs are well characterized, their pulmonary and lymph node (LN) human homologs remain poorly understood. To address this gap, we have created a gene expression compendium across 24 distinct human and murine lung and LN MPs, along with human blood and murine spleen MPs, to serve as validation datasets. In-depth RNA sequencing identifies corresponding human-mouse MP subtypes and determines marker genes shared and divergent across species. Unexpectedly, only 13%-23% of the top 1,000 marker genes (i.e., genes not shared across species-specific MP subtypes) overlap in corresponding human-mouse MP counterparts. Lastly, CD88 in both species helps distinguish monocytes/macrophages from DCs. Our cross-species expression compendium serves as a resource for future translational studies to investigate beforehand whether pursuing specific MP subtypes or genes will prove fruitful.

Keywords: dendritic cells; human; lung; macrophages; monocytes; mononuclear phagocytes; pulmonary.


Conflict of interest statement

Declaration of Interests The authors declare no competing interests.

Figures

Figure 1.
Figure 1.. Gating Strategy to Sort Human and Mouse Mononuclear Phagocytes for RNA Isolation
(A and B) Fluorescence-activated cell sorting (FACS) gating strategy used to isolate human (A) or mouse (B) mononuclear phagocytes (MPs, labeled in red) from the indicated tissues. Before sorting, cell suspensions were magnetically enriched as indicated and gated to select Live; Single; CD45+; Lineage cells as shown in Figures S1 and S2. Arrows indicate where further analysis is performed on the specified subpopulation. The data presented are representative of 3–6 replicates per sort. (C) Table illustrating cell surface marker expression by MP subsets in human (top) and mouse (bottom). − or lo signifies no or little expression, + or ++ indicates expression or strong expression, −/+ indicates heterogeneous expression of marker proteins.
Figure 2.
Figure 2.. Confirmation of Human MP Subtypes Based on Classical Gene Signatures
Expression of signature DC and macrophage transcripts from RNA-seq are shown as normalized values. Data first undergo a variance stabilizing transformation on read counts, in which the donor identity has been regressed out to mitigate any donor effect. The data for each gene are then min-max scaled into the range [0, 1] to emphasize which MP subtypes have the minimum or maximum expression for a given gene. Although the number of replicates ranges from 3–6, only the first 3 replicates are shown for each subtype.
Figure 3.
Figure 3.. Visualization of MP Subtypes across Species
Quantile-normalized Variance Stabalizing Transformed (VST) subject-regressed data from 3–6 donors per subtype for 15 human and 9 murine MP subtypes were subjected to the Seurat version 2.0 pipeline to visualize human and mouse data within a common 2-dimensional (2D) space. (A) Samples in the resulting 2D projection are colored by species, tissue, or cell type. (B) Samples are grouped into 6 clusters based on later shared marker gene analysis (see Figure 4). Shape indicates cell type, size indicates species, and color indicates group assignment. MP subtypes are denoted by the letters A through X. Note that each group contains related subtypes across species.
Figure 4.
Figure 4.. Correspondence of MPs across Species
Candidate marker genes were ranked by their score, which multiplies their expression levels, scaled relative to the median expression, by their marker gene Z score (see Method Details). (A) For each reference subtype (graph title) from either human (top) or mouse (bottom, signified by mm), the proportion of agreement of ranked marker gene lists versus ranked marker gene lists for each candidate subtype in the other species was calculated for progressively larger list sizes and visualized with a correspondence-at-the-top (CAT) plot for a select set of MP subtypes. Percentage agreement is the percentage of genes identified as critical markers in the reference species that are also identified as critical markers for the comparison species up to that rank. For example, at rank 100 on the x axis, a value of 10% would indicate that of the marker genes in the top 100 in the reference species, 10% are in the top 100 of the comparison species. Each line shows a different cell population in the comparator species. The color of the vertical line indicates which subtype had the highest mean CAT overlap across all list sizes from 1 to 1,000 with respect to the reference. (B) The mean CAT overlap over list sizes 1–1,000 is shown for each subtype pair. Rows are scaled by the maximum and the minimum to emphasize the highest subtype correspondence for the human subtypes. Rows and columns are ordered to cluster similar subtypes. Clusters of MP subtypes are then annotated by group number, and these groupings are used for the coloring in Figure 3B.
Figure 5.
Figure 5.. Well-Defined Human-Mouse Homologs
The expression values are shown for the top 50 marker genes in the reference cell type. The cell types are ordered by degree of overlap with the reference cell type, if within the same species, or by the mean CAT overlap shown in Figure 4B if in the other species. The data are scaled across the row by the gene minimum and maximum within each species to emphasize in which cell types the gene is most expressed. Genes among the top 50 in the reference that also appear in the top 1,000 ranked genes in the 1st-, 2nd-, or 3rd-best match marker list appear toward the bottom and are annotated with *, **, or ***, respectively. Note that annotation by an asterisk does not mean that the gene must also appear in the top 50 marker genes in the other species, only that it appears in the top 1,000 genes for the top 3 matches. Also, visualizing the top 3 matches rather than just the best match can help reveal cases when the best match, as determined using 1,000 reference marker genes, may differ from the best match suggested by comparing expression of just the top 50 reference genes, in which case the CAT plots can inform the reason for the perceived discrepancy (Figures S7 and S8). (A) Example depiction of all of the data in all of the samples for a given reference and the top 3 closest matches according to Figure 4B. (B) Highest correspondence for human and mouse AMs. Three replicates for the reference and 3 closest subtypes of the opposing species are shown. (C) Reciprocal highest correspondence for human BL and mouse Spl monocytes. Three replicates for the reference and the 3 closest subtypes are shown. (D) Highest correspondence for human BL DC Clec9a+ and mouse Spl CD8+ DC1. Three replicates for the reference and the 3 closest subtypes are shown.
Figure 6.
Figure 6.. Corresponding Human and Mouse IM Subtypes
Expression is shown for the first 50 ranked genes using the scaled data, as in Figure 5. Three replicates for the reference and the 3 closest subtypes of the opposing species are shown. Genes are annotated by whether they are also in the top 1,000 marker genes in the 3 highest corresponding subtypes with *, **, or ***, respectively. (A) Human IMs. (B) Mouse IMs.
Figure 7.
Figure 7.. Corresponding Human and Mouse Monocytes and DC Subtypes; CD88 Expression Distinguishes Monocytes/Macrophages from DCs
Expression is shown for the first 50 ranked genes using the scaled data as in Figure 5. Three replicates for the reference and the 3 closest subtypes of the opposing species are shown. Genes are annotated by whether they are also in the top 1,000 marker genes in the 3 highest corresponding subtypes with *, **, or ***, respectively. (A) Human monocytes. (B) Human lung DCs. (C) Human and mouse LN DCs. (D) Histogram shows the protein expression of CD88 in human and mouse MPs in Figure 1.

Similar articles

Cited by

References

    1. Alferink J, Lieberam I, Reindl W, Behrens A, Weiss S, Hüser N, Gerauer K, Ross R, Reske-Kunz AB, Ahmad-Nejad P, et al. (2003). Compartmentalized production of CCL17 in vivo: strong inducibility in peripheral dendritic cells contrasts selective absence from the spleen. J. Exp. Med 197, 585–599. - PMC - PubMed
    1. Altmann DM (2018). A Nobel Prize-worthy pursuit: cancer immunology and harnessing immunity to tumour neoantigens. Immunology 155, 283–284. - PMC - PubMed
    1. Atif SM, Nelsen MK, Gibbings SL, Desch AN, Kedl RM, Gill RG, Marrack P, Murphy KM, Grazia TJ, Henson PM, and Jakubzick CV (2015). Cutting Edge: Roles for Batf3-Dependent APCs in the Rejection of Minor Histocompatibility Antigen-Mismatched Grafts. J. Immunol 195, 46–50. - PMC - PubMed
    1. Atif SM, Gibbings SL, and Jakubzick CV (2018a). Isolation and Identification of Interstitial Macrophages from the Lungs Using Different Digestion Enzymes and Staining Strategies. Methods Mol. Biol 1784, 69–76. - PMC - PubMed
    1. Atif SM, Gibbings SL, Redente EF, Camp FA, Torres RM, Kedl RM, Henson PM, and Jakubzick CV (2018b). Immune Surveillance by Natural IgM Is Required for Early Neoantigen Recognition and Initiation of Adaptive Immunity. Am. J. Respir. Cell Mol. Biol 59, 580–591. - PMC - PubMed

Publication types

MeSH terms