. 2020 Nov 3;33(5):108348.
doi: 10.1016/j.celrep.2020.108348.

Lipid Droplets in Brown Adipose Tissue Are Dispensable for Cold-Induced Thermogenesis

Affiliations

Lipid Droplets in Brown Adipose Tissue Are Dispensable for Cold-Induced Thermogenesis

Chandramohan Chitraju et al. Cell Rep. .

Abstract

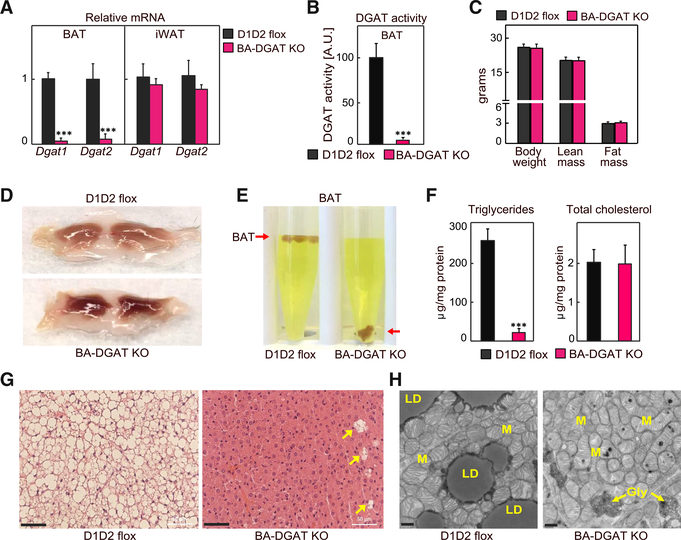
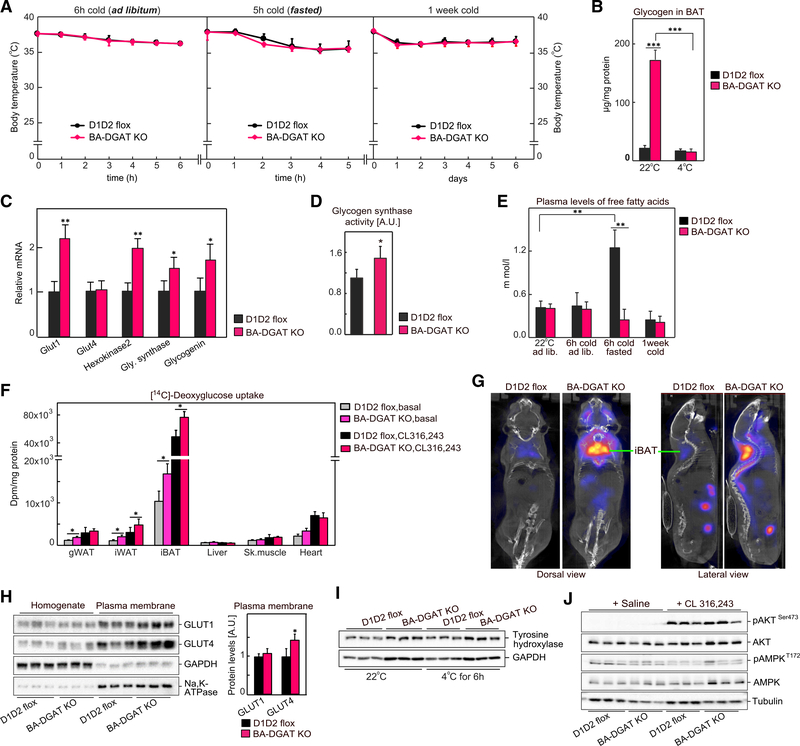
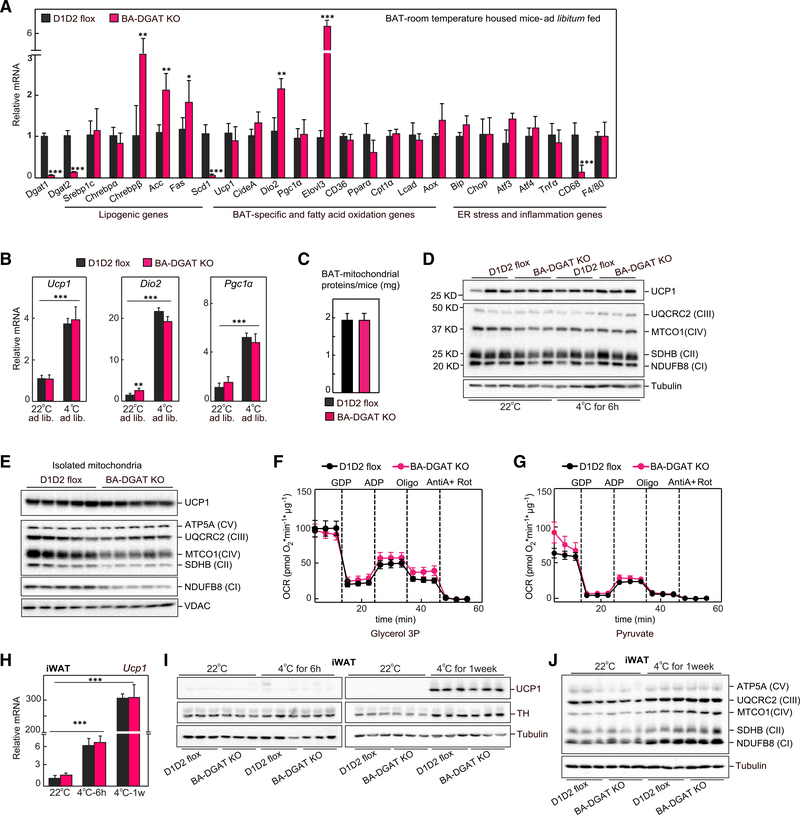
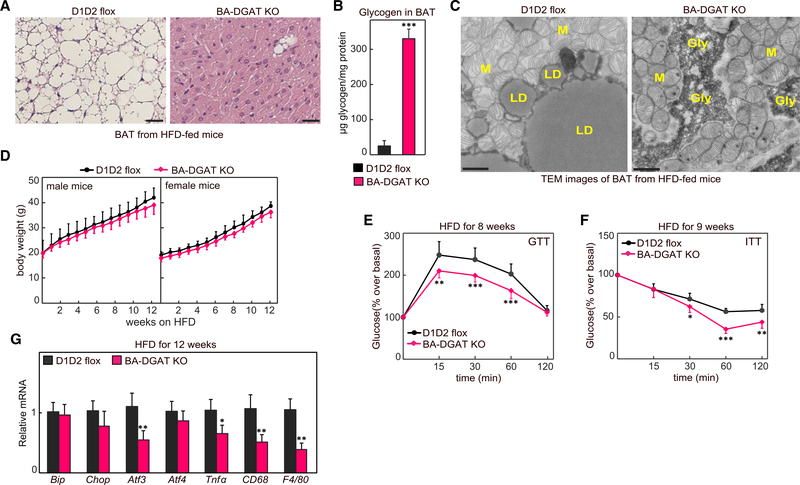
Brown adipocytes store metabolic energy as triglycerides (TGs) in lipid droplets (LDs). Fatty acids released from brown adipocyte LDs by lipolysis are thought to activate and fuel UCP1-mediated thermogenesis. Here, we test this hypothesis by preventing fatty acid storage in murine brown adipocytes through brown adipose tissue (BAT)-specific deletions of the TG synthesis enzymes DGAT1 and DGAT2 (BA-DGAT KO). Despite the absence of TGs in brown adipocytes, BAT is functional, and BA-DGAT-KO mice maintain euthermia during acute or chronic cold exposure. As apparent adaptations to the lack of TG, brown adipocytes of BA-DGAT-KO mice appear to use circulating glucose and fatty acids, and stored glycogen, to fuel thermogenesis. Moreover, BA-DGAT-KO mice are resistant to diet-induced glucose intolerance, likely because of increased glucose disposal by BAT. We conclude that TGs in BAT are dispensable for its contribution to cold-induced thermogenesis, at least when other fuel sources are available.

Keywords: Brown adipose tissue; DGAT1; DGAT2; cold-induced thermogenesis; glucose intolerance; lipid droplets; triglycerides.


Conflict of interest statement

Declaration of Interests T.C.W. has an immediate family member working for Pfizer, Inc. T.C.W. and R.V.F. have a sponsored research agreement with Pfizer, Inc.

Figures

Figure 1.
Figure 1.. Triglycerides and Lipid Droplets (LDs) Are Absent in BAT of BA-DGAT-KO Mice
Brown adipose tissue-specific Dgat1 and Dgat2 double-knockout mice (BA-DGAT KO) were generated by crossing D1D2 flox mice with mice expressing the Cre-recombinase under control of the Ucp1 promoter. (A) mRNA levels of Dgat1 and Dgat2 in BAT and iWAT (n = 6). (B) DGAT activity in BAT lysates (n = 4). (C) Lean mass and fat mass analysis of 10-week-old chow diet-fed mice (n = 8). (D) Gross appearance of interscapular BAT. (E) BAT of BA-DGAT-KO mice sinks in an aqueous buffer with fixative (1.25% formaldehyde, 2.5% glutaraldehyde, and 0.03% picric acid in 0.1 M sodium cacodylate buffer, pH 7.4, density = 1.01 g/mL) used to fix BAT tissue for electron microscopy. (F) Triglycerides and total cholesterol content in BAT (n = 5). (G) H&E-stained sections of BAT. LDs were absent in nearly all cells of BAT depots in BA-DGAT-KO mice. A few cells of unknown identity (arrowheads) in BAT of BA-DGAT-KO mice had LDs. Scale bars, 50 μm. (H) Transmission electron microscopy (TEM) images of BAT. Scale bars, 2 μm. LD, lipid droplet; M, mitochondria; Gly, glycogen. Data are presented as mean ± SD. ***p < 0.001, t test.
Figure 2.
Figure 2.. BA-DGAT-KO Mice Maintain Euthermia during Acute or Chronic Cold Exposure
(A) Mice were exposed to cold acutely (in ad libitum fed or in fasted state) or chronically for 1 week (n = 8). (B) Glycogen levels in brown fat (n = 3). (C) mRNA levels in BAT of mice housed at room temperature (n = 6). (D) Glycogen synthase activity in BAT measured in vitro (n = 5). (E) Plasma levels of free fatty acids (n = 7). (F) [14C]-Deoxyglucose uptake by tissues in vivo in basal or CL 316,243-administered mice (n = 3). (G) [18F]-FDG-PET/CT scans of CL 316,243-administered mice. (H) Western blot analysis of glucose transporters in whole tissue homogenate and in plasma membrane fractions isolated from BAT of insulin-administered mice (n = 6). (I) Western blot analysis of tyrosine hydroxylase in BAT of room temperature-housed or cold-exposed mice (n = 3). (J) Western blot analysis of insulin signaling in BAT of basal or CL 316,243-administered mice (n = 3). Data are presented as mean ± SD. *p < 0.05, **p < 0.01, and ***p < 0.001.
Figure 3.
Figure 3.. Adaptations of BAT Lacking TG Stores to Maintain Thermogenesis
(A) mRNA levels in BAT of mice housed at room temperature (n = 6). (B) mRNA levels in BAT of ad libitum fed or cold-exposed (fasted) mice (n = 6). (C) Total protein content of isolated mitochondria (n = 8). (D) Western blot analysis of mitochondrial proteins from BAT tissue lysates (n = 4). (E) Western blot analysis of mitochondrial proteins from isolated mitochondria (n = 4). (F and G) Oxygen consumption rates (OCR) of isolated mitochondria measured using glycerol-3-phosphate or pyruvate as substrates. The difference between initial respiration and respiration after GDP addition was considered UCP1 activity. The difference between respiration after ADP addition and after oligomycin addition was considered ATP synthase activity (n = 4). (H) mRNA levels of Ucp1 in iWAT of room temperature-housed or acutely cold-exposed mice (n = 6). (I) Western blot analysis of UCP1 and tyrosine hydroxylase (TH) in iWAT of room temperature-housed or cold-exposed mice (n = 3). (J) Levels of OXPHOS proteins in iWAT of room temperature-housed or cold-exposed mice (n = 3). Data are presented as mean ± SD. *p < 0.05, **p < 0.01, and ***p < 0.001.
Figure 4.
Figure 4.. BA-DGAT-KO Mice Are Resistant to High-Fat Diet (HFD)-Induced Glucose Intolerance
(A) H&E-stained sections of BAT from 12 week HFD-fed mice; scale bars, 25 μm. (B) Glycogen levels in BAT of HFD-fed mice (n = 3). (C) TEM images of BAT from HFD-fed mice. Scale bars, 2 μm. LD, lipid droplet; M, mitochondria; Gly, glycogen. (D) Body weights of mice fed on Western-type HFD (n = 15). (E and F) Glucose tolerance test and insulin tolerance test performed on HFD-fed mice (n = 10). The GTTs were performed on 16 h fasted mice, when the basal glucose level was 125 ± 8 mg/dL in BA-DGAT-KO mice compared with 136 ± 9 mg/dL in control mice (p = 0.016, unpaired two-tailed Student’s t test). The ITTs were performed on 4 h fasted mice with basal glucose levels of 160 ± 6 mg/dL in BA-DGAT KO compared with 181 ± 10 mg/dL in control mice (p = 0.001, unpaired two-tailed Student’s t test). (G) mRNA levels in BAT of HFD-fed mice (n = 6). Data are presented as mean ± SD. *p < 0.05, **p < 0.01,***p < 0.001, and ****p < 0.000, two-way ANOVA with Bonferroni’s multiple-comparison test (for E and F). *p < 0.05, **p < 0.01, and ***p < 0.001, t test (for B and G).

References

    1. Bartelt A, Bruns OT, Reimer R, Hohenberg H, Ittrich H, Peldschus K, Kaul MG, Tromsdorf UI, Weller H, Waurisch C, et al. (2011). Brown adipose tissue activity controls triglyceride clearance. Nat. Med 17, 200–205. - PubMed
    1. Bartelt A, Widenmaier SB, Schlein C, Johann K, Goncalves RLS, Eguchi K, Fischer AW, Parlakgul G, Snyder NA, Nguyen TB, et al. (2018). Brown adipose tissue thermogenic adaptation requires Nrf1-mediated proteasomal activity. Nat. Med 24, 292–303. - PMC - PubMed
    1. Bertholet AM, and Kirichok Y (2019). The mechanism FA-dependent H(+) transport by UCP1. Handb. Exp. Pharmacol 251, 143–159. - PubMed
    1. Bertholet AM, Kazak L, Chouchani ET, Bogaczynska MG, Paranjpe I, Wainwright GL, Betourne A, Kajimura S, Spiegelman BM, and Kirichok Y (2017). Mitochondrial patch clamp of beige adipocytes reveals UCP1-positive and UCP1-negative cells both exhibiting futile creatine cycling. Cell Metab. 25, 811–822.e4. - PMC - PubMed
    1. Cannon B, and Nedergaard J (2004). Brown adipose tissue: function and physiological significance. Physiol. Rev. 84, 277–359. - PubMed

Publication types