. 2020 Nov 3;32(5):736-750.e5.
doi: 10.1016/j.cmet.2020.10.007.

Pyruvate Kinase Controls Signal Strength in the Insulin Secretory Pathway

Affiliations

Pyruvate Kinase Controls Signal Strength in the Insulin Secretory Pathway

Sophie L Lewandowski et al. Cell Metab. .

Abstract

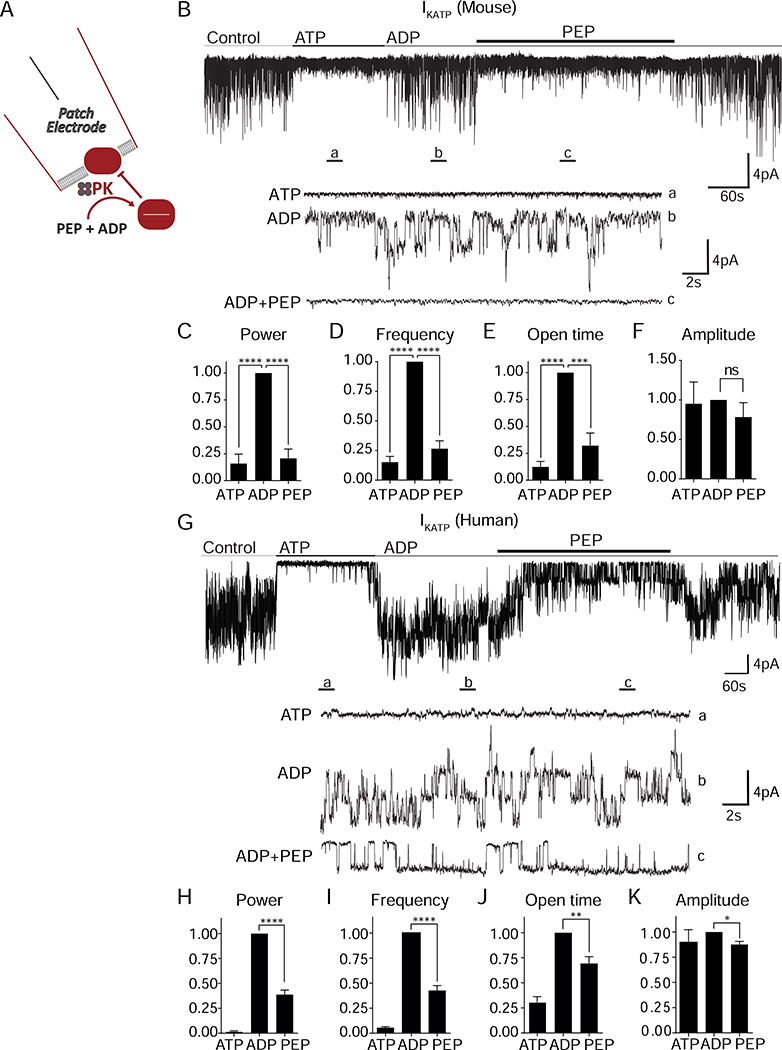
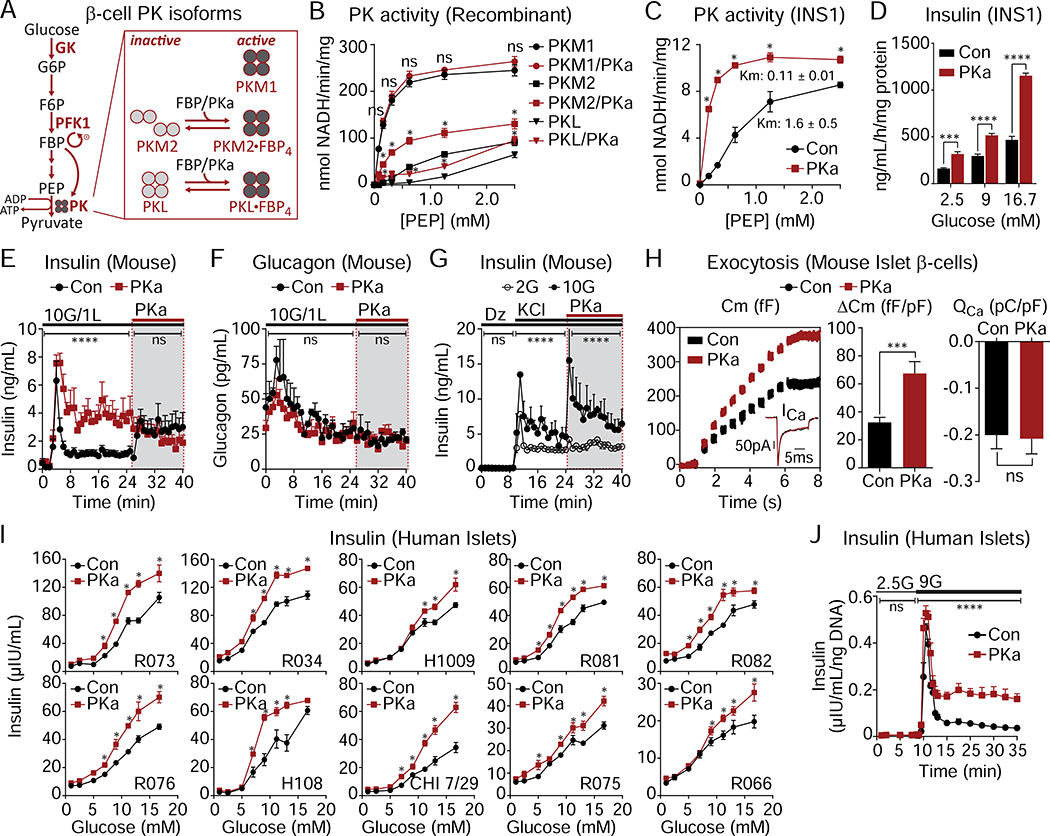
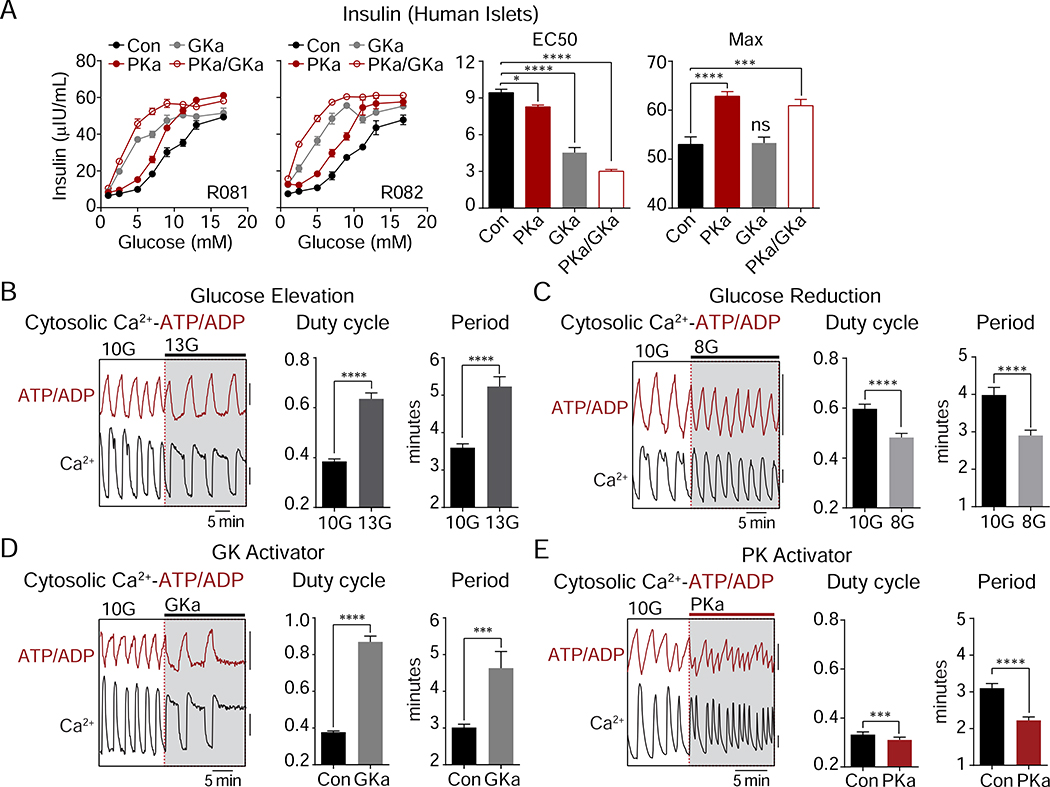
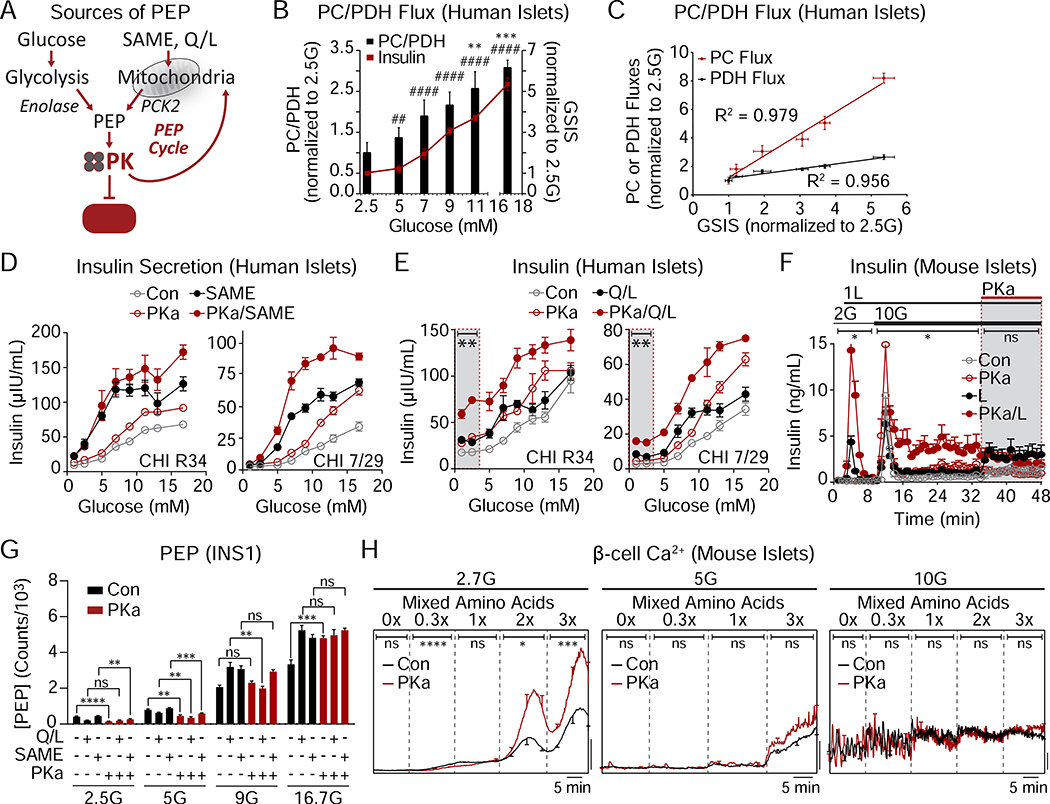
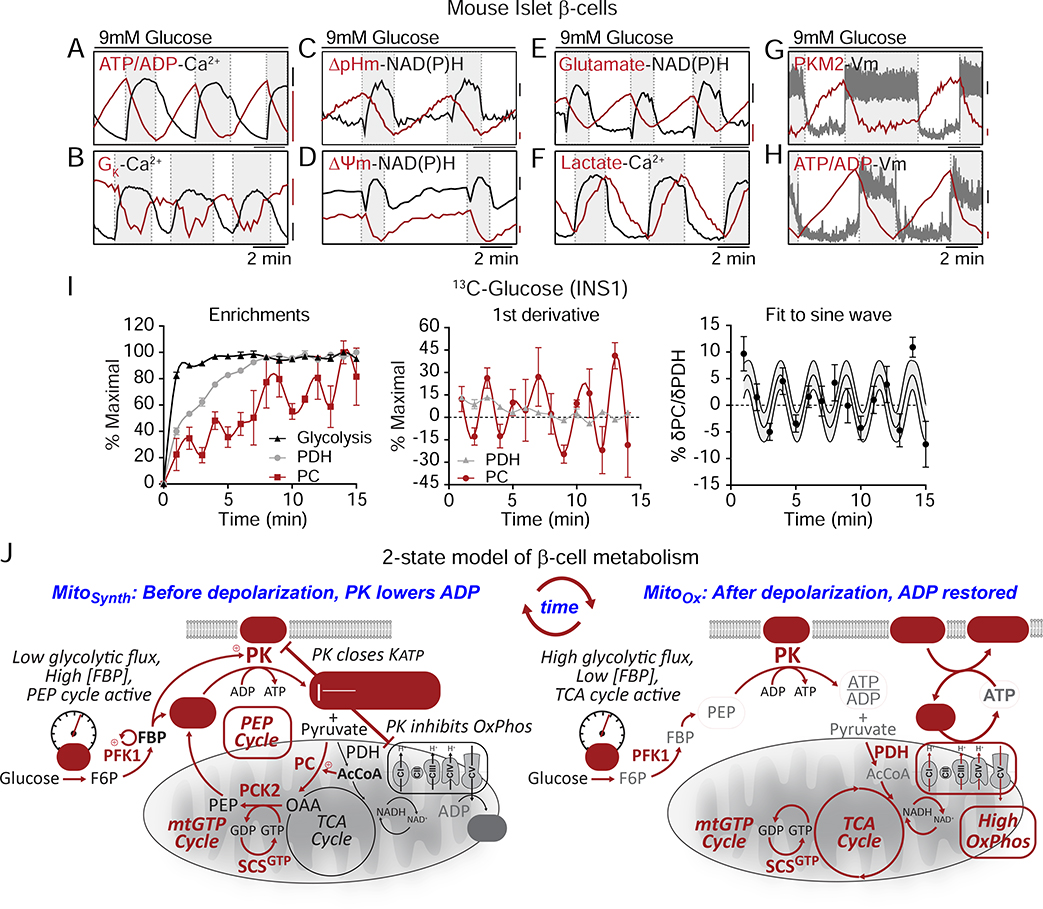
Pancreatic β cells couple nutrient metabolism with appropriate insulin secretion. Here, we show that pyruvate kinase (PK), which converts ADP and phosphoenolpyruvate (PEP) into ATP and pyruvate, underlies β cell sensing of both glycolytic and mitochondrial fuels. Plasma membrane-localized PK is sufficient to close KATP channels and initiate calcium influx. Small-molecule PK activators increase the frequency of ATP/ADP and calcium oscillations and potently amplify insulin secretion. PK restricts respiration by cyclically depriving mitochondria of ADP, which accelerates PEP cycling until membrane depolarization restores ADP and oxidative phosphorylation. Our findings support a compartmentalized model of β cell metabolism in which PK locally generates the ATP/ADP required for insulin secretion. Oscillatory PK activity allows mitochondria to perform synthetic and oxidative functions without any net impact on glucose oxidation. These findings suggest a potential therapeutic route for diabetes based on PK activation that would not be predicted by the current consensus single-state model of β cell function.

Keywords: K(ATP) channel; anaplerosis; biosensor imaging; insulin secretion; metabolic flux; metabolic oscillations; oxidative phosphorylation; phosphoenolpyruvate cycle; pyruvate kinase; β cell metabolism.


Conflict of interest statement

Declaration of Interests The authors declare no competing interests.

Figures

Figure 1.
Figure 1.. Membrane-associated PK is sufficient to close KATP channels
(A) Experimental setup for excised patch of KATP channels. (B) Applying the substrates for PK closes KATP channels in mouse islets. ATP, 1 mM ATP; ADP, 0.5 mM ADP + 0.1 mM ATP; PEP, 5 mM phosphoenolpyruvate. Holding potential, −50 mV. (C-F) Analysis of KATP channel closure in terms of power (C), frequency (D), open time (E), and amplitude (F) in mouse islets. (G) Applying the substrates for PK closes KATP channels in human islets. (H-K) Analysis of KATP channel closure in terms of power (H), frequency (I), open time (J), and amplitude (K) from 3 human islet donors. Data are shown as mean ± SEM. *P < 0.05, **P < 0.01, ***P < 0.001, ****P < 0.0001 by 1-way ANOVA. See also Figure S1 and Table S1.
Figure 2.
Figure 2.. Pharmacological activation of β-cell PK enhances glucose-stimulated insulin secretion (GSIS) from rodent and human islets
(A) Schematic depicting PKM2 and PKL activation by glycolytic FBP or PKa. (B) Activity of recombinant PKM1, PKM2 and PKL in response to PKa (10 μM TEPP-46) (n = 3). (C) PK activity in INS1 832/13 lysates in response to PKa (n = 3). (D) GSIS from INS1 832/13 cells in static incubation assays in the absence or presence of PKa (n = 6). (E-F) Effect of PKa on GSIS (E) and glucagon secretion (F) from perifused mouse islets applied with 10 mM glucose (10G) including during second phase (shaded box) (n = 3). (G) KCl-stimulated insulin secretion in mouse islets perifused with 2 mM glucose (2G) and 10G in the absence or presence of PKa (n = 3). (H) Insulin exocytosis, calcium current (ICa), calcium influx (QCa) from mouse islet β-cells with PKa applied via patch pipette (n = 20 cells per treatment). (I) GSIS from human donor islets in static incubation assays in the absence or presence of PKa. Data points represent the mean of 4 technical replicates for each experiment. (J) Insulin secretion from human islets (donor H108) perifused with 2.5 mM glucose (2.5G) and 9 mM glucose (9G) in the absence or presence of PKa. Data points represent the mean of 4 technical replicates for each experiment. Data are shown as mean ± SEM. *P < 0.05, ***P < 0.001, ****P < 0.0001 by 1-way ANOVA (B-D, I), 2-way ANOVA (E-G, J), or Student’s t-test (H). See also Figures S2–3 and Table S1.
Figure 3.
Figure 3.. PK amplifies insulin secretion by a distinct mechanism from glucokinase
(A) Glucose-dose response of insulin secretion in human islets (n = 8) in the absence or presence of GKa and PKa. (B-E) Representative recordings and quantification of cytosolic calcium and ATP/ADP oscillations (duty cycle and period) in mouse islets. (B) Glucose elevation from 10 mM glucose (10G) to 13 mM glucose (13G) (n = 51). (C) Glucose reduction from 10G to 8 mM glucose (8G) (n = 53). (D) Addition of 500 nM GK activator (GKa) RO-0281675 in 10 mM glucose (n = 37). (E) Addition of 10 μM PK activator TEPP-46 in 10 mM glucose (n = 62 islets from 4 mice). FuraRed (Ca2+), black scale bar = 0.01 (B, D) or 0.1 (C, E) R430/500; Perceval-HR (ATP/ADP), red scale bar = 0.01 R500/430. Data are shown as mean ± SEM. *P < 0.05, ***P < 0.001, ****P < 0.0001 by 1-way ANOVA (A) or paired Student’s t-test (B-E). See also Table S1.
Figure 4.
Figure 4.. The GK-independent action of PK is powered by mitochondrial anaplerosis
(A) Cartoon depicting the sources of phosphoenolpyruvate (PEP) from glycolysis and mitochondrial anaplerosis. SAME (monomethyl succinate), PCK2 (mitochondrial phosphoenolpyruvate carboxykinase), Q/L (glutamine/leucine). (B) Flux of pyruvate carboxylase/pyruvate dehydrogenase (PC/PDH) and insulin secretion in response to various glucose concentrations (donor R082). Significance for PC/PDH is annotated with ** and significance for insulin is annotated with ##. ##P < 0.01, ####P < 0.0001. (C) Determination of correlation of GSIS with PC and PDH fluxes (donor R082). (D) Insulin secretion from 2 human islet donors with glucose (1–16.7 mM), 10 mM monomethyl succinate (SAME), and 10 μM PKa as indicated. (E) Insulin secretion from 2 human islet donors with glucose (1–16.7 mM), 4 mM glutamine plus 10 mM leucine (Q/L), and 10 μM PKa as indicated. (F) Insulin release from mouse islets in the presence of 2 and 10 mM glucose (2G, 10G), 1 mM leucine (1L), and 10 μM PKa as indicated (n = 8 mice). (G) Concentration of PEP in INS1 832/13 cells (n = 6) in response to 2.5, 5, 9, 16.7 mM glucose (2.5G, 5G, 9G, 16.7G) in the absence or presence of 4 mM glutamine plus 10 mM leucine (Q/L), 10 mM monomethyl succinate (SAME), and 10 μM PKa. (H) Representative average β-cell calcium in the absence or presence of PKa and in response to an amino acid ramp at 2.7 mM glucose (2.7G; left; Con, n = 19; PKa, n = 17), 5G (center; Con, n = 20; PKa, n = 19), and 10G (right; Con, n = 14; PKa, n = 13) in mouse islets. Data are shown as mean ± SEM. *P < 0.05, **P < 0.01, ***P < 0.001, ****P < 0.0001 by 1-way ANOVA (B, D, E), 2-way ANOVA (F,H), or Student’s t-test (G). See also Tables S1–2.
Figure 5.
Figure 5.. PK activation is independent of oxidative mitochondrial metabolism
(A) Oxygen consumption rate of mouse islets (n = 3) treated with 10 μM PK activator TEPP-46 (PKa, n = 5) or vehicle (Con, n = 4) and the acute addition of electron transport chain inhibitors (Oligo, 1 μM oligomycin; Rot, 1 μM rotenone). (B) Oxygen consumption rate of INS1 832/13 cells (n = 15) treated with 10 μM PK activator TEPP-46 (PKa) or vehicle (Con) and the acute addition of electron transport chain inhibitors (Oligo, 1 μM oligomycin; Rot, 1 μM rotenone). (C-E) Impact of PK activation on INS1 832/13 metabolic fluxes. (C) Steady-state concentrations of glycolytic and TCA cycle intermediates. (D) Fractional flux through pyruvate dehydrogenase (VPDH), pyruvate carboxylase (VPC), and phosphoenolpyruvate carboxykinase (VPCK) obtained from the steady-state analysis of enrichments following incubation with [U-13C6]glucose. (E) Absolute fluxes calculated by the mathematical analysis of the time-dependent accumulation of 13C-label into the glycolytic and mitochondrial intermediates (n = 6). Data are shown as mean ± SEM. Statistics calculated by Student’s t-test. ns, not significant.
Figure 6.
Figure 6.. PK requires the mitochondrial PEP cycle to amplify insulin secretion
(A) Representative recordings and quantification of NAD(P)H fluorescence and mitochondrial membrane potential (ΔΨm) oscillations in mouse islets stimulated by 9 mM glucose (9G) followed by acute application of PKa (Con, n = 36; PKa, n = 43). F/F0 indicates fluorescence normalized to baseline. (B) Representative recordings and quantification of NAD(P)H fluorescence and mitochondrial membrane potential (ΔΨm) in mouse islets stimulated by 2 mM glucose (2G) followed by acute application of PKa (Con, n = 21; PKa, n = 21). F/F0 indicates fluorescence normalized to baseline. (C) Cartoon depicting the coordination between PK-mediated ADP lowering, inactivation of the electron transport chain (ETC), and increased mitochondrial GTP (mtGTP) and PEP cycling. PC (pyruvate carboxylase), PDH (pyruvate dehydrogenase), AcCoA (acetyl CoA), OAA (oxaloacetic acid), SCSGTP (GTP-producing isoform of succinyl CoA synthetase), OxPhos (oxidative phosphorylation). (D) Oxygen consumption of INS1 832/13 cells (n = 6) treated with or without 10 μM FCCP, 100 μM tolbutamide, or 5 μM nimodipine at 2 mM, 5 mM, 7 mM, or 9 mM glucose. (E) Oxygen consumption of INS1 832/13 cells (n = 6) treated with Plasma Membrane Permeabilizer (Perm), ADP (62.5 μM, 125 μM, or 250 μM), 625 μM PEP, and 4 μM FCCP. Oxygen consumption rate, scale bar = 50 pmol/min. (F) Oxygen consumption of INS1 832/13 cells (n = 6) treated with Plasma Membrane Permeabilizer (Perm), ADP (125 μM or 500 μM, for 0 μM PEP condition), PEP (625 μM, 313 μM, 156 μM, 78 μM, or 0 μM) and Antimycin A and Rotenone (A/R, 10/5 μM). Oxygen consumption rate, scale bar = 1 pmol/min. (G) Insulin secretion from PKa- or vehicle-treated control INS1 832/13 cells (Con, n = 12), or INS1 832/13 cells stably overexpressing the ATP and GTP-producing isoforms of succinyl CoA synthetase (SCSATP and SCSGTP, respectively) (n = 6) in response to 9 mM glucose (9G). Data are shown as mean ± SEM. *P < 0.05, **P < 0.01, ***P < 0.001, ****P < 0.0001 by Student’s t-test (B-C), 2-way ANOVA (D), or 1-way ANOVA (G). See also Figure S4.
Figure 7.
Figure 7.. Evidence for a 2-state model of oscillatory β-cell metabolism.
(A-H) Metabolic and electrical oscillations in islet β-cells stimulated with 10 mM glucose. ATP/ADP, calcium, glutamate, lactate, and PKM2 are cytosolic parameters. NAD(P)H, ΔpHm (SypHer mt), and ΔΨm are mitochondrial parameters. Plasma membrane potential (Vm) and potassium conductance (GK) are electrical parameters. Silent phase, white boxes; active phase, shaded boxes. (H) Antiphase oscillations in flux through PDH and PC in INS1 832/13 cells following the addition of 9 mM glucose. (I) Model of oscillatory β-cell metabolism with 2 states (triggering vs. secretory) separated by membrane depolarization. Before depolarization, PK lowers ADP, reducing flux through the ETC (ADP-starved, “State 4-like”) and the TCA cycle while activating the PEP cycle. After PK lowers ADP sufficiently to close KATP channels, workload in the form of ATP hydrolysis restores ADP (e.g. by exocytosis and pumps), increasing flux through the ETC (ADP replete “State 3-like”), the TCA cycle, and glycolysis. Note that recruitable PK isoforms (M2 and L) are active before depolarization, when glycolytic flux is low and the FBP concentration is high.

Comment in

References

    1. Abulizi A, Stark R, Cardone RL, Lewandowski SL, Zhao X, Alves TC, Thomas C, Kung C, Wang B, Siebel S, et al. (2020). Pharmacologic activation of the mitochondrial phosphoenolpyruvate cycle enhances islet function in vivo. BioRxiv 2020.02.13.947630.
    1. Affourtit C, Alberts B, Barlow J, Carré JE, and Wynne AG (2018). Control of pancreatic β-cell bioenergetics. Biochem. Soc. Trans. 46, 555–564. - PubMed
    1. Ainscow EK, and Rutter GA (2002). Glucose-stimulated oscillations in free cytosolic ATP concentration imaged in single islet beta-cells: evidence for a Ca2+-dependent mechanism. Diabetes 51 Suppl 1, S162–170. - PubMed
    1. Alves TC, Pongratz RL, Zhao X, Yarborough O, Sereda S, Shirihai O, Cline GW, Mason G, and Kibbey RG (2015). Integrated, Step-Wise, Mass-Isotopomeric Flux Analysis of the TCA Cycle. Cell Metab. 22, 936–947. - PMC - PubMed
    1. Anastasiou D, Yu Y, Israelsen WJ, Jiang J-K, Boxer MB, Hong BS, Tempel W, Dimov S, Shen M, Jha A, et al. (2012). Pyruvate kinase M2 activators promote tetramer formation and suppress tumorigenesis. Nat. Chem. Biol. 8, 839–847. - PMC - PubMed

Publication types