. 2020 Nov 3;32(5):751-766.e11.
doi: 10.1016/j.cmet.2020.10.006.

Multi-Tissue Acceleration of the Mitochondrial Phosphoenolpyruvate Cycle Improves Whole-Body Metabolic Health

Affiliations

Multi-Tissue Acceleration of the Mitochondrial Phosphoenolpyruvate Cycle Improves Whole-Body Metabolic Health

Abudukadier Abulizi et al. Cell Metab. .

Abstract

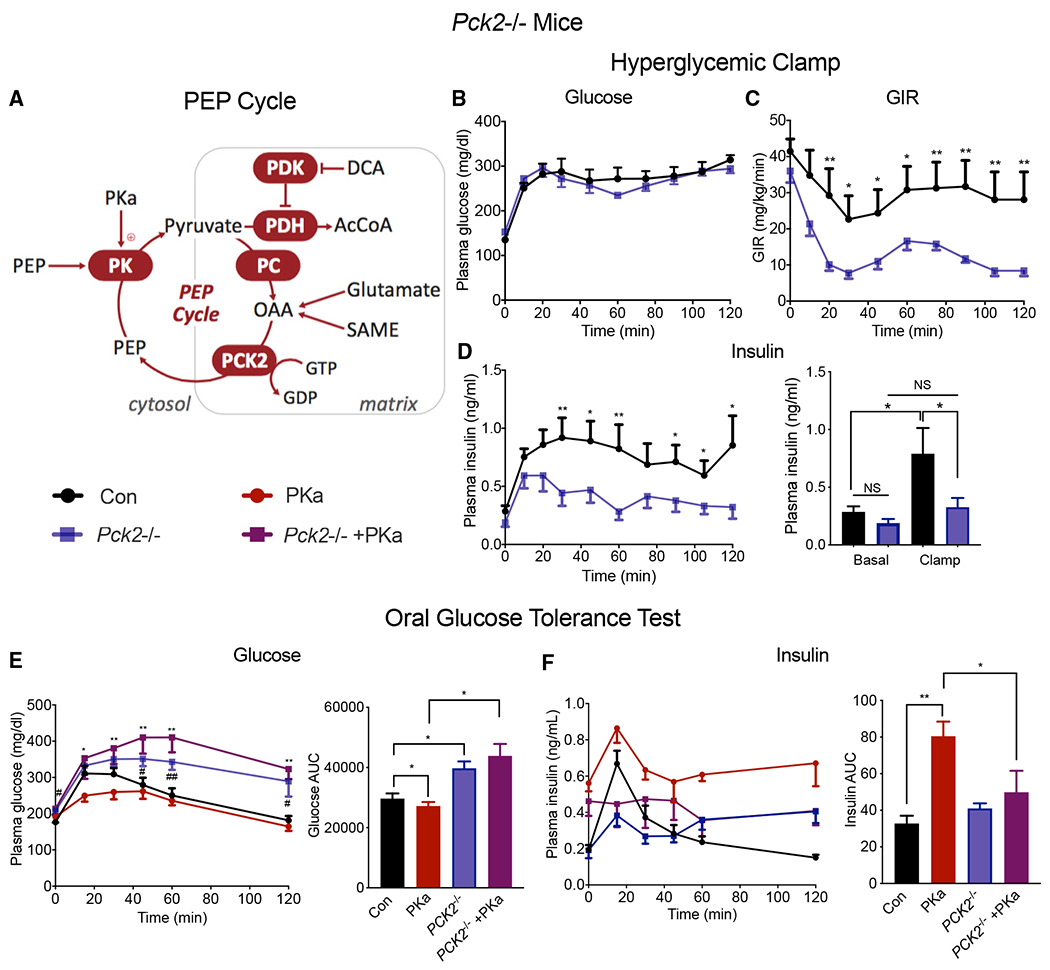
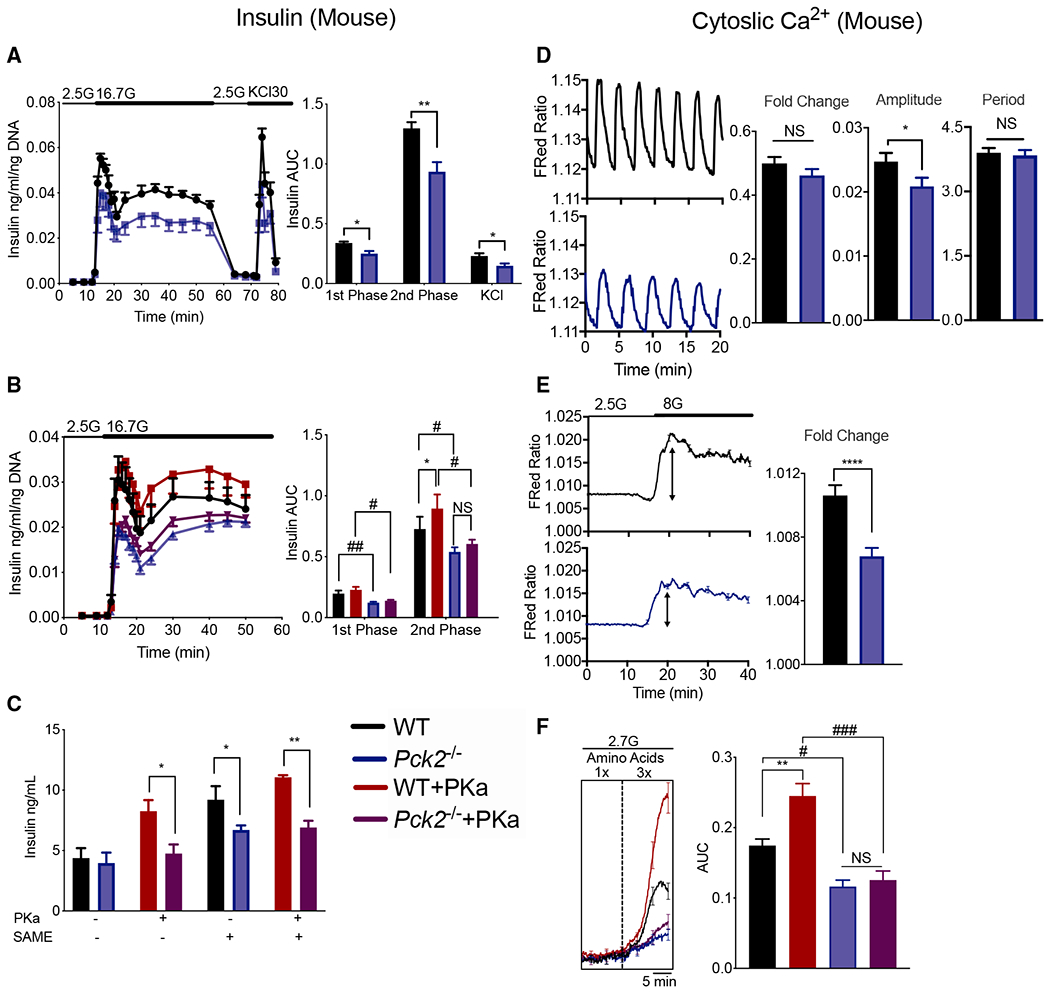
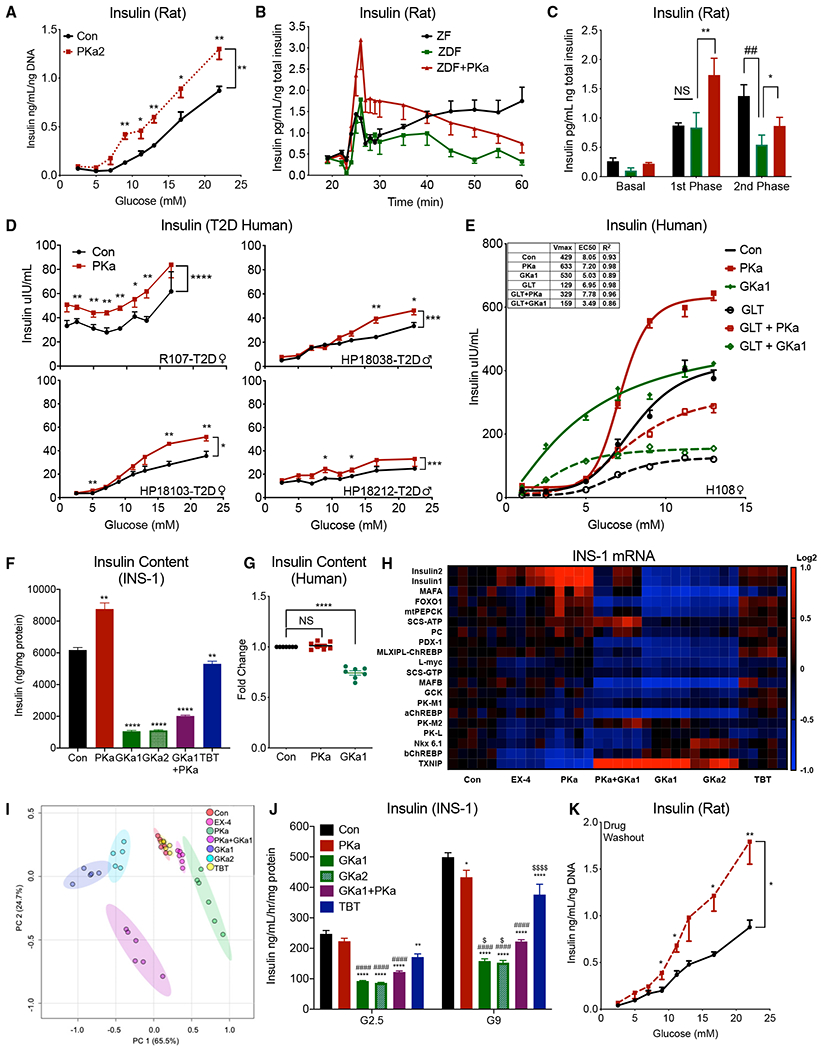
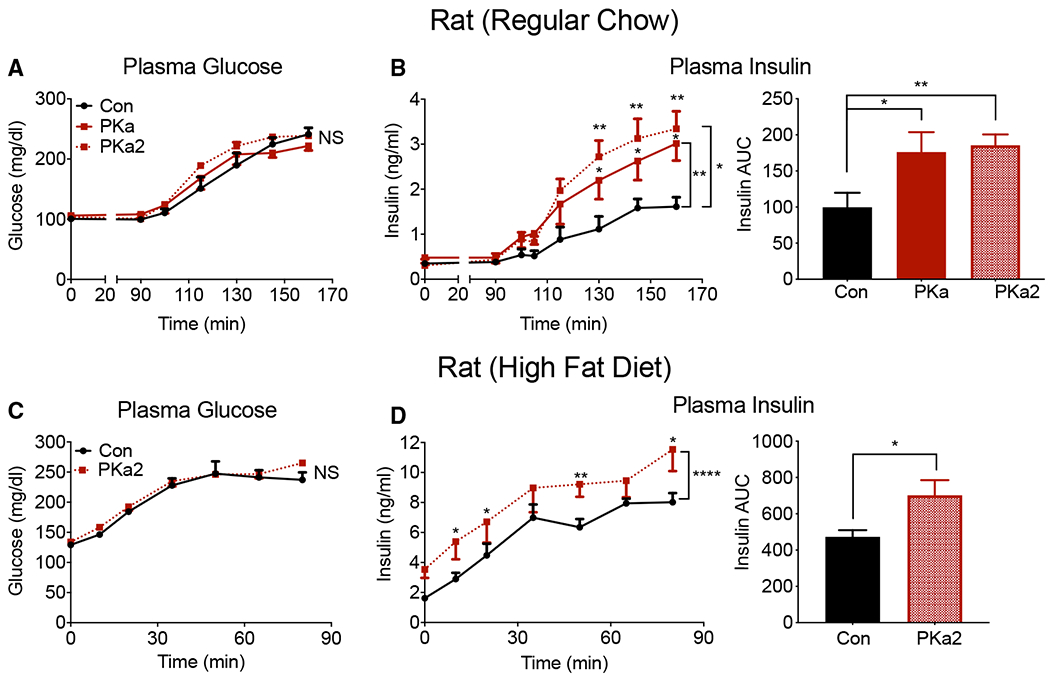
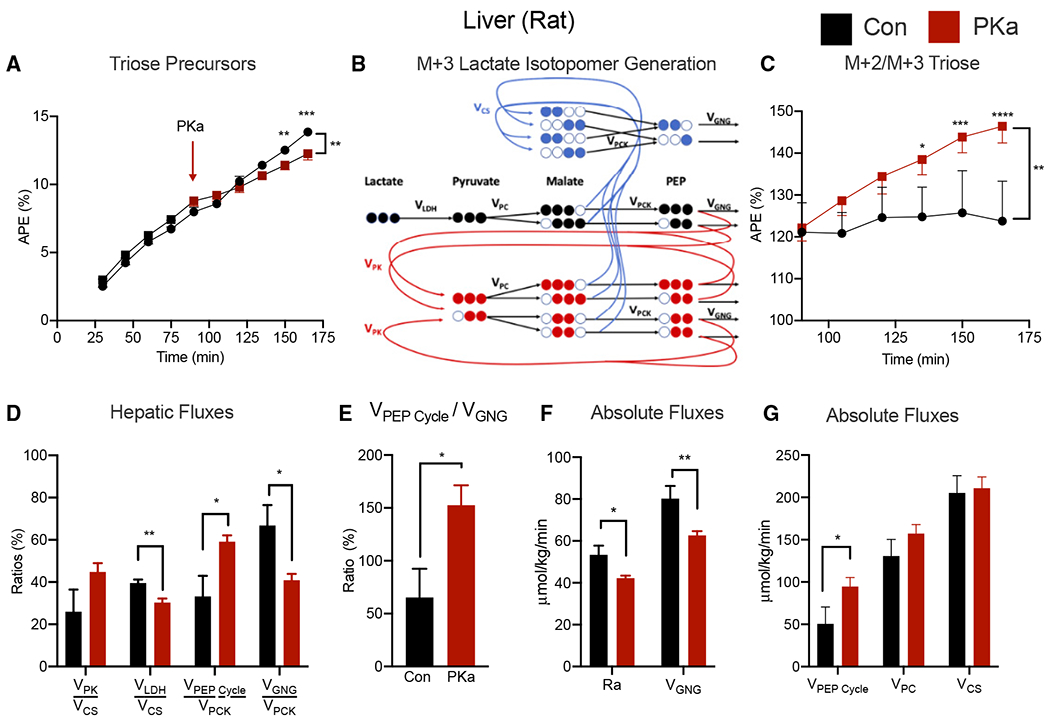
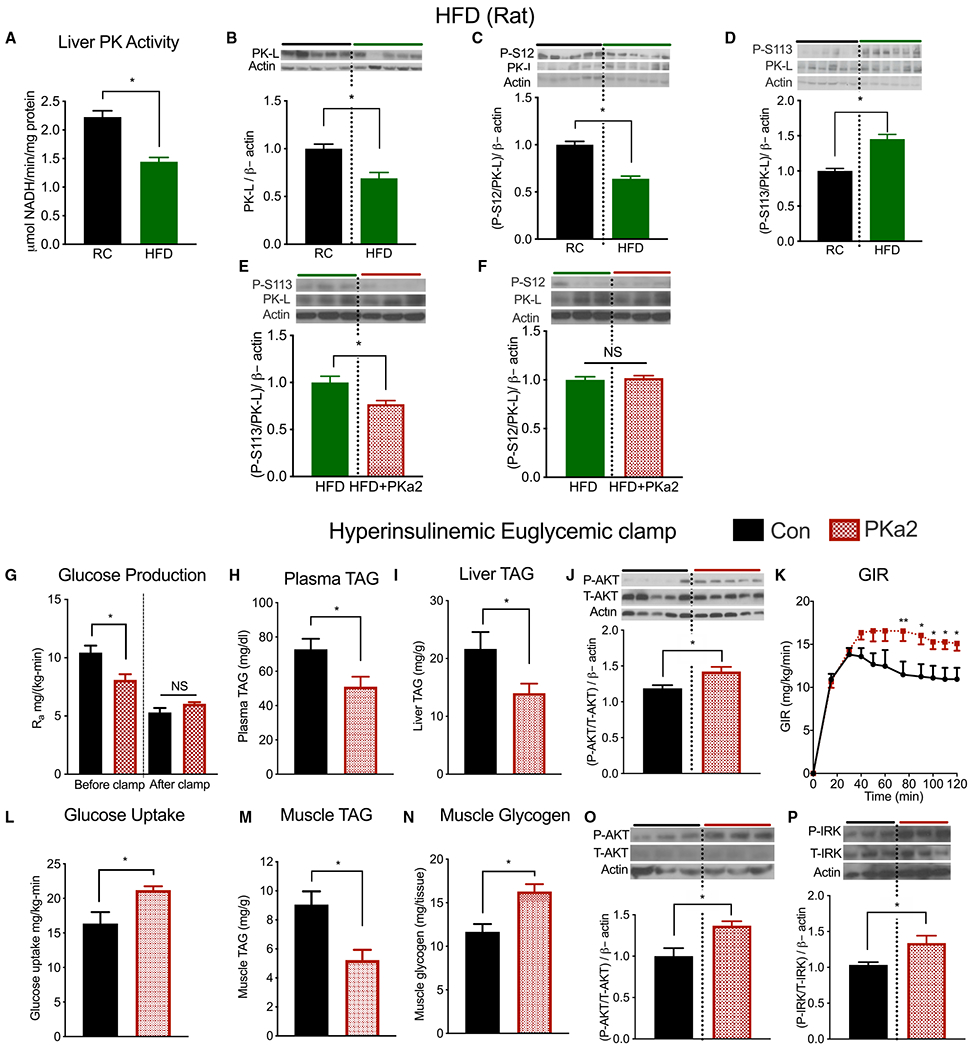
The mitochondrial GTP (mtGTP)-dependent phosphoenolpyruvate (PEP) cycle couples mitochondrial PEPCK (PCK2) to pyruvate kinase (PK) in the liver and pancreatic islets to regulate glucose homeostasis. Here, small molecule PK activators accelerated the PEP cycle to improve islet function, as well as metabolic homeostasis, in preclinical rodent models of diabetes. In contrast, treatment with a PK activator did not improve insulin secretion in pck2-/- mice. Unlike other clinical secretagogues, PK activation enhanced insulin secretion but also had higher insulin content and markers of differentiation. In addition to improving insulin secretion, acute PK activation short-circuited gluconeogenesis to reduce endogenous glucose production while accelerating red blood cell glucose turnover. Four-week delivery of a PK activator in vivo remodeled PK phosphorylation, reduced liver fat, and improved hepatic and peripheral insulin sensitivity in HFD-fed rats. These data provide a preclinical rationale for PK activation to accelerate the PEP cycle to improve metabolic homeostasis and insulin sensitivity.

Keywords: anaplerosis; cataplerosis; fatty liver; human islets; insulin resistance; insulin secretion; mitochondrial GTP; mitochondrial PEPCK; phosphoenolpyruvate cycle; pyruvate kinase.


Conflict of interest statement

Declaration of Interests C.K. is an employee of and stockholder in Agios Pharmaceuticals. R.G.K. has been a paid consultant for Agios Pharmaceuticals. The remaining authors declare no competing interests.

Figures

Figure 1.
Figure 1.. Pck2−/− Is Required for Normal and PK Activator Amplified GSIS In Vivo
(A) Schematic overview of strategies for assessing the OxPhos-independent mitochondrial GTP (mtGTP)-dependent phosphoenolpyruvate (PEP) cycle. Oxidation of pyruvate by pyruvate dehydrogenase (PDH) is inhibited by phosphorylation by PDH kinase (PDK) that is in turn inhibited by dichloroacetic acid (DCA) or by knockout. Anaplerotic synthesis of oxaloacetic acid (OAA) is from pyruvate carboxylase (PC) or via metabolism of succinic acid methyl ester (SAME) or glutamate. OAA cataplerosis of OAA to generate PEP is through the GTP-dependent PCK2 reaction. Cytosolic and mitochondrial PEP are hydrolyzed via pyruvate kinase (PK) that is allosterically enhanced with PK activators. (B and C) Plasma glucose concentrations (B) and glucose infusion rate (GIR) (C) in overnight fasted mice during a hyperglycemic clamp. (D) Insulin (left) during same clamp study and (right) before clamp (basal), and average plasma insulin levels of clamp (105–120 min). (E) Glucose homeostasis in overnight fasted WT (black), WT + PKa (red), Pck2−/− (blue), and Pck2−/− + PKa (purple) following an OGTT 1 h after PKa (50 mg/kg) injection. Area under the curve (AUC) plasma glucose following an OGTT. (F) Stimulated and AUC insulin from the OGTT in (E) in mice fasted overnight. Data are represented as mean ± SEM (OGTT, n = 7–8 per group; hyperglycemic clamp, n = 8 per group). Statistical comparisons (*p < 0.05, **p < 0.01; NS, not significant) made by Student’s t test.
Figure 2.
Figure 2.. PCK2 Is Required for the Anaplerosis and PK-Dependent Secretory Response
(A) Phasic insulin secretion during perifusion from 2.5 to 16.7 mM glucose (G) of islets followed by 30 mM KCI stimulation from control (wild type; WT) and Pck2−/− (n = 4). (B) Phasic insulin secretion during perifusion from 2.5 to 16.7 mM glucose of islets from control (WT) and Pck2−/− with or without treatment with 10 μM PKa (Tepp46) (n = 4). (C) Insulin secretion from isolated, dispersed, and reaggregated islets ± 10 μM PKa ± 10 mM SAME (n = 4). (D and E) Cytosolic calcium recordings, in the presence of indicated glucose and amino acids concentrations from control (black) and Pck2−/− (blue) islets. (D) Detrended calcium traces, fraction of time spent in the active phase (plateau fraction), average calcium amplitude, and period of time from islets held at 8 mM glucose in physiologic amino acids (n = 3 mice/group). (E) Ca2+ response following an acute increase of glucose in islets from WT and Pck2−/− mice. (F) Cytosolic Ca2+ in response to one (1×) and three times physiologic (3×) amino acids at 2.7 mM glucose ± 10 μM TEPP46 (PKa) (n = 8). Scale bar, 5 min. Data are represented as mean ± SEM. Statistical comparisons made by Student’s t test and two-way ANOVA (*p < 0.05, **p < 0.01, ***p < 0.001, #p < 0.05, ##p < 0.01).
Figure 3.
Figure 3.. PK Activation Improves Insulin Secretion in Rat and Human Islet Models of Insulin Resistance and Type 2 Diabetes
(A) Insulin response to glucose concentration in re-aggregated islets from 4-week HFD-fed rats with twice daily peanut butter vehicle without (black) or with 25 mg/kg PKa2 (red) (n = 4) but without exposure to drug for 16 h. (B and C) Phasic insulin secretion from perifused islets (2.5–16.7 mM glucose) from regular chow (ZF, black) and high-fatfed (ZDF) Zucker rats without (green) and with (red) 10 μM PKa (n = 4). (D) Insulin response to glucose concentration in islet reaggregates from four type 2 diabetes islet donors (R107, HP18038, HP18103, and HP18212) treated with 10 μM PKa. (E) Insulin response to glucose concentration from healthy human reaggregated islets treated for 72 h with BSA control (closed) versus glucolipotoxic (GLT, 20 mM glucose and 1 mM 2:1 oleate:palmitate) (open) conditions without (black circles) or with 10 μM PKa (red squares) or 10 μM GKa (green diamonds). (F) Insulin content from INS-1 cells treated with 10 μM PKa, 10 μM GKa1, 100 nM GKa2, the combination of PKa and GKa1, or 100 μM TBT for 72 h. (G) Insulin content from 7 healthy human donors treated for 72 h in culture with 10 μM PKa or 10 μM GKa1. (H and I) Transcriptional profiling of INS-1 cells treated with 10 μM GKa1, 100 nM GKa2, 10 μM PKa, 10 nM Ex-4, or 100 μM TBT for 72 h. (J) INS cells were treated for 72 h with 10 μM GKa1, 100 μM GKa2, 10 μM PKa, and 100 mM TBT, then drug was washed out prior to performing GSIS assays. (K) Islets were isolated from combined 4-week HFD- and PKa2-treated rats and GSIS was performed. Data are represented as mean ± SEM. Statistical comparisons made by Student’sttest and two-way ANOVA (*with versus without PKa; #ZF versus ZDF or control versus GLT; *,#p < 0.05, **,##p < 0.01).
Figure 4.
Figure 4.. PK Activation Improves GSIS in Regular Chow and HFD-Fed Rats
(A and B) Plasma glucose (A) and plasma insulin (B), and insulin AUC after primed-continuous intravenous infusion (t = 0) followed by hyperglycemic ramp (t = 90–160 min) of PKa1 and PKa2 versus vehicle in overnight fasted regular chow-fed rats (n = 6–7 per group). (C and D) Plasma glucose (C) and plasma insulin (D), and insulin AUC in 4-week HFD-fed rats with twice daily administration of peanut butter vehicle without (black) or with PKa2 (red), then subjected to a hyperglycemic ramp after an overnight fast without subsequent drug treatment (n = 6–7 per group). Statistical comparisons made by Student’s t test and two-way ANOVA (*p < 0.05, **p < 0.01).
Figure 5.
Figure 5.. PK Activation Short-Circuits Gluconeogenesis and Increases RBC Glucose Turnover
(A) Glucose production from isolated hepatocytes treated with the indicated concentration of PKa (n = 6). (B) Oxygen consumption rates of hepatocytes treated with 10 μM PKa under basal conditions followed by pyruvate (1 mM):lactate(9 mM) substrate addition, 5 μM oligomycin, 10 μM FCCP, and 5 μM rotenone (n = 6). (C and D) Liquid chromatography-tandem mass spectrometry (LC-MS/MS) measured absolute PEP concentration from isolated hepatocytes treated with or without 10 μM PKa and ratio of PEP to pyruvate calculated (n = 6). (E) Plasma glucose during acute PKa infusion. (F) Plasma lactate concentration of acutely PKa-infused overnight fasted chow-fed rats. (G) Plasma glucose M+6 enrichment of overnight fasted regular chow-fed rats infused with PKa and [U 13C6]-D-glucose tracer (n = 6–7). (H) Endogenous glucose production rate from overnight fasted chow-fed Sprague-Dawley rats acutely infused with PKa. (I) The enrichments of M+2 glutamine, M+3 alanine, and M+3 lactate by their circulating precursor (M+6 glucose). (J) Ratio of plasma lactate enrichment (M+3) to total plasma glucose enrichment (M+6) in rats treated with or without PKa. (K) Ratio of red blood cell (RBC) lactate (M+3) to plasma glucose (M+6) in rats treated with and without PKa. (L) Ratio of RBC lactate enrichment (M+3) to plasma lactate enrichment. Data are represented as mean ± SEM. Statistical comparisons made by Student’s t test and two-way ANOVA (*p < 0.05, **p < 0.01, ***p < 0.001) (n = 6–7) for all infusion studies.
Figure 6.
Figure 6.. PK Activation Reduces EGP In Vivo
(A) Isotopologues of the mitochondrial-derived those precursors from gluconeogenic tissues deconvolved via a mass isotopomer distribution analysis (MIDA) of glucose isotopologues. (B) Schematic for stable isotope interpretation: filled circles are 13C and open circles are 12C. M+3 lactate (black) enters the mitochondria, and gluconeogenic PEP isotopomers are generated as a function of the relative contributions of TCA cycling (blue), PEP cycling (red), and PC. (C) M+2/M+3 those ratio increased following PKa administration. (D and E) TCA cycle flux (VCS), rates of net LDH metabolism (VLDH), rates of PEP cycling (VPEP Cycling/VPCK), and mitochondrial gluconeogenic flux (VGNG/VPCK) are shown. (F and G) Absolute in vivo rates of cycling and gluconeogenic fluxes were determined (n = 5). Data are represented as mean ± SEM. Statistical comparisons made by Student’s t test and two-way ANOVA (*p < 0.05, **p < 0.01, ***p < 0.001).
Figure 7.
Figure 7.. Chronic PKa during HFD Feeding Improves Insulin Sensitivity and Reduces Ectopic Fat
(A and B) Liver pyruvate kinase (PKL) activity and protein expression of HFD-fed and regular chow (RC)-fed rats. (C) PKL phosphorylation (S12) in liver tissue of HFD-fed and RC-fed mice. (D) PKL phosphorylation at (S113) in liver tissue of HFD-fed and RC-fed mice. (E) PKL phosphorylation (S113) in liver tissue of control (HFD) versus chronic PKa2-treated rats. (F) PKL phosphorylation (S12) in liver tissue of control (HFD) versus chronic PKa2-treated rats. (G) Endogenous glucose production. (H and I) Plasma TAG content of 4-week chronic PKa2-treated HFD-fed rats (H) and liver TAG content (I) (n = 8). (J) Liver AKT phosphorylation after 4-week PKa2 treatment of HFD-fed rat (n = 5). (K) GIR during the hyperinsulinemic-euglycemic clamp. (L) Insulin stimulated whole-body glucose uptake. (M and N) Muscle TAG (M) and glycogen (N) content. (O and P) Muscle AKT and insulin receptor kinase (IRK) tyrosine phosphorylation after 4-week PKa2 treatment of HFD-fed rat (n = 6); representative data shown. n = 4, fatty acid turnover. n = 7–8, hyperinsulinemic clamp. Data are represented as mean ± SEM. Data analyzed by two-tailed unpaired Student’s t test and two-way ANOVA.

Comment in

References

    1. Akhmedov D, De Marchi U, Wollheim CB, and Wiederkehr A (2012). Pyruvate dehydrogenase E1α phosphorylation is induced by glucose but does not control metabolism-secretion coupling in INS-1E clonal β-cells. Biochim. Biophys. Acta 1823, 1815–1824. - PubMed
    1. Alves TC, Pongratz RL, Zhao X, Yarborough O, Sereda S, Shirihai O, Cline GW, Mason G, and Kibbey RG (2015). Integrated, step-wise, mass-isotopomeric flux analysis of the TCA cycle. Cell Metab. 22, 936–947. - PMC - PubMed
    1. Anastasiou D, Yu Y, Israelsen WJ, Jiang J-K, Boxer MB, Hong BS, Tempel W, Dimov S, Shen M, Jha A, et al. (2012). Pyruvate kinase M2 activators promote tetramer formation and suppress tumorigenesis. Nat. Chem. Biol 8, 839–847. - PMC - PubMed
    1. Boxer MB, Jiang JK, Vander Heiden MG, Shen M, Skoumbourdis AP, Southall N, Veith H, Leister W, Austin CP, Park HW, et al. (2010). Evaluation of substituted N,N′-diarylsulfonamides as activators of the tumor cell specific M2 isoform of pyruvate kinase. J. Med. Chem 53, 1048–1055. - PMC - PubMed
    1. Cline GW, Lepine RL, Papas KK, Kibbey RG, and Shulman GI (2004). 13C NMR isotopomer analysis of anaplerotic pathways in INS-1 cells. J. Biol. Chem 279, 44370–44375. - PubMed

Publication types