. 2020 Dec 15:409:115307.
doi: 10.1016/j.taap.2020.115307. Epub 2020 Nov 2.

Arsenic induced redox imbalance triggers the unfolded protein response in the liver of zebrafish

Affiliations

Arsenic induced redox imbalance triggers the unfolded protein response in the liver of zebrafish

Patrice Delaney et al. Toxicol Appl Pharmacol. .

Abstract

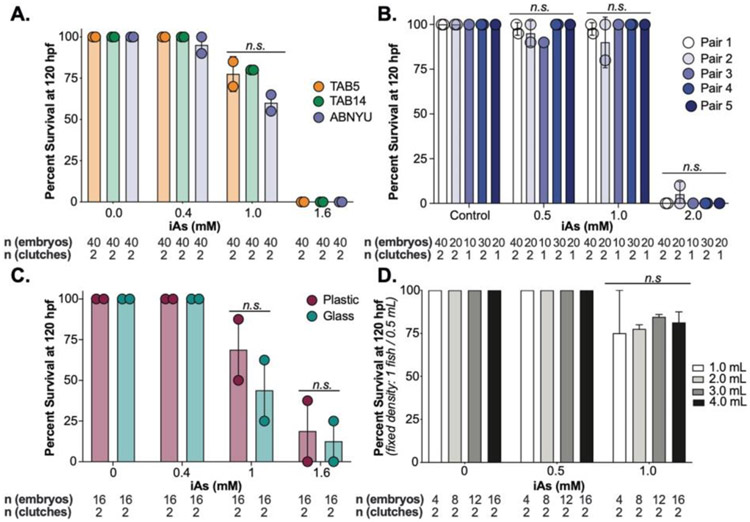
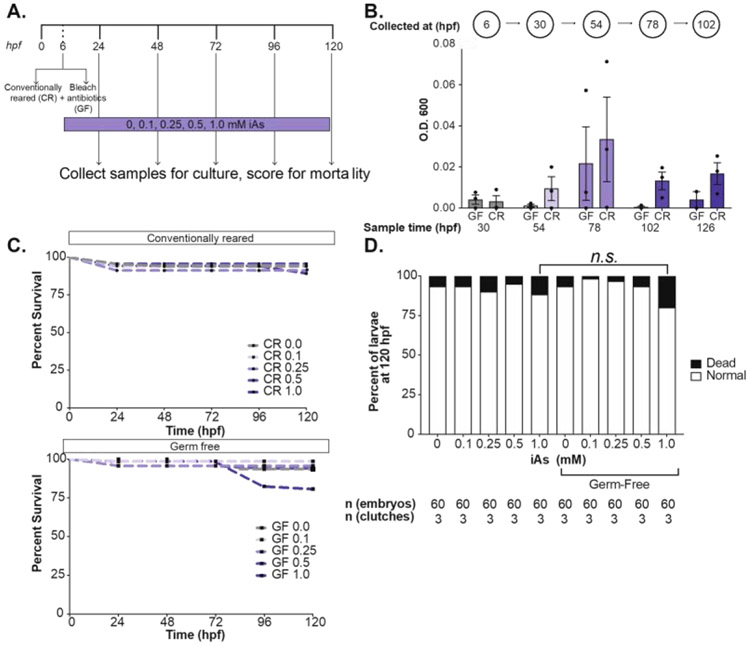
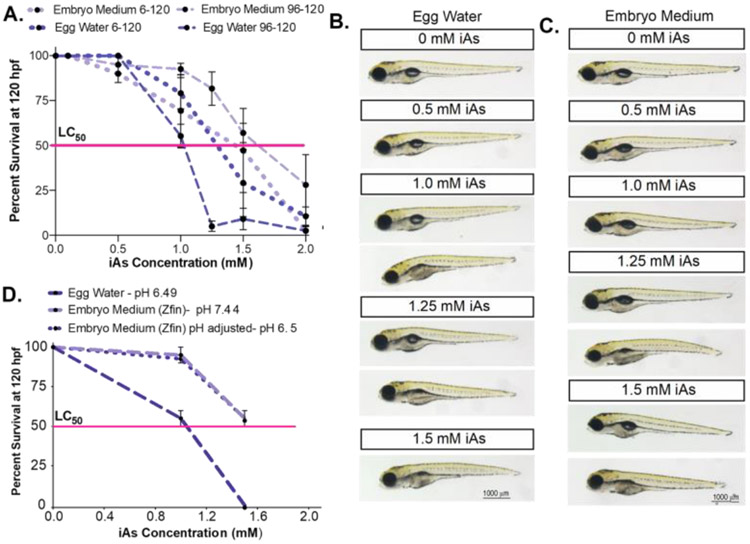
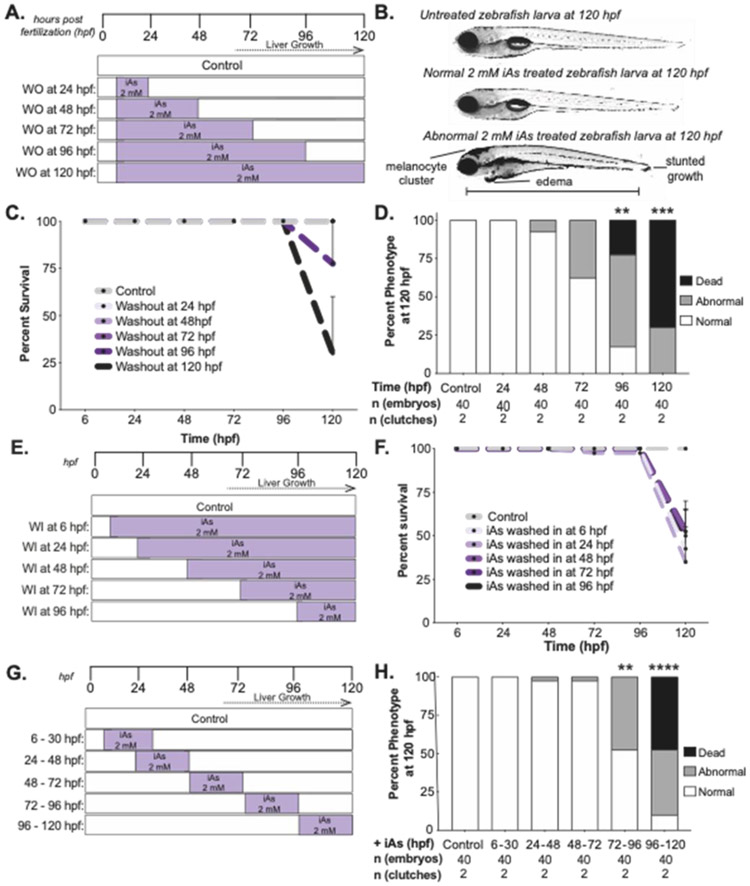
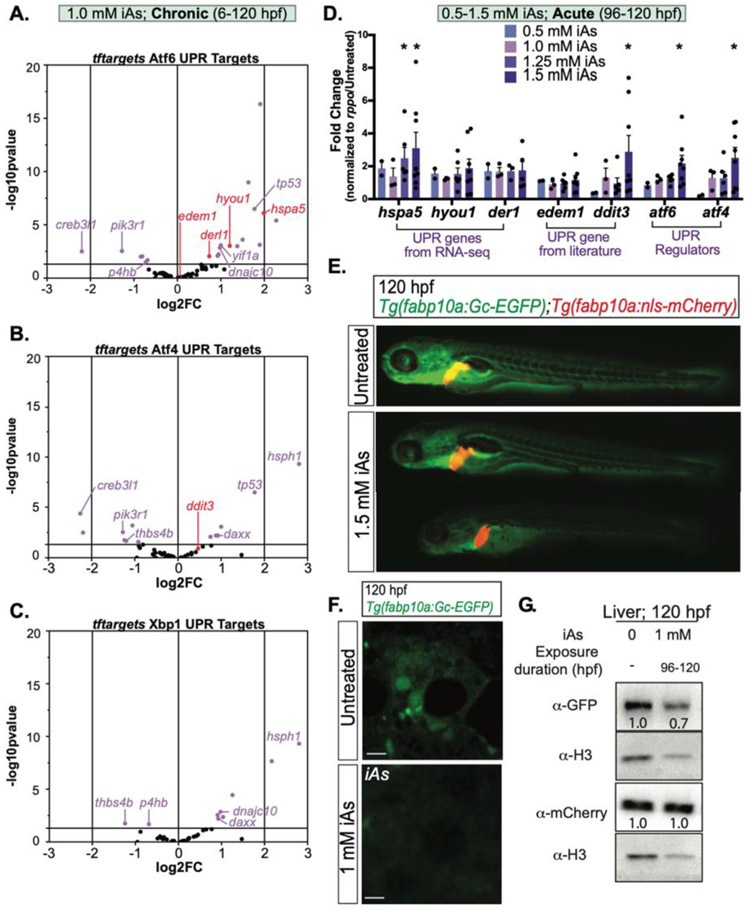
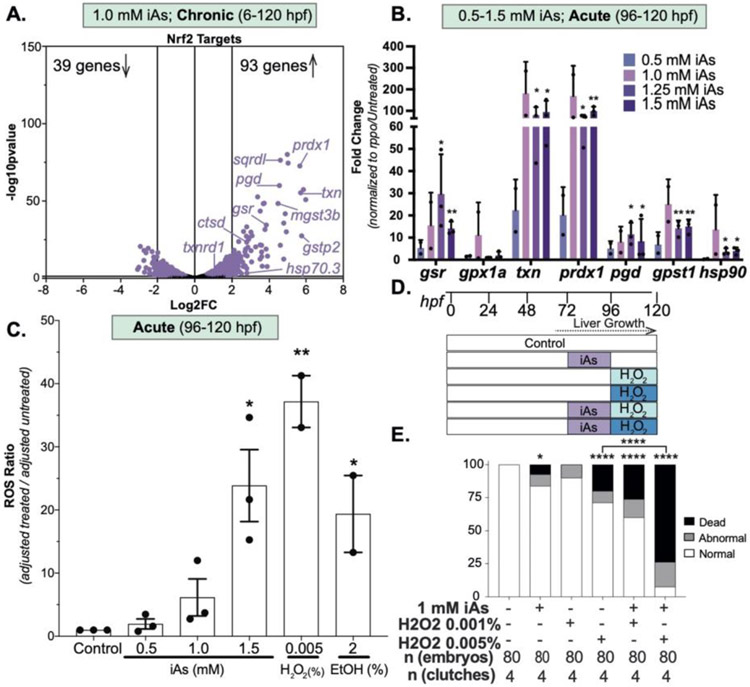
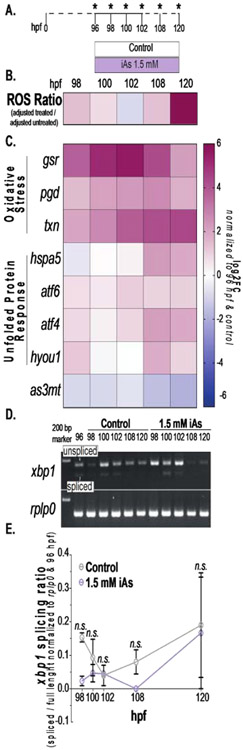
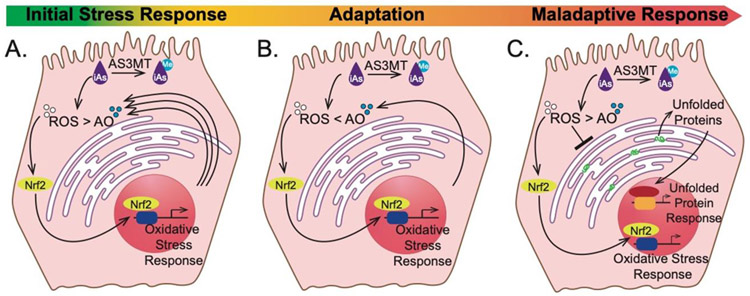
Inorganic arsenic (iAs) is one of the most endemic toxicants worldwide and oxidative stress is a key cellular pathway underlying iAs toxicity. Other cellular stress response pathways, such as the unfolded protein response (UPR), are also impacted by iAs exposure, however it is not known how these pathways intersect to cause disease. We optimized the use of zebrafish larvae to identify the relationship between these cellular stress response pathways and arsenic toxicity. We found that the window of iAs susceptibility during zebrafish development corresponds with the development of the liver, and that even a 24-h exposure can cause lethality if administered to mature larvae, but not to early embryos. Acute exposure of larvae to iAs generates reactive oxygen species (ROS), an antioxidant response, endoplasmic reticulum (ER) stress and UPR activation in the liver. An in vivo assay using transgenic larvae expressing a GFP-tagged secreted glycoprotein in hepatocytes (Tg(fabp10a:Gc-EGFP)) revealed acute iAs exposure selectively decreased expression of Gc-EGFP, indicating that iAs impairs secretory protein folding in the liver. The transcriptional output of UPR activation is preceded by ROS production and activation of genes involved in the oxidative stress response. These studies implicate redox imbalance as the mechanism of iAs-induced ER stress and suggest that crosstalk between these pathways underlie iAs-induced hepatic toxicity.

Keywords: Arsenic; ER stress; Liver; Oxidative stress; Unfolded protein response; Zebrafish.


Conflict of interest statement

The authors declare no conflict of interest.

Declaration of interests

The authors declare that they have no known competing financial interests or personal relationships that could have appeared to influence the work reported in this paper.

Figures

Figure 1.
Figure 1.. iAs induced toxicity in zebrafish is independent of genetic background, plastic interactions, and volume.
A. Survival of zebrafish from TAB5 (orange), TAB14 (green) and ABNYU (blue) genetic background at 120 hpf after treatment from 6-120 hpf with 0, 0.4, 1.0 and 1.6 mM of iAs. Dots represent individual clutch values and bars indicate the mean between multiple clutches, n.s. indicates not significance, 2-way ANOVA. B. Survival analysis of single pairs of ABNYU zebrafish pairs treated with iAs (0 – 2.0 mM). No single pair exhibited resistance or sensitivity to iAs (n.s. = not significant per 2-way ANOVA). C. Survival analysis of zebrafish reared in plastic (maroon) and glass (teal) containers. n.s. indicates not significant by 2-way ANOVA. D. Survival analysis of zebrafish reared in a fixed density (1 fish/0.5 mL) in volumes ranging from 1-4 mL and exposure to iAs (6-120 hpf, 0-1 mM). n.s. indicates not significant, 2-way ANOVA. All experiments were performed in egg water. Error bars represent standard error mean (SEM).
Figure 2.
Figure 2.. iAs toxicity is independent of microbiome.
A. Schematic of germ-free treatment strategy, whereby embryos were split at 6 hpf and bleached in either antibiotic embryo medium or conventional embryo medium before treatment with 0.1, 0.25, 0.5, and 1.0 mM iAs from 6-120 hpf. (CR: Conventionally-Reared, GF: Germ- Free). B. Spectrophotometer measurement of bacterial density (OD600) in each medium each day. C. Survival analysis of zebrafish treated with iAs as outlined in A. Fish were scored daily for mortality (n= 60, 3 clutches). D. Weighted average of percent of death and normal larvae per treatment condition (n= 60, 3 clutches). All experiments were performed in egg water. Error bars represent SEM.
Figure 3.
Figure 3.. iAs toxicity is dependent on the rearing medium but independent of pH changes
A. Survival curve of zebrafish larvae reared in embryo medium (pH 7.4, + Ca and Mg) or egg water (not buffered, mix of ocean salts) exposed to iAs (0-2.0 mM) from 6-120 hpf and 96-120 hpf. Pink line indicates the lethal concentration that causes 50% death (LC50). (n = 2-4 clutches, 20 fish per clutch) B & C. Representative images of zebrafish at 120 hpf reared in egg water (B) or embryo medium (C) and exposed to different concentrations of iAs. D. Survival curve of zebrafish larvae reared in egg water (pH 6.49), embryo medium (pH 7.4) or embryo medium with pH adjusted (pH 6.49) exposed to iAs (0-1.5 mM) from 96-120 hpf. Pink line indicates the lethal concentration that causes 50% death (LC50).(n = 2 clutches, 20 fish per clutch). Error bars represent SEM.
Figure 4.
Figure 4.. Larval recovery from iAs treatment is decreased after liver bud formation.
A. iAs washout (WO) treatment strategy, whereby all embryos are treated with 2 mM iAs at 6 hpf and iAs is washed out at 24-hour intervals. Animals were monitored until 120 hpf. B. Brightfield images of representative untreated control larvae and those exposed to 2 mM iAs from 6-120 hpf. Scale bar represents 3100 μm. C. Survival of zebrafish treated with iAs as outlined in A. Embryos were scored daily for mortality (n= 40, 2 clutches). Error bars represent standard error mean (SEM). D. Weighted average of percent of death, abnormal and normal larvae per treatment condition (n= 40, 2 clutches). ** and *** indicates p-value <0.005 and <0.0005, 2-way ANOVA. E. iAs wash in (WI) treatment strategy, whereby 2 mM iAs was added at 24-hour intervals and retained in the culture media until 120 hpf. F. Survival of larvae treated with iAs as outlined in E. Larvae were scored daily for mortality (n= 40, 2 clutches). Error bars represent standard error mean (SEM). G. iAs treatment scheme to determine the developmental window of toxicity by 24-hour interval exposure. H. Weighted average of percent of death, abnormal and normal larvae per treatment interval (n= 40, 2 clutches). ** and **** indicates p-value <0.005 and p-value <0.0001, 2-way ANOVA.
Figure 5.
Figure 5.. iAs treatment induces ER stress in zebrafish livers.
A-C. Expression of UPR genes that are putative targets of Atf6 (A), Atf4 (B) and Xbp1 (C) based on RNA-seq of zebrafish larval livers treated from 6-120 hpf with 1 mM iAs. Target lists were derived from R package tftargets. Purple dots indicate p-value <0.05. D. UPR gene expression derived from qPCR analysis on pools of 5 larval zebrafish livers per clutch treated with 0, 0.5, 1.0, 1.25, and 1.5 mM iAs from 96-120 hpf. Each black dot indicates mean value per clutch. * p-value <0.05, determined by two-tailed, one-sided t-test on dCt values. Error bars represent standard error mean (SEM). E. Representative images of 120 hpf larvae expressing both Gc-GFP and nuclear localized mCherry under a hepatocyte specific promoter (Tg(fabp10a: Gc-EGFP;fabp10a:nls-mCherry)). Larvae were treated with 1.5 mM iAs from 96-120 hpf. F. Confocal images of hepatocytes from Tg(fabp10a:Gc-EGFP) larvae that were untreated (top) or treated with 1 mM iAs from 96 – 120 hpf in egg water. Scale bar is 3 μm. G. Western blot of GFP, mCherry and H3 (control) in the livers of 120 hpf Tg(fabp10a: Gc-EGFP;fabp10a:nls-mCherry) larvae exposed to 1 mM iAs in egg water from 96-120 hpf compared to untreated siblings.
Figure 6.
Figure 6.
iAs treatment induces the oxidative stress response in zebrafish livers. A. Gene expression of Nrf2 putative targets derived from R package tftargets. Well characterized Nrf2 targets are indicated. Each dot indicates an individual gene based on RNAseq from zebrafish larval livers treated from 6 to 120 hpf with 1 mM iAs. Purple dots indicate p-value <0.05. B. Oxidative stress gene expression derived from qPCR analysis on pools of 5 larval zebrafish livers treated with 0, 0.5, 1.0, 1.25 and 1.5 mM iAs from 96 to 120 hpf per clutch. Each bar indicates mean value across clutches. * p-value <0.05 and ** p-value <0.005 determined by two-tailed, one-sided t-test on dCt values Error bars represent the SEM. C. Samples were treated with 0, 0.5, 1.0, 1.5 mM iAs, or 0.005% H2O2 or 2% ethanol from 96 to 120 hpf. Ratio of treated:controls, with blank values subtracted are displayed, with the bar marking the median values from 2 to 3 clutches (20 fish per condition); error bars indicating the SEM. * and ** indicate p-value <0.05 and <0.005 by Student’s t-test. D. iAs preatment strategy, whereby 1 mM iAs is added to the larvae culture from 72 to 96 hpf, washed out at 96 hpf and a subset were treated with H2O2 from 96 to 120 hpf. All conditions are scored at 120 hpf and carried out using egg water. E. Weighted average of percent of death, abnormal and normal larvae per treatment condition (n = 40, 2 clutches). * and **** indicate p-value <0.05 and <0.0001, Fisher’s exact test.
Figure 7.
Figure 7.. iAs treatment induces oxidative stress prior to the unfolded protein response in larval livers.
A. Schematic of iAs time course treatment strategy. Pools of 5 livers from control and 1.5 mM iAs treated larvae were collected at indicated timepoints. B. Heatmap of ROS ratio scores (adjusted to blank) between 1.5 mM iAs treated and controls (data generated from 2 clutches, 20 fish per condition). C. Heat-map of key oxidative stress response genes (gsr, pgd, and txn) and UPR (hspa5, aft6, atf4, and hyou1) and iAs metabolism (as3mt) gene expression over time from qPCR. Log2FC was calculated using the log2(ΔΔCT) normalized to 96 hpf and untreated control siblings (data generated from 4 clutches). D. Gel elec-trophoresis images of xbp1 splicing (top) and rplp0 (bottom) on control and 1.5 mM iAs treated zebrafish liver cDNA from time course (A). E. Quantification of spliced xbp1 ratio to unspliced xbp1 normalized to rplp0 and 96 hpf. Error bars represent standard error mean (SEM). n.s. indicates not significance, 2- way ANOVA.
Figure 8.
Figure 8.. iAs induced redox imbalance triggers oxidative stress followed by UPR.
Working model of the hepatocyte response to iAs challenge: iAs (purple) shifts the redox balance by accumulation of ROS (white) due to metabolism (As3mt) and direct depletion of antioxidants (AO; blue) through thiol binding. To alleviate the imbalance, the oxidative response is initiated through Nrf2 to increase the antioxidant capacity of the hepatocytes (A). This is followed by an influx of antioxidants that allows for adaptation to the initial oxidative stress response where the hepatocytes are able to combat iAs-induced ROS production (B). Prolonged exposure shifts the response from adaptation to maladaptation, as the hepatocytes continue accumulating more ROS. This leads to accumulation of unfolded proteins (green) in the ER, which triggers the UPR in parallel to the oxidative response (C).

Similar articles

Cited by

References

    1. Adeyemi JA, da Cunha Martins-Junior A, Barbosa F Jr., 2015. Teratogenicity, genotoxicity and oxidative stress in zebrafish embryos (Danio rerio) co-exposed to arsenic and atrazine. Comp Biochem Physiol C Toxicol Pharmacol 172-173, 7–12. - PubMed
    1. Ahamed M, Akhtar MJ, Khan MAM, Alrokayan SA, Alhadlaq HA, 2019. Oxidative stress mediated cytotoxicity and apoptosis response of bismuth oxide (Bi2O3) nanoparticles in human breast cancer (MCF-7) cells. Chemosphere 216, 823–831. - PubMed
    1. Arteel GE, Guo L, Schlierf T, Beier JI, Kaiser JP, Chen TS, Liu M, Conklin DJ, Miller HL, von Montfort C, States JC, 2008. Subhepatotoxic exposure to arsenic enhances lipopolysaccharide-induced liver injury in mice. Toxicol Appl Pharmacol 226, 128–139. - PMC - PubMed
    1. Bali İ, Bilir B, Emir S, Turan F, Yılmaz A, Gökkuş T, Aydin M, 2016. The effects of melatonin on liver functions in arsenic-induced liver damage. Ulus Cerrahi Derg 32, 233–237. - PMC - PubMed
    1. Bambino K, Zhang C, Austin C, Amarasiriwardena C, Arora M, Chu J, Sadler KC, 2018. Inorganic arsenic causes fatty liver and interacts with ethanol to cause alcoholic liver disease in zebrafish. Disease Models &amp; Mechanisms 11, dmm031575. - PMC - PubMed

Publication types