. 2020 Nov 2;8(11):1717.
doi: 10.3390/microorganisms8111717.

The Domestic Environment and the Lung Mycobiome

Affiliations

The Domestic Environment and the Lung Mycobiome

Esther Rubio-Portillo et al. Microorganisms. .

Abstract

This study analyzes the relationship between the mycobiome of the Lower Respiratory Tract (LRT) and the fungi in the domestic environment. Samples studied consisted of Broncho-Alveolar Lavage (BAL) from 45 patients who underwent bronchoscopy for different diagnostic purposes, and dust and air from the houses (ENV) of 20 of them (44.4%). Additionally, five bronchoscopes (BS) were also analyzed and negative controls were included for every procedure. All samples were processed for DNA extraction and cultures, which were performed in Sabouraud Dextrose and Potato Dextrose Agar. The fungal Internal Transcribed Spacer (ITS2) was sequenced by the Solexa/Illumina system and sequences were analyzed by QIIME 1.8.0 and compared with the UNITE Database for identification. The similarity between the two fungal communities (BAL and ENV) for a specific patient was assessed via the percentage of coincidence in the detection of specific operational taxonomic units (OTUs), and about 75% of co-occurrence was detected between the mycobiome of the LRT and the houses. Cultures confirmed the presence of the core mycobiome species. However, the low rate of isolation from BAL suggests that most of its mycobiome corresponds to non-culturable cells. This likely depends on the patient's immune system activity and inflammatory status.

Keywords: bronco-alveolar lavage; fungi; house dust; lower respiratory tract; mycobiome; mycobiota.


Conflict of interest statement

The authors declare no conflict of interest. The funders had no role in the design of the study, in the collection, analyses, or interpretation of data, in the writing of the manuscript, or in the decision to publish the results.

Figures

Figure 1
Figure 1
Distribution of patients according to the clinical situation that indicated the bronchoscopy. Others included: Wegener syndrome, dysnea, thymoma, TBC sequels, atelectasis, lung infiltrate, tracheal stenosis, Hodking and and Non-Hodgkin lymphoma, COPD, and cough.
Figure 2
Figure 2
Fungal diversity in the studied simples. (A) Representation of the number of different OTUs detected in each sample. (B) Shannon-Wiener value for BAL and ENV samples. (C) Beta diversity. Bray-Curtis dissimilarity coefficient scores PCoA.
Figure 3
Figure 3
Distribution of OTUs at a phylum level in each BAL, BS, and ENV samples. Upper blue arrows point at BS samples.
Figure 4
Figure 4
Global distribution of putative fungal species detected in BAL, ENV, and BS samples. The intensity of the color corresponds with the number of sequences in a logarithmic scale. The left column shows the identification number of each specific OTU and their correspondent species are in the right column.
Figure 5
Figure 5
Presence of the six most prevalent OTUs in BAL and ENV samples. The relative presence is represented by the percentage of samples in which they were detected and the abundance as the mean value of sequences per sample.
Figure 6
Figure 6
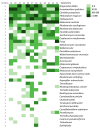
Distribution of fungal species detected in BAL samples clustered by the underlying disease or symptoms (others corresponded to: Thymoma, TBC sequels, Atelectasis, lung infiltrate, tracheal stenosis, and COPD, respectively). The intensity of the color corresponds with the number of sequences that match with the putative species in the UNITE database at 97% similarity (logarithmic scale). The column at the left identifies the number of OTUs that showed a hit with the same species shown in the left column. Species present in less than 10% of the samples and with less than 100 sequences are not shown.
Figure 7
Figure 7
Distribution of fungal putative species detected in ENV samples. The intensity of the color corresponds with the number of sequences that showed a hit with the species in the UNITE database at 97% similarity (logarithmic scale). The column at the left shows the number of OTUs that corresponded to each of the putative species. The ones present in less than 10% of the samples and with less than 100 sequences are not shown.
Figure 8
Figure 8
Comparison between lung and environmental mycobiome. BAL and ENV profile of OTUs of each patient who permitted the analysis of both samples. The intensity of the color corresponds with the number of sequences that match with the species in the UNITE database at 97% (logarithmic scale). The column at the left shows the identification number of the OTU. The correspondent species are in the right column.
Figure 9
Figure 9
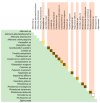
Concordance between the detection of fungi by culture and by the HTS method. Green background: Genera and species obtained by the culture. Pink background: same genera and species in the HTS analysis. The co-occurrence of detection in the same samples is represented by squares at the intersection. Dark squares: 100% of positive samples by culture were detected by HTS. Golden squares: 40% and 70% of coincidence in culture and HTS (from left to right and up to down). Yellow squares: from 17% to 25% of coincidence. Empty squares: Detection in different samples (0% coincidence).

References

    1. Lai G.C., Tan T.G., Pavelka N. The mammalian mycobiome: A complex system in a dynamic relationship with the host. Wiley Interdiscip. Rev. Syst. Biol. Med. 2019;11:e1438. doi: 10.1002/wsbm.1438. - DOI - PMC - PubMed
    1. Thomas S., Izard J., Walsh E., Batich K., Chongsathidkiet P., Clarke G., Sela D.A., Muller A.J., Mullin J.M., Albert K., et al. The Host Microbiome Regulates and Maintains Human Health: A Primer and Perspective for Non-Microbiologists. Cancer Res. 2017;77:1783–1812. doi: 10.1158/0008-5472.CAN-16-2929. - DOI - PMC - PubMed
    1. Enaud R., Vandenborght L.E., Coron N., Bazin T., Prevel R., Schaeverbeke T., Berger P., Fayon M., Lamireau T., Delhaes L. The Mycobiome: A Neglected Component in the M Microbiota-Gut-Brain Axis. Microorganisms. 2018;6:22. doi: 10.3390/microorganisms6010022. - DOI - PMC - PubMed
    1. Huffnagle G.B., Noverr M.C. The emerging world of the fungal microbiome. Trends Microbiol. 2013;21:334–341. doi: 10.1016/j.tim.2013.04.002. - DOI - PMC - PubMed
    1. Limon J.J., Skalski J.H., Underhill D.M. Commensal Fungi in Health and Disease. Cell Host Microbe. 2017;22:156–165. doi: 10.1016/j.chom.2017.07.002. - DOI - PMC - PubMed

LinkOut - more resources